
 Login Sign Up


| |||||
 |  | ||||

| 12Stocks.com Market Intelligence |
Best SmallCap Stocks
|
| In a hurry? Small Cap Stock Lists: Performance Trends Table, Stock Charts
Sort Small Cap stocks: Daily, Weekly, Year-to-Date, Market Cap & Trends. Filter Small Cap stocks list by sector: Show all, Tech, Finance, Energy, Staples, Retail, Industrial, Materials, Utilities and HealthCare Filter Small Cap stocks list by size: All Large Medium Small and MicroCap |
| 12Stocks.com Small Cap Stocks Performances & Trends Daily | |||||||||
|
|  The overall Smart Investing & Trading Score is 49 (0-bearish to 100-bullish) which puts Small Cap index in short term neutral trend. The Smart Investing & Trading Score from previous trading session is 14 and hence an improvement of trend.
| ||||||||
Here are the Smart Investing & Trading Scores of the most requested small cap stocks at 12Stocks.com (click stock name for detailed review):
|


| 12Stocks.com: Investing in Smallcap Index with Stocks | |
|
The following table helps investors and traders sort through current performance and trends (as measured by Smart Investing & Trading Score) of various
stocks in the Smallcap Index. Quick View: Move mouse or cursor over stock symbol (ticker) to view short-term technical chart and over stock name to view long term chart. Click on  to add stock symbol to your watchlist and to add stock symbol to your watchlist and  to view watchlist. Click on any ticker or stock name for detailed market intelligence report for that stock. to view watchlist. Click on any ticker or stock name for detailed market intelligence report for that stock. |
12Stocks.com Performance of Stocks in Smallcap Index
| Ticker | Stock Name | Watchlist | Category | Recent Price | Smart Investing & Trading Score | Change % | YTD Change% |
| CTKB | Cytek Biosciences |   | Health Care | 6.34 | 67 | -0.55% | -31.05% |
| SUM | Summit Materials | | Industrials | 39.10 | 0 | -0.33% | 1.66% |
| STBA | S&T Bancorp | | Financials | 31.53 | 93 | 2.07% | -5.66% |
| IBTX | Independent Bank | | Financials | 38.83 | 25 | 3.16% | -23.68% |
| CBZ | CBIZ | | Services & Goods | 72.55 | 25 | 1.65% | 15.91% |
| UHT | Universal Health | | Financials | 36.80 | 62 | 2.62% | -14.91% |
| PBF | PBF Energy | | Energy | 52.60 | 36 | 0.79% | 19.65% |
| OPK | OPKO Health | | Health Care | 1.31 | 90 | 3.15% | -13.25% |
| UE | Urban Edge | | Financials | 17.14 | 95 | 0.82% | -6.34% |
| ATSG | Air Transport | | Transports | 13.20 | 85 | 3.37% | -25.04% |
| BRCC | BRC | | Consumer Staples | 3.75 | 15 | 0.54% | 3.02% |
| UVV | Universal | | Consumer Staples | 52.84 | 90 | 1.23% | -21.51% |
| MDGL | Madrigal | | Health Care | 216.09 | 32 | 2.61% | -6.61% |
| GKOS | Glaukos | | Health Care | 105.03 | 100 | 6.19% | 32.13% |
| PJT | PJT Partners | | Financials | 98.46 | 64 | 5.26% | -3.35% |
| OSIS | OSI Systems | | Industrials | 135.65 | 50 | 3.49% | 5.11% |
| ALHC | Alignment Healthcare | | Health Care | 5.33 | 69 | 2.11% | -39.83% |
| IRON | Disc Medicine | | Health Care | 28.85 | 42 | 1.17% | -50.26% |
| HOPE | Hope Bancorp | | Financials | 10.62 | 37 | 3.61% | -12.09% |
| TNC | Tennant | | Industrials | 115.70 | 51 | 0.78% | 24.82% |
| LNN | Lindsay | | Industrials | 119.88 | 87 | 2.31% | -7.18% |
| CRVL | CorVel | | Financials | 241.29 | 37 | 0.27% | -2.39% |
| TWOU | 2U | | Technology | 0.27 | 39 | 9.30% | -78.11% |
| VCYT | Veracyte | | Health Care | 20.21 | 27 | 0.40% | -26.54% |
| MGY | Magnolia Oil | | Energy | 24.91 | 43 | 1.30% | 17.00% |


| Too many stocks? View smallcap stocks filtered by marketcap & sector |
| Marketcap: All SmallCap Stocks (default-no microcap), Large, Mid-Range, Small |
| Smallcap Sector: Tech, Finance, Energy, Staples, Retail, Industrial, Materials, & Medical |
|
Get the most comprehensive stock market coverage daily at 12Stocks.com ➞ Best Stocks Today ➞ Best Stocks Weekly ➞ Best Stocks Year-to-Date ➞ Best Stocks Trends ➞  Best Stocks Today 12Stocks.com Best Nasdaq Stocks ➞ Best S&P 500 Stocks ➞ Best Tech Stocks ➞ Best Biotech Stocks ➞ |
| Detailed Overview of SmallCap Stocks |
| SmallCap Technical Overview, Leaders & Laggards, Top SmallCap ETF Funds & Detailed SmallCap Stocks List, Charts, Trends & More |
| Smallcap: Technical Analysis, Trends & YTD Performance | |
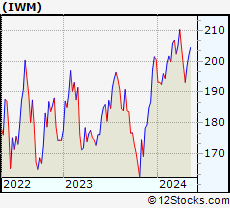
| SmallCap segment as represented by
IWM, an exchange-traded fund [ETF], holds basket of thousands of smallcap stocks from across all major sectors of the US stock market. The smallcap index (contains stocks like Riverbed & Sotheby's) is down by -0.39% and is currently underperforming the overall market by -6.01% year-to-date. Below is a quick view of technical charts and trends: | |
 IWM Weekly Chart |
|
| Long Term Trend: Not Good | |
| Medium Term Trend: Good | |
 IWM Daily Chart |
|
| Short Term Trend: Deteriorating | |
| Overall Trend Score: 49 | |
| YTD Performance: -0.39% | |
| **Trend Scores & Views Are Only For Educational Purposes And Not For Investing | |
| 12Stocks.com: Top Performing Small Cap Index Stocks | ||||||||||||||||||||||||||||||||||||||||||||||||
 The top performing Small Cap Index stocks year to date are
Now, more recently, over last week, the top performing Small Cap Index stocks on the move are


|
||||||||||||||||||||||||||||||||||||||||||||||||
| 12Stocks.com: Investing in Smallcap Index using Exchange Traded Funds | |
|
The following table shows list of key exchange traded funds (ETF) that
help investors track Smallcap index. The following list also includes leveraged ETF funds that track twice or thrice the daily returns of Smallcap indices. Short or inverse ETF funds move in the opposite direction to the index they track and are useful during market pullbacks or during bear markets. Quick View: Move mouse or cursor over ETF symbol (ticker) to view short-term technical chart and over ETF name to view long term chart. Click on ticker or stock name for detailed view. Click on to add stock symbol to your watchlist and to view watchlist. |
12Stocks.com List of ETFs that track Smallcap Index
| Ticker | ETF Name | Watchlist | Recent Price | Smart Investing & Trading Score | Change % | Week % | Year-to-date % |
| IWM | iShares Russell 2000 | | 199.92 | 49 | 1.84 | 0.77 | -0.39% |
| IJR | iShares Core S&P Small-Cap | | 106.33 | 50 | 1.52 | 0.64 | -1.77% |
| VTWO | Vanguard Russell 2000 ETF | | 80.83 | 7 | 1.85 | 0.76 | -0.33% |
| IWN | iShares Russell 2000 Value | | 152.88 | 57 | 2.04 | 1.15 | -1.58% |
| IWO | iShares Russell 2000 Growth | | 254.34 | 17 | 1.91 | 0.49 | 0.84% |
| IJS | iShares S&P Small-Cap 600 Value | | 98.02 | 13 | 1.68 | 0.85 | -4.9% |
| IJT | iShares S&P Small-Cap 600 Growth | | 126.47 | 20 | 1.22 | 0.3 | 1.06% |
| XSLV | PowerShares S&P SmallCap Low Volatil ETF | | 43.19 | 42 | 0.84 | 1.1 | -2.17% |
| SDD | ProShares UltraShort SmallCap600 | | 19.31 | 61 | -2.02 | -0.21 | 4.79% |
| SMLV | SPDR SSGA US Small Cap Low Volatil ETF | | 108.83 | 44 | 1.30 | 1.22 | -3.27% |
| SAA | ProShares Ultra SmallCap600 | | 22.93 | 32 | 1.56 | -0.46 | -8.08% |
| SBB | ProShares Short SmallCap600 | | 16.37 | 71 | -1.14 | -0.09 | 2.76% |
| 12Stocks.com: Charts, Trends, Fundamental Data and Performances of SmallCap Stocks | |
|
We now take in-depth look at all SmallCap stocks including charts, multi-period performances and overall trends (as measured by Smart Investing & Trading Score). One can sort SmallCap stocks (click link to choose) by Daily, Weekly and by Year-to-Date performances. Also, one can sort by size of the company or by market capitalization. |
| Select Your Default Chart Type: | |||||
| |||||
| Click on stock symbol or name for detailed view. Click on to add stock symbol to your watchlist and to view watchlist. Quick View: Move mouse or cursor over "Daily" to quickly view daily technical stock chart and over "Weekly" to view weekly technical stock chart. | |||||

 | CTKB Cytek Biosciences, Inc. |
| Sector: Health Care | |
| SubSector: Medical Devices | |
| MarketCap: 1140 Millions | |
| Recent Price: 6.34 Smart Investing & Trading Score: 67 | |
| Day Percent Change: -0.55% Day Change: -0.04 | |
| Week Change: 10.07% Year-to-date Change: -31.1% | |
| CTKB Links: Profile News Message Board | |
| Charts:- Daily , Weekly | |
| Add CTKB to Watchlist: View: Get Complete CTKB Trend Analysis ➞ | |
 | SUM Summit Materials, Inc. |
| Sector: Industrials | |
| SubSector: General Building Materials | |
| MarketCap: 1138.23 Millions | |
| Recent Price: 39.10 Smart Investing & Trading Score: 0 | |
| Day Percent Change: -0.33% Day Change: -0.13 | |
| Week Change: -2.25% Year-to-date Change: 1.7% | |
| SUM Links: Profile News Message Board | |
| Charts:- Daily , Weekly | |
| Add SUM to Watchlist: View: Get Complete SUM Trend Analysis ➞ | |
 | STBA S&T Bancorp, Inc. |
| Sector: Financials | |
| SubSector: Regional - Northeast Banks | |
| MarketCap: 1136.99 Millions | |
| Recent Price: 31.53 Smart Investing & Trading Score: 93 | |
| Day Percent Change: 2.07% Day Change: 0.64 | |
| Week Change: 1.78% Year-to-date Change: -5.7% | |
| STBA Links: Profile News Message Board | |
| Charts:- Daily , Weekly | |
| Add STBA to Watchlist: View: Get Complete STBA Trend Analysis ➞ | |
 | IBTX Independent Bank Group, Inc. |
| Sector: Financials | |
| SubSector: Regional - Southeast Banks | |
| MarketCap: 1133.35 Millions | |
| Recent Price: 38.83 Smart Investing & Trading Score: 25 | |
| Day Percent Change: 3.16% Day Change: 1.19 | |
| Week Change: -1.3% Year-to-date Change: -23.7% | |
| IBTX Links: Profile News Message Board | |
| Charts:- Daily , Weekly | |
| Add IBTX to Watchlist: View: Get Complete IBTX Trend Analysis ➞ | |
 | CBZ CBIZ, Inc. |
| Sector: Services & Goods | |
| SubSector: Business Services | |
| MarketCap: 1121.32 Millions | |
| Recent Price: 72.55 Smart Investing & Trading Score: 25 | |
| Day Percent Change: 1.65% Day Change: 1.18 | |
| Week Change: -0.29% Year-to-date Change: 15.9% | |
| CBZ Links: Profile News Message Board | |
| Charts:- Daily , Weekly | |
| Add CBZ to Watchlist: View: Get Complete CBZ Trend Analysis ➞ | |
 | UHT Universal Health Realty Income Trust |
| Sector: Financials | |
| SubSector: REIT - Healthcare Facilities | |
| MarketCap: 1121.14 Millions | |
| Recent Price: 36.80 Smart Investing & Trading Score: 62 | |
| Day Percent Change: 2.62% Day Change: 0.94 | |
| Week Change: 6.17% Year-to-date Change: -14.9% | |
| UHT Links: Profile News Message Board | |
| Charts:- Daily , Weekly | |
| Add UHT to Watchlist: View: Get Complete UHT Trend Analysis ➞ | |
 | PBF PBF Energy Inc |
| Sector: Energy | |
| SubSector: Oil & Gas Refining & Marketing | |
| MarketCap: 1118.54 Millions | |
| Recent Price: 52.60 Smart Investing & Trading Score: 36 | |
| Day Percent Change: 0.79% Day Change: 0.41 | |
| Week Change: -8.97% Year-to-date Change: 19.7% | |
| PBF Links: Profile News Message Board | |
| Charts:- Daily , Weekly | |
| Add PBF to Watchlist: View: Get Complete PBF Trend Analysis ➞ | |
 | OPK OPKO Health, Inc. |
| Sector: Health Care | |
| SubSector: Biotechnology | |
| MarketCap: 1116.05 Millions | |
| Recent Price: 1.31 Smart Investing & Trading Score: 90 | |
| Day Percent Change: 3.15% Day Change: 0.04 | |
| Week Change: 3.97% Year-to-date Change: -13.3% | |
| OPK Links: Profile News Message Board | |
| Charts:- Daily , Weekly | |
| Add OPK to Watchlist: View: Get Complete OPK Trend Analysis ➞ | |
 | UE Urban Edge Properties |
| Sector: Financials | |
| SubSector: REIT - Diversified | |
| MarketCap: 1112.33 Millions | |
| Recent Price: 17.14 Smart Investing & Trading Score: 95 | |
| Day Percent Change: 0.82% Day Change: 0.14 | |
| Week Change: 3.82% Year-to-date Change: -6.3% | |
| UE Links: Profile News Message Board | |
| Charts:- Daily , Weekly | |
| Add UE to Watchlist: View: Get Complete UE Trend Analysis ➞ | |
 | ATSG Air Transport Services Group, Inc. |
| Sector: Transports | |
| SubSector: Air Delivery & Freight Services | |
| MarketCap: 1111.68 Millions | |
| Recent Price: 13.20 Smart Investing & Trading Score: 85 | |
| Day Percent Change: 3.37% Day Change: 0.43 | |
| Week Change: 2.25% Year-to-date Change: -25.0% | |
| ATSG Links: Profile News Message Board | |
| Charts:- Daily , Weekly | |
| Add ATSG to Watchlist: View: Get Complete ATSG Trend Analysis ➞ | |
 | BRCC BRC Inc. |
| Sector: Consumer Staples | |
| SubSector: Packaged Foods | |
| MarketCap: 1110 Millions | |
| Recent Price: 3.75 Smart Investing & Trading Score: 15 | |
| Day Percent Change: 0.54% Day Change: 0.02 | |
| Week Change: -8.76% Year-to-date Change: 3.0% | |
| BRCC Links: Profile News Message Board | |
| Charts:- Daily , Weekly | |
| Add BRCC to Watchlist: View: Get Complete BRCC Trend Analysis ➞ | |
 | UVV Universal Corporation |
| Sector: Consumer Staples | |
| SubSector: Tobacco Products, Other | |
| MarketCap: 1107.7 Millions | |
| Recent Price: 52.84 Smart Investing & Trading Score: 90 | |
| Day Percent Change: 1.23% Day Change: 0.64 | |
| Week Change: 4.02% Year-to-date Change: -21.5% | |
| UVV Links: Profile News Message Board | |
| Charts:- Daily , Weekly | |
| Add UVV to Watchlist: View: Get Complete UVV Trend Analysis ➞ | |
 | MDGL Madrigal Pharmaceuticals, Inc. |
| Sector: Health Care | |
| SubSector: Biotechnology | |
| MarketCap: 1104.35 Millions | |
| Recent Price: 216.09 Smart Investing & Trading Score: 32 | |
| Day Percent Change: 2.61% Day Change: 5.50 | |
| Week Change: 11.77% Year-to-date Change: -6.6% | |
| MDGL Links: Profile News Message Board | |
| Charts:- Daily , Weekly | |
| Add MDGL to Watchlist: View: Get Complete MDGL Trend Analysis ➞ | |
 | GKOS Glaukos Corporation |
| Sector: Health Care | |
| SubSector: Medical Instruments & Supplies | |
| MarketCap: 1103.6 Millions | |
| Recent Price: 105.03 Smart Investing & Trading Score: 100 | |
| Day Percent Change: 6.19% Day Change: 6.12 | |
| Week Change: 5.58% Year-to-date Change: 32.1% | |
| GKOS Links: Profile News Message Board | |
| Charts:- Daily , Weekly | |
| Add GKOS to Watchlist: View: Get Complete GKOS Trend Analysis ➞ | |
 | PJT PJT Partners Inc. |
| Sector: Financials | |
| SubSector: Asset Management | |
| MarketCap: 1100.93 Millions | |
| Recent Price: 98.46 Smart Investing & Trading Score: 64 | |
| Day Percent Change: 5.26% Day Change: 4.92 | |
| Week Change: 4.64% Year-to-date Change: -3.4% | |
| PJT Links: Profile News Message Board | |
| Charts:- Daily , Weekly | |
| Add PJT to Watchlist: View: Get Complete PJT Trend Analysis ➞ | |
 | OSIS OSI Systems, Inc. |
| Sector: Industrials | |
| SubSector: Industrial Electrical Equipment | |
| MarketCap: 1100.39 Millions | |
| Recent Price: 135.65 Smart Investing & Trading Score: 50 | |
| Day Percent Change: 3.49% Day Change: 4.58 | |
| Week Change: 0.62% Year-to-date Change: 5.1% | |
| OSIS Links: Profile News Message Board | |
| Charts:- Daily , Weekly | |
| Add OSIS to Watchlist: View: Get Complete OSIS Trend Analysis ➞ | |
 | ALHC Alignment Healthcare, Inc. |
| Sector: Health Care | |
| SubSector: Healthcare Plans | |
| MarketCap: 1100 Millions | |
| Recent Price: 5.33 Smart Investing & Trading Score: 69 | |
| Day Percent Change: 2.11% Day Change: 0.11 | |
| Week Change: 1.91% Year-to-date Change: -39.8% | |
| ALHC Links: Profile News Message Board | |
| Charts:- Daily , Weekly | |
| Add ALHC to Watchlist: View: Get Complete ALHC Trend Analysis ➞ | |
 | IRON Disc Medicine Opco Inc |
| Sector: Health Care | |
| SubSector: Biotechnology | |
| MarketCap: 1100 Millions | |
| Recent Price: 28.85 Smart Investing & Trading Score: 42 | |
| Day Percent Change: 1.17% Day Change: 0.34 | |
| Week Change: 4.89% Year-to-date Change: -50.3% | |
| IRON Links: Profile News Message Board | |
| Charts:- Daily , Weekly | |
| Add IRON to Watchlist: View: Get Complete IRON Trend Analysis ➞ | |
 | HOPE Hope Bancorp, Inc. |
| Sector: Financials | |
| SubSector: Regional - Pacific Banks | |
| MarketCap: 1099.29 Millions | |
| Recent Price: 10.62 Smart Investing & Trading Score: 37 | |
| Day Percent Change: 3.61% Day Change: 0.37 | |
| Week Change: -3.1% Year-to-date Change: -12.1% | |
| HOPE Links: Profile News Message Board | |
| Charts:- Daily , Weekly | |
| Add HOPE to Watchlist: View: Get Complete HOPE Trend Analysis ➞ | |
 | TNC Tennant Company |
| Sector: Industrials | |
| SubSector: Diversified Machinery | |
| MarketCap: 1097.96 Millions | |
| Recent Price: 115.70 Smart Investing & Trading Score: 51 | |
| Day Percent Change: 0.78% Day Change: 0.90 | |
| Week Change: 0.06% Year-to-date Change: 24.8% | |
| TNC Links: Profile News Message Board | |
| Charts:- Daily , Weekly | |
| Add TNC to Watchlist: View: Get Complete TNC Trend Analysis ➞ | |
 | LNN Lindsay Corporation |
| Sector: Industrials | |
| SubSector: Farm & Construction Machinery | |
| MarketCap: 1097.57 Millions | |
| Recent Price: 119.88 Smart Investing & Trading Score: 87 | |
| Day Percent Change: 2.31% Day Change: 2.71 | |
| Week Change: 3.13% Year-to-date Change: -7.2% | |
| LNN Links: Profile News Message Board | |
| Charts:- Daily , Weekly | |
| Add LNN to Watchlist: View: Get Complete LNN Trend Analysis ➞ | |
 | CRVL CorVel Corporation |
| Sector: Financials | |
| SubSector: Insurance Brokers | |
| MarketCap: 1090.67 Millions | |
| Recent Price: 241.29 Smart Investing & Trading Score: 37 | |
| Day Percent Change: 0.27% Day Change: 0.66 | |
| Week Change: 1.11% Year-to-date Change: -2.4% | |
| CRVL Links: Profile News Message Board | |
| Charts:- Daily , Weekly | |
| Add CRVL to Watchlist: View: Get Complete CRVL Trend Analysis ➞ | |
 | TWOU 2U, Inc. |
| Sector: Technology | |
| SubSector: Application Software | |
| MarketCap: 1090.12 Millions | |
| Recent Price: 0.27 Smart Investing & Trading Score: 39 | |
| Day Percent Change: 9.30% Day Change: 0.02 | |
| Week Change: 12.03% Year-to-date Change: -78.1% | |
| TWOU Links: Profile News Message Board | |
| Charts:- Daily , Weekly | |
| Add TWOU to Watchlist: View: Get Complete TWOU Trend Analysis ➞ | |
 | VCYT Veracyte, Inc. |
| Sector: Health Care | |
| SubSector: Biotechnology | |
| MarketCap: 1089.05 Millions | |
| Recent Price: 20.21 Smart Investing & Trading Score: 27 | |
| Day Percent Change: 0.40% Day Change: 0.08 | |
| Week Change: 4.66% Year-to-date Change: -26.5% | |
| VCYT Links: Profile News Message Board | |
| Charts:- Daily , Weekly | |
| Add VCYT to Watchlist: View: Get Complete VCYT Trend Analysis ➞ | |
 | MGY Magnolia Oil & Gas Corporation |
| Sector: Energy | |
| SubSector: Independent Oil & Gas | |
| MarketCap: 1088.93 Millions | |
| Recent Price: 24.91 Smart Investing & Trading Score: 43 | |
| Day Percent Change: 1.30% Day Change: 0.32 | |
| Week Change: -5.43% Year-to-date Change: 17.0% | |
| MGY Links: Profile News Message Board | |
| Charts:- Daily , Weekly | |
| Add MGY to Watchlist: View: Get Complete MGY Trend Analysis ➞ | |
| Too many stocks? View smallcap stocks filtered by marketcap & sector |
| Marketcap: All SmallCap Stocks (default-no microcap), Large, Mid-Range, Small & MicroCap |
| Sector: Tech, Finance, Energy, Staples, Retail, Industrial, Materials, Utilities & Medical |
|
Best Stocks Today 12Stocks.com |
© 2024 12Stocks.com Terms & Conditions Privacy Contact Us
All Information Provided Only For Education And Not To Be Used For Investing or Trading. See Terms & Conditions


One More Thing ... Get Best Stocks Delivered Daily!
Never Ever Miss A Move With Our Top Ten Stocks Lists
Find Best Stocks In Any Market - Bull or Bear Market
Take A Peek At Our Top Ten Stocks Lists: Daily, Weekly, Year-to-Date & Top Trends
Find Best Stocks In Any Market - Bull or Bear Market
Take A Peek At Our Top Ten Stocks Lists: Daily, Weekly, Year-to-Date & Top Trends
Smallcap Stocks With Best Up Trends [0-bearish to 100-bullish]: Emergent BioSolutions[100], Aspen Aerogels[100], Perdoceo Education[100], Gannett Co[100], Pitney Bowes[100], Benchmark Electronics[100], Origin Materials[100], FormFactor [100], Lantheus [100], Q2 [100], Blueprint Medicines[100]
Best Smallcap Stocks Year-to-Date:
Janux [440.16%], Viking [307.15%], Longboard [273.98%], Alpine Immune[239.23%], Bakkt [187.89%], Avidity Biosciences[182.96%], Vera [170.74%], Cullinan Oncology[169.74%], Super Micro[168.13%], Arcutis Bio[166.1%], Y-mAbs [153.08%] Best Smallcap Stocks This Week:
Deciphera [73.17%], Emergent BioSolutions[71.88%], Eyenovia [48.36%], Aspen Aerogels[47.89%], P3 Health[38.51%], Carvana Co[38.18%], Cue Biopharma[36.26%], Origin Materials[36.24%], TransMedics Group[35.13%], Seres [33.33%], Enovix [32.07%] Best Smallcap Stocks Daily:
Emergent BioSolutions[70.98%], Aspen Aerogels[56.44%], Carvana Co[33.77%], Perdoceo Education[31.79%], Enovix [31.06%], Office Properties[29.00%], Gannett Co[26.97%], Sunnova Energy[25.21%], Pitney Bowes[24.70%], Pulmonx [21.37%], CommScope Holding[20.38%]