
 Login Sign Up


| |||||
 |  | ||||

| 12Stocks.com Market Intelligence |
Best SmallCap Stocks
|
| In a hurry? Small Cap Stock Lists: Performance Trends Table, Stock Charts
Sort Small Cap stocks: Daily, Weekly, Year-to-Date, Market Cap & Trends. Filter Small Cap stocks list by sector: Show all, Tech, Finance, Energy, Staples, Retail, Industrial, Materials, Utilities and HealthCare Filter Small Cap stocks list by size: All Large Medium Small and MicroCap |
| 12Stocks.com Small Cap Stocks Performances & Trends Daily | |||||||||
|
|  The overall Smart Investing & Trading Score is 14 (0-bearish to 100-bullish) which puts Small Cap index in short term bearish trend. The Smart Investing & Trading Score from previous trading session is 41 and hence a deterioration of trend.
| ||||||||
Here are the Smart Investing & Trading Scores of the most requested small cap stocks at 12Stocks.com (click stock name for detailed review):
|


| 12Stocks.com: Investing in Smallcap Index with Stocks | |
|
The following table helps investors and traders sort through current performance and trends (as measured by Smart Investing & Trading Score) of various
stocks in the Smallcap Index. Quick View: Move mouse or cursor over stock symbol (ticker) to view short-term technical chart and over stock name to view long term chart. Click on  to add stock symbol to your watchlist and to add stock symbol to your watchlist and  to view watchlist. Click on any ticker or stock name for detailed market intelligence report for that stock. to view watchlist. Click on any ticker or stock name for detailed market intelligence report for that stock. |
12Stocks.com Performance of Stocks in Smallcap Index
| Ticker | Stock Name | Watchlist | Category | Recent Price | Smart Investing & Trading Score | Change % | YTD Change% |
| PLSE | Pulse Biosciences |   | Health Care | 7.60 | 64 | 3.12% | -37.91% |
| CHRS | Coherus BioSciences | | Health Care | 2.06 | 35 | 5.10% | -38.14% |
| ORGO | Organogenesis | | Health Care | 2.51 | 42 | 6.81% | -38.63% |
| SAGE | Sage | | Health Care | 13.28 | 10 | -4.73% | -38.72% |
| ACCD | Accolade | | Health Care | 7.36 | 0 | -3.54% | -38.77% |
| NEOG | Neogen | | Health Care | 12.25 | 42 | -0.65% | -39.09% |
| DCGO | DocGo | | Health Care | 3.40 | 39 | 0.44% | -39.27% |
| LUNG | Pulmonx | | Health Care | 7.72 | 49 | 1.45% | -39.45% |
| RLAY | Relay | | Health Care | 6.66 | 54 | 2.15% | -39.45% |
| QTRX | Quanterix | | Health Care | 16.49 | 42 | 2.30% | -39.69% |
| PMVP | PMV | | Health Care | 1.86 | 100 | 3.33% | -40.00% |
| PRTA | Prothena | | Health Care | 21.42 | 59 | 5.31% | -41.06% |
| ALHC | Alignment Healthcare | | Health Care | 5.21 | 52 | 1.26% | -41.07% |
| AUPH | Aurinia | | Health Care | 5.20 | 74 | 2.16% | -42.16% |
| PRME | Prime Medicine | | Health Care | 5.27 | 69 | 7.01% | -42.21% |
| SLRN | Acelyrin | | Health Care | 4.25 | 27 | 1.92% | -42.33% |
| XAIR | Beyond Air | | Health Care | 1.13 | 27 | 4.63% | -42.35% |
| ADPT | Adaptive Bio | | Health Care | 2.79 | 54 | 6.49% | -43.06% |
| ME | 23andMe Holding | | Health Care | 0.50 | 59 | 0.30% | -43.74% |
| CABA | Cabaletta Bio | | Health Care | 12.41 | 42 | 16.58% | -45.33% |
| ACAD | ACADIA | | Health Care | 17.05 | 57 | 2.03% | -45.54% |
| EDIT | Editas Medicine | | Health Care | 5.47 | 42 | 4.99% | -46.00% |
| EMBC | Embecta | | Health Care | 10.13 | 25 | -0.25% | -47.00% |
| OM | Outset Medical | | Health Care | 2.85 | 74 | 12.65% | -47.32% |
| PETS | PetMed Express | | Health Care | 3.96 | 20 | 0.25% | -47.62% |
| For chart view version of above stock list: Chart View ➞ 0 - 25 , 25 - 50 , 50 - 75 , 75 - 100 , 100 - 125 , 125 - 150 , 150 - 175 , 175 - 200 , 200 - 225 , 225 - 250 , 250 - 275 , 275 - 300 , 300 - 325 , 325 - 350 | ||
 | Click To Change The Sort Order: By Market Cap or Company Size Performance: Year-to-date, Week and Day |  |
| Too many stocks? View smallcap stocks filtered by marketcap & sector |
| Marketcap: All SmallCap Stocks (default-no microcap), Large, Mid-Range, Small |
| Smallcap Sector: Tech, Finance, Energy, Staples, Retail, Industrial, Materials, & Medical |
|
Get the most comprehensive stock market coverage daily at 12Stocks.com ➞ Best Stocks Today ➞ Best Stocks Weekly ➞ Best Stocks Year-to-Date ➞ Best Stocks Trends ➞  Best Stocks Today 12Stocks.com Best Nasdaq Stocks ➞ Best S&P 500 Stocks ➞ Best Tech Stocks ➞ Best Biotech Stocks ➞ |
| Detailed Overview of SmallCap Stocks |
| SmallCap Technical Overview, Leaders & Laggards, Top SmallCap ETF Funds & Detailed SmallCap Stocks List, Charts, Trends & More |
| Smallcap: Technical Analysis, Trends & YTD Performance | |
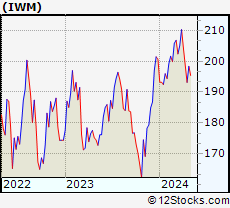
| SmallCap segment as represented by
IWM, an exchange-traded fund [ETF], holds basket of thousands of smallcap stocks from across all major sectors of the US stock market. The smallcap index (contains stocks like Riverbed & Sotheby's) is down by -2.19% and is currently underperforming the overall market by -6.73% year-to-date. Below is a quick view of technical charts and trends: | |
 IWM Weekly Chart |
|
| Long Term Trend: Not Good | |
| Medium Term Trend: Not Good | |
 IWM Daily Chart |
|
| Short Term Trend: Not Good | |
| Overall Trend Score: 14 | |
| YTD Performance: -2.19% | |
| **Trend Scores & Views Are Only For Educational Purposes And Not For Investing | |
| 12Stocks.com: Top Performing Small Cap Index Stocks | ||||||||||||||||||||||||||||||||||||||||||||||||
 The top performing Small Cap Index stocks year to date are
Now, more recently, over last week, the top performing Small Cap Index stocks on the move are


|
||||||||||||||||||||||||||||||||||||||||||||||||
| 12Stocks.com: Investing in Smallcap Index using Exchange Traded Funds | |
|
The following table shows list of key exchange traded funds (ETF) that
help investors track Smallcap index. The following list also includes leveraged ETF funds that track twice or thrice the daily returns of Smallcap indices. Short or inverse ETF funds move in the opposite direction to the index they track and are useful during market pullbacks or during bear markets. Quick View: Move mouse or cursor over ETF symbol (ticker) to view short-term technical chart and over ETF name to view long term chart. Click on ticker or stock name for detailed view. Click on to add stock symbol to your watchlist and to view watchlist. |
12Stocks.com List of ETFs that track Smallcap Index
| Ticker | ETF Name | Watchlist | Recent Price | Smart Investing & Trading Score | Change % | Week % | Year-to-date % |
| IWM | iShares Russell 2000 | | 196.31 | 14 | 0.21 | -1.05 | -2.19% |
| IJR | iShares Core S&P Small-Cap | | 104.74 | 22 | 0.34 | -0.86 | -3.24% |
| VTWO | Vanguard Russell 2000 ETF | | 79.36 | 14 | 0.25 | -1.07 | -2.15% |
| IWN | iShares Russell 2000 Value | | 149.82 | 22 | 0.52 | -0.87 | -3.55% |
| IJS | iShares S&P Small-Cap 600 Value | | 96.40 | 15 | 0.33 | -0.81 | -6.47% |
| IWO | iShares Russell 2000 Growth | | 249.58 | 7 | -0.30 | -1.39 | -1.05% |
| IJT | iShares S&P Small-Cap 600 Growth | | 124.94 | 15 | 0.27 | -0.91 | -0.16% |
| XSLV | PowerShares S&P SmallCap Low Volatil ETF | | 42.83 | 62 | 0.68 | 0.26 | -2.99% |
| SDD | ProShares UltraShort SmallCap600 | | 19.71 | 86 | 0.70 | 1.85 | 6.95% |
| SMLV | SPDR SSGA US Small Cap Low Volatil ETF | | 107.44 | 45 | 1.11 | -0.07 | -4.51% |
| SBB | ProShares Short SmallCap600 | | 16.56 | 79 | 0.05 | 1.06 | 3.94% |
| SAA | ProShares Ultra SmallCap600 | | 22.58 | 8 | -0.08 | -1.99 | -9.49% |
| 12Stocks.com: Charts, Trends, Fundamental Data and Performances of SmallCap Stocks | |
|
We now take in-depth look at all SmallCap stocks including charts, multi-period performances and overall trends (as measured by Smart Investing & Trading Score). One can sort SmallCap stocks (click link to choose) by Daily, Weekly and by Year-to-Date performances. Also, one can sort by size of the company or by market capitalization. |
| Select Your Default Chart Type: | |||||
| |||||
| Click on stock symbol or name for detailed view. Click on to add stock symbol to your watchlist and to view watchlist. Quick View: Move mouse or cursor over "Daily" to quickly view daily technical stock chart and over "Weekly" to view weekly technical stock chart. | |||||

 | PLSE Pulse Biosciences, Inc. |
| Sector: Health Care | |
| SubSector: Medical Instruments & Supplies | |
| MarketCap: 131.96 Millions | |
| Recent Price: 7.60 Smart Investing & Trading Score: 64 | |
| Day Percent Change: 3.12% Day Change: 0.23 | |
| Week Change: 5.7% Year-to-date Change: -37.9% | |
| PLSE Links: Profile News Message Board | |
| Charts:- Daily , Weekly | |
| Add PLSE to Watchlist: View: Get Complete PLSE Trend Analysis ➞ | |
 | CHRS Coherus BioSciences, Inc. |
| Sector: Health Care | |
| SubSector: Biotechnology | |
| MarketCap: 1073.45 Millions | |
| Recent Price: 2.06 Smart Investing & Trading Score: 35 | |
| Day Percent Change: 5.10% Day Change: 0.10 | |
| Week Change: 0.98% Year-to-date Change: -38.1% | |
| CHRS Links: Profile News Message Board | |
| Charts:- Daily , Weekly | |
| Add CHRS to Watchlist: View: Get Complete CHRS Trend Analysis ➞ | |
 | ORGO Organogenesis Holdings Inc. |
| Sector: Health Care | |
| SubSector: Drugs - Generic | |
| MarketCap: 239.685 Millions | |
| Recent Price: 2.51 Smart Investing & Trading Score: 42 | |
| Day Percent Change: 6.81% Day Change: 0.16 | |
| Week Change: 6.81% Year-to-date Change: -38.6% | |
| ORGO Links: Profile News Message Board | |
| Charts:- Daily , Weekly | |
| Add ORGO to Watchlist: View: Get Complete ORGO Trend Analysis ➞ | |
 | SAGE Sage Therapeutics, Inc. |
| Sector: Health Care | |
| SubSector: Biotechnology | |
| MarketCap: 1683.75 Millions | |
| Recent Price: 13.28 Smart Investing & Trading Score: 10 | |
| Day Percent Change: -4.73% Day Change: -0.66 | |
| Week Change: -2.99% Year-to-date Change: -38.7% | |
| SAGE Links: Profile News Message Board | |
| Charts:- Daily , Weekly | |
| Add SAGE to Watchlist: View: Get Complete SAGE Trend Analysis ➞ | |
 | ACCD Accolade, Inc. |
| Sector: Health Care | |
| SubSector: Health Information Services | |
| MarketCap: 32987 Millions | |
| Recent Price: 7.36 Smart Investing & Trading Score: 0 | |
| Day Percent Change: -3.54% Day Change: -0.27 | |
| Week Change: -6.72% Year-to-date Change: -38.8% | |
| ACCD Links: Profile News Message Board | |
| Charts:- Daily , Weekly | |
| Add ACCD to Watchlist: View: Get Complete ACCD Trend Analysis ➞ | |
 | NEOG Neogen Corporation |
| Sector: Health Care | |
| SubSector: Diagnostic Substances | |
| MarketCap: 3234.71 Millions | |
| Recent Price: 12.25 Smart Investing & Trading Score: 42 | |
| Day Percent Change: -0.65% Day Change: -0.08 | |
| Week Change: 0.91% Year-to-date Change: -39.1% | |
| NEOG Links: Profile News Message Board | |
| Charts:- Daily , Weekly | |
| Add NEOG to Watchlist: View: Get Complete NEOG Trend Analysis ➞ | |
 | DCGO DocGo Inc. |
| Sector: Health Care | |
| SubSector: Medical Care Facilities | |
| MarketCap: 972 Millions | |
| Recent Price: 3.40 Smart Investing & Trading Score: 39 | |
| Day Percent Change: 0.44% Day Change: 0.02 | |
| Week Change: -5.96% Year-to-date Change: -39.3% | |
| DCGO Links: Profile News Message Board | |
| Charts:- Daily , Weekly | |
| Add DCGO to Watchlist: View: Get Complete DCGO Trend Analysis ➞ | |
 | LUNG Pulmonx Corporation |
| Sector: Health Care | |
| SubSector: Medical Devices | |
| MarketCap: 18187 Millions | |
| Recent Price: 7.72 Smart Investing & Trading Score: 49 | |
| Day Percent Change: 1.45% Day Change: 0.11 | |
| Week Change: 6.04% Year-to-date Change: -39.5% | |
| LUNG Links: Profile News Message Board | |
| Charts:- Daily , Weekly | |
| Add LUNG to Watchlist: View: Get Complete LUNG Trend Analysis ➞ | |
 | RLAY Relay Therapeutics, Inc. |
| Sector: Health Care | |
| SubSector: Biotechnology | |
| MarketCap: 45887 Millions | |
| Recent Price: 6.66 Smart Investing & Trading Score: 54 | |
| Day Percent Change: 2.15% Day Change: 0.14 | |
| Week Change: 4.55% Year-to-date Change: -39.5% | |
| RLAY Links: Profile News Message Board | |
| Charts:- Daily , Weekly | |
| Add RLAY to Watchlist: View: Get Complete RLAY Trend Analysis ➞ | |
 | QTRX Quanterix Corporation |
| Sector: Health Care | |
| SubSector: Biotechnology | |
| MarketCap: 448.685 Millions | |
| Recent Price: 16.49 Smart Investing & Trading Score: 42 | |
| Day Percent Change: 2.30% Day Change: 0.37 | |
| Week Change: 5.98% Year-to-date Change: -39.7% | |
| QTRX Links: Profile News Message Board | |
| Charts:- Daily , Weekly | |
| Add QTRX to Watchlist: View: Get Complete QTRX Trend Analysis ➞ | |
 | PMVP PMV Pharmaceuticals, Inc. |
| Sector: Health Care | |
| SubSector: Biotechnology | |
| MarketCap: 20187 Millions | |
| Recent Price: 1.86 Smart Investing & Trading Score: 100 | |
| Day Percent Change: 3.33% Day Change: 0.06 | |
| Week Change: 6.29% Year-to-date Change: -40.0% | |
| PMVP Links: Profile News Message Board | |
| Charts:- Daily , Weekly | |
| Add PMVP to Watchlist: View: Get Complete PMVP Trend Analysis ➞ | |
 | PRTA Prothena Corporation plc |
| Sector: Health Care | |
| SubSector: Biotechnology | |
| MarketCap: 357.985 Millions | |
| Recent Price: 21.42 Smart Investing & Trading Score: 59 | |
| Day Percent Change: 5.31% Day Change: 1.08 | |
| Week Change: 2.64% Year-to-date Change: -41.1% | |
| PRTA Links: Profile News Message Board | |
| Charts:- Daily , Weekly | |
| Add PRTA to Watchlist: View: Get Complete PRTA Trend Analysis ➞ | |
 | ALHC Alignment Healthcare, Inc. |
| Sector: Health Care | |
| SubSector: Healthcare Plans | |
| MarketCap: 1100 Millions | |
| Recent Price: 5.21 Smart Investing & Trading Score: 52 | |
| Day Percent Change: 1.26% Day Change: 0.06 | |
| Week Change: -0.19% Year-to-date Change: -41.1% | |
| ALHC Links: Profile News Message Board | |
| Charts:- Daily , Weekly | |
| Add ALHC to Watchlist: View: Get Complete ALHC Trend Analysis ➞ | |
 | AUPH Aurinia Pharmaceuticals Inc. |
| Sector: Health Care | |
| SubSector: Biotechnology | |
| MarketCap: 1319.75 Millions | |
| Recent Price: 5.20 Smart Investing & Trading Score: 74 | |
| Day Percent Change: 2.16% Day Change: 0.11 | |
| Week Change: 5.91% Year-to-date Change: -42.2% | |
| AUPH Links: Profile News Message Board | |
| Charts:- Daily , Weekly | |
| Add AUPH to Watchlist: View: Get Complete AUPH Trend Analysis ➞ | |
 | PRME Prime Medicine, Inc. |
| Sector: Health Care | |
| SubSector: Biotechnology | |
| MarketCap: 1440 Millions | |
| Recent Price: 5.27 Smart Investing & Trading Score: 69 | |
| Day Percent Change: 7.01% Day Change: 0.34 | |
| Week Change: 18.96% Year-to-date Change: -42.2% | |
| PRME Links: Profile News Message Board | |
| Charts:- Daily , Weekly | |
| Add PRME to Watchlist: View: Get Complete PRME Trend Analysis ➞ | |
 | SLRN Acelyrin, Inc. |
| Sector: Health Care | |
| SubSector: Biotechnology | |
| MarketCap: 2030 Millions | |
| Recent Price: 4.25 Smart Investing & Trading Score: 27 | |
| Day Percent Change: 1.92% Day Change: 0.08 | |
| Week Change: 0.24% Year-to-date Change: -42.3% | |
| SLRN Links: Profile News Message Board | |
| Charts:- Daily , Weekly | |
| Add SLRN to Watchlist: View: Get Complete SLRN Trend Analysis ➞ | |
 | XAIR Beyond Air, Inc. |
| Sector: Health Care | |
| SubSector: Medical Appliances & Equipment | |
| MarketCap: 132.48 Millions | |
| Recent Price: 1.13 Smart Investing & Trading Score: 27 | |
| Day Percent Change: 4.63% Day Change: 0.05 | |
| Week Change: -3% Year-to-date Change: -42.4% | |
| XAIR Links: Profile News Message Board | |
| Charts:- Daily , Weekly | |
| Add XAIR to Watchlist: View: Get Complete XAIR Trend Analysis ➞ | |
 | ADPT Adaptive Biotechnologies Corporation |
| Sector: Health Care | |
| SubSector: Biotechnology | |
| MarketCap: 3525.75 Millions | |
| Recent Price: 2.79 Smart Investing & Trading Score: 54 | |
| Day Percent Change: 6.49% Day Change: 0.17 | |
| Week Change: 7.31% Year-to-date Change: -43.1% | |
| ADPT Links: Profile News Message Board | |
| Charts:- Daily , Weekly | |
| Add ADPT to Watchlist: View: Get Complete ADPT Trend Analysis ➞ | |
 | ME 23andMe Holding Co. |
| Sector: Health Care | |
| SubSector: Diagnostics & Research | |
| MarketCap: 802 Millions | |
| Recent Price: 0.50 Smart Investing & Trading Score: 59 | |
| Day Percent Change: 0.30% Day Change: 0.00 | |
| Week Change: 7.99% Year-to-date Change: -43.7% | |
| ME Links: Profile News Message Board | |
| Charts:- Daily , Weekly | |
| Add ME to Watchlist: View: Get Complete ME Trend Analysis ➞ | |
 | CABA Cabaletta Bio, Inc. |
| Sector: Health Care | |
| SubSector: Biotechnology | |
| MarketCap: 222.085 Millions | |
| Recent Price: 12.41 Smart Investing & Trading Score: 42 | |
| Day Percent Change: 16.58% Day Change: 1.77 | |
| Week Change: 12.72% Year-to-date Change: -45.3% | |
| CABA Links: Profile News Message Board | |
| Charts:- Daily , Weekly | |
| Add CABA to Watchlist: View: Get Complete CABA Trend Analysis ➞ | |
 | ACAD ACADIA Pharmaceuticals Inc. |
| Sector: Health Care | |
| SubSector: Biotechnology | |
| MarketCap: 5400.35 Millions | |
| Recent Price: 17.05 Smart Investing & Trading Score: 57 | |
| Day Percent Change: 2.03% Day Change: 0.34 | |
| Week Change: 2.03% Year-to-date Change: -45.5% | |
| ACAD Links: Profile News Message Board | |
| Charts:- Daily , Weekly | |
| Add ACAD to Watchlist: View: Get Complete ACAD Trend Analysis ➞ | |
 | EDIT Editas Medicine, Inc. |
| Sector: Health Care | |
| SubSector: Biotechnology | |
| MarketCap: 1194.95 Millions | |
| Recent Price: 5.47 Smart Investing & Trading Score: 42 | |
| Day Percent Change: 4.99% Day Change: 0.26 | |
| Week Change: 2.82% Year-to-date Change: -46.0% | |
| EDIT Links: Profile News Message Board | |
| Charts:- Daily , Weekly | |
| Add EDIT to Watchlist: View: Get Complete EDIT Trend Analysis ➞ | |
 | EMBC Embecta Corp. |
| Sector: Health Care | |
| SubSector: Medical Instruments & Supplies | |
| MarketCap: 1260 Millions | |
| Recent Price: 10.13 Smart Investing & Trading Score: 25 | |
| Day Percent Change: -0.25% Day Change: -0.03 | |
| Week Change: -1.79% Year-to-date Change: -47.0% | |
| EMBC Links: Profile News Message Board | |
| Charts:- Daily , Weekly | |
| Add EMBC to Watchlist: View: Get Complete EMBC Trend Analysis ➞ | |
 | OM Outset Medical, Inc. |
| Sector: Health Care | |
| SubSector: Medical Devices | |
| MarketCap: 21787 Millions | |
| Recent Price: 2.85 Smart Investing & Trading Score: 74 | |
| Day Percent Change: 12.65% Day Change: 0.32 | |
| Week Change: 18.75% Year-to-date Change: -47.3% | |
| OM Links: Profile News Message Board | |
| Charts:- Daily , Weekly | |
| Add OM to Watchlist: View: Get Complete OM Trend Analysis ➞ | |
 | PETS PetMed Express, Inc. |
| Sector: Health Care | |
| SubSector: Drug Delivery | |
| MarketCap: 528.23 Millions | |
| Recent Price: 3.96 Smart Investing & Trading Score: 20 | |
| Day Percent Change: 0.25% Day Change: 0.01 | |
| Week Change: -1.49% Year-to-date Change: -47.6% | |
| PETS Links: Profile News Message Board | |
| Charts:- Daily , Weekly | |
| Add PETS to Watchlist: View: Get Complete PETS Trend Analysis ➞ | |
| For tabular summary view of above stock list: Summary View ➞ 0 - 25 , 25 - 50 , 50 - 75 , 75 - 100 , 100 - 125 , 125 - 150 , 150 - 175 , 175 - 200 , 200 - 225 , 225 - 250 , 250 - 275 , 275 - 300 , 300 - 325 , 325 - 350 | ||
| Click To Change The Sort Order: By Market Cap or Company Size Performance: Year-to-date, Week and Day | |
| Select Chart Type: | ||
| Too many stocks? View smallcap stocks filtered by marketcap & sector |
| Marketcap: All SmallCap Stocks (default-no microcap), Large, Mid-Range, Small & MicroCap |
| Sector: Tech, Finance, Energy, Staples, Retail, Industrial, Materials, Utilities & Medical |
|
Best Stocks Today 12Stocks.com |
© 2024 12Stocks.com Terms & Conditions Privacy Contact Us
All Information Provided Only For Education And Not To Be Used For Investing or Trading. See Terms & Conditions


One More Thing ... Get Best Stocks Delivered Daily!
Never Ever Miss A Move With Our Top Ten Stocks Lists
Find Best Stocks In Any Market - Bull or Bear Market
Take A Peek At Our Top Ten Stocks Lists: Daily, Weekly, Year-to-Date & Top Trends
Find Best Stocks In Any Market - Bull or Bear Market
Take A Peek At Our Top Ten Stocks Lists: Daily, Weekly, Year-to-Date & Top Trends
Smallcap Stocks With Best Up Trends [0-bearish to 100-bullish]: Surmodics [100], Rocky Brands[100], TransMedics Group[100], LendingClub [100], Summit [100], A10 s[100], Carpenter [100], UFP [100], PROCEPT BioRobotics[100], Xencor [100], Trinity Industries[100]
Best Smallcap Stocks Year-to-Date:
Janux [441.55%], Viking [310.69%], Longboard [259.25%], Alpine Immune[239.29%], Avidity Biosciences[185.4%], Bakkt [182.96%], Cullinan Oncology[175.33%], Arcutis Bio[173.68%], Vera [173.32%], Super Micro[159.73%], Y-mAbs [141.79%] Best Smallcap Stocks This Week:
Deciphera [73.11%], Eyenovia [45.65%], Cue Biopharma[39.56%], Seres [30.91%], Poseida [30.05%], P3 Health[29.62%], Phibro Animal[28.44%], TransMedics Group[27.72%], Surmodics [27.36%], LendingTree [26.36%], Rocky Brands[24.92%] Best Smallcap Stocks Daily:
Surmodics [29.74%], Rocky Brands[28.41%], TransMedics Group[24.93%], Ventyx Biosciences[24.63%], Eyenovia [21.84%], LendingClub [19.68%], Summit [19.59%], Powell Industries[18.89%], MiMedx Group[18.67%], CareDx [18.30%], A10 s[17.69%]