
 Login Sign Up


| |||||
 |  | ||||

| 12Stocks.com Market Intelligence |
Best SmallCap Stocks
|
| In a hurry? Small Cap Stock Lists: Performance Trends Table, Stock Charts
Sort Small Cap stocks: Daily, Weekly, Year-to-Date, Market Cap & Trends. Filter Small Cap stocks list by sector: Show all, Tech, Finance, Energy, Staples, Retail, Industrial, Materials, Utilities and HealthCare Filter Small Cap stocks list by size: All Large Medium Small and MicroCap |
| 12Stocks.com Small Cap Stocks Performances & Trends Daily | |||||||||
|
|  The overall Smart Investing & Trading Score is 23 (0-bearish to 100-bullish) which puts Small Cap index in short term bearish to neutral trend. The Smart Investing & Trading Score from previous trading session is 13 and hence an improvement of trend.
| ||||||||
Here are the Smart Investing & Trading Scores of the most requested small cap stocks at 12Stocks.com (click stock name for detailed review):
|


| 12Stocks.com: Investing in Smallcap Index with Stocks | |
|
The following table helps investors and traders sort through current performance and trends (as measured by Smart Investing & Trading Score) of various
stocks in the Smallcap Index. Quick View: Move mouse or cursor over stock symbol (ticker) to view short-term technical chart and over stock name to view long term chart. Click on  to add stock symbol to your watchlist and to add stock symbol to your watchlist and  to view watchlist. Click on any ticker or stock name for detailed market intelligence report for that stock. to view watchlist. Click on any ticker or stock name for detailed market intelligence report for that stock. |
12Stocks.com Performance of Stocks in Smallcap Index
| Ticker | Stock Name | Watchlist | Category | Recent Price | Smart Investing & Trading Score | Change % | YTD Change% |
| AGEN | Agenus |   | Health Care | 4.97 | 68 | -7.96% | 500.31% |
| CMAX | CareMax | | Health Care | 2.51 | 43 | 0.20% | 417.53% |
| JANX | Janux | | Health Care | 48.15 | 51 | 0.46% | 348.12% |
| VKTX | Viking | | Health Care | 64.67 | 41 | -2.71% | 247.50% |
| LBPH | Longboard | | Health Care | 18.01 | 15 | 6.07% | 194.76% |
| ARQT | Arcutis Bio | | Health Care | 9.45 | 36 | -7.80% | 192.57% |
| VERA | Vera | | Health Care | 40.45 | 38 | 1.10% | 161.30% |
| RNA | Avidity Biosciences | | Health Care | 23.04 | 36 | -2.19% | 154.87% |
| STOK | Stoke | | Health Care | 11.65 | 36 | -0.60% | 121.48% |
| YMAB | Y-mAbs | | Health Care | 15.00 | 56 | -0.73% | 119.94% |
| ACRV | Acrivon | | Health Care | 10.87 | 88 | 5.08% | 118.61% |
| TRVI | Trevi | | Health Care | 2.68 | 48 | 3.88% | 100.00% |
| SANA | Sana | | Health Care | 7.87 | 31 | -4.78% | 90.33% |
| CGEM | Cullinan Oncology | | Health Care | 18.98 | 100 | 6.42% | 86.22% |
| OSCR | Oscar Health | | Health Care | 16.53 | 100 | 6.37% | 81.55% |
| VTYX | Ventyx Biosciences | | Health Care | 4.45 | 53 | 1.60% | 79.80% |
| DYN | Dyne | | Health Care | 23.65 | 20 | -4.71% | 77.82% |
| GERN | Geron | | Health Care | 3.73 | 95 | 1.36% | 76.78% |
| NUVB | Nuvation Bio | | Health Care | 2.65 | 36 | -1.30% | 75.25% |
| PEPG | PepGen | | Health Care | 11.90 | 53 | 3.03% | 73.98% |
| GBIO | Generation Bio | | Health Care | 2.77 | 36 | -6.57% | 68.18% |
| MGNX | MacroGenics | | Health Care | 16.07 | 46 | -0.19% | 67.05% |
| TARS | Tarsus | | Health Care | 32.89 | 31 | -4.50% | 62.18% |
| HRTX | Heron | | Health Care | 2.71 | 38 | -2.17% | 59.41% |
| SPRY | ARS | | Health Care | 8.79 | 36 | -3.04% | 54.53% |
| For chart view version of above stock list: Chart View ➞ 0 - 25 , 25 - 50 , 50 - 75 , 75 - 100 , 100 - 125 , 125 - 150 , 150 - 175 , 175 - 200 , 200 - 225 , 225 - 250 , 250 - 275 , 275 - 300 , 300 - 325 , 325 - 350 | ||
 | Click To Change The Sort Order: By Market Cap or Company Size Performance: Year-to-date, Week and Day |  |
| Too many stocks? View smallcap stocks filtered by marketcap & sector |
| Marketcap: All SmallCap Stocks (default-no microcap), Large, Mid-Range, Small |
| Smallcap Sector: Tech, Finance, Energy, Staples, Retail, Industrial, Materials, & Medical |
|
Get the most comprehensive stock market coverage daily at 12Stocks.com ➞ Best Stocks Today ➞ Best Stocks Weekly ➞ Best Stocks Year-to-Date ➞ Best Stocks Trends ➞  Best Stocks Today 12Stocks.com Best Nasdaq Stocks ➞ Best S&P 500 Stocks ➞ Best Tech Stocks ➞ Best Biotech Stocks ➞ |
| Detailed Overview of SmallCap Stocks |
| SmallCap Technical Overview, Leaders & Laggards, Top SmallCap ETF Funds & Detailed SmallCap Stocks List, Charts, Trends & More |
| Smallcap: Technical Analysis, Trends & YTD Performance | |
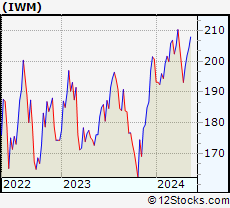
| SmallCap segment as represented by
IWM, an exchange-traded fund [ETF], holds basket of thousands of smallcap stocks from across all major sectors of the US stock market. The smallcap index (contains stocks like Riverbed & Sotheby's) is down by -3.92% and is currently underperforming the overall market by -8.11% year-to-date. Below is a quick view of technical charts and trends: | |
 IWM Weekly Chart |
|
| Long Term Trend: Not Good | |
| Medium Term Trend: Not Good | |
 IWM Daily Chart |
|
| Short Term Trend: Not Good | |
| Overall Trend Score: 23 | |
| YTD Performance: -3.92% | |
| **Trend Scores & Views Are Only For Educational Purposes And Not For Investing | |
| 12Stocks.com: Top Performing Small Cap Index Stocks | ||||||||||||||||||||||||||||||||||||||||||||||||
 The top performing Small Cap Index stocks year to date are
Now, more recently, over last week, the top performing Small Cap Index stocks on the move are


|
||||||||||||||||||||||||||||||||||||||||||||||||
| 12Stocks.com: Investing in Smallcap Index using Exchange Traded Funds | |
|
The following table shows list of key exchange traded funds (ETF) that
help investors track Smallcap index. The following list also includes leveraged ETF funds that track twice or thrice the daily returns of Smallcap indices. Short or inverse ETF funds move in the opposite direction to the index they track and are useful during market pullbacks or during bear markets. Quick View: Move mouse or cursor over ETF symbol (ticker) to view short-term technical chart and over ETF name to view long term chart. Click on ticker or stock name for detailed view. Click on to add stock symbol to your watchlist and to view watchlist. |
12Stocks.com List of ETFs that track Smallcap Index
| Ticker | ETF Name | Watchlist | Recent Price | Smart Investing & Trading Score | Change % | Week % | Year-to-date % |
| IWM | iShares Russell 2000 | | 192.84 | 23 | -0.08 | -2.94 | -3.92% |
| IJR | iShares Core S&P Small-Cap | | 102.34 | 10 | 0.21 | -2.08 | -5.46% |
| VTWO | Vanguard Russell 2000 ETF | | 77.95 | 23 | -0.13 | -2.95 | -3.88% |
| IWN | iShares Russell 2000 Value | | 146.33 | 10 | 0.21 | -2.69 | -5.79% |
| IJS | iShares S&P Small-Cap 600 Value | | 94.51 | 18 | 0.41 | -1.73 | -8.31% |
| IWO | iShares Russell 2000 Growth | | 246.94 | 36 | -0.44 | -3.3 | -2.09% |
| IJT | iShares S&P Small-Cap 600 Growth | | 121.57 | 13 | -0.22 | -2.57 | -2.85% |
| XSLV | PowerShares S&P SmallCap Low Volatil ETF | | 41.65 | 25 | 0.56 | -1.05 | -5.66% |
| SAA | ProShares Ultra SmallCap600 | | 21.62 | 10 | -0.18 | -4.17 | -13.35% |
| SMLV | SPDR SSGA US Small Cap Low Volatil ETF | | 103.83 | 10 | 0.16 | -1.13 | -7.72% |
| SBB | ProShares Short SmallCap600 | | 16.98 | 100 | 0.77 | 2.62 | 6.59% |
| SDD | ProShares UltraShort SmallCap600 | | 20.69 | 95 | 0.44 | 4.33 | 12.28% |
| 12Stocks.com: Charts, Trends, Fundamental Data and Performances of SmallCap Stocks | |
|
We now take in-depth look at all SmallCap stocks including charts, multi-period performances and overall trends (as measured by Smart Investing & Trading Score). One can sort SmallCap stocks (click link to choose) by Daily, Weekly and by Year-to-Date performances. Also, one can sort by size of the company or by market capitalization. |
| Select Your Default Chart Type: | |||||
| |||||
| Click on stock symbol or name for detailed view. Click on to add stock symbol to your watchlist and to view watchlist. Quick View: Move mouse or cursor over "Daily" to quickly view daily technical stock chart and over "Weekly" to view weekly technical stock chart. | |||||

 | AGEN Agenus Inc. |
| Sector: Health Care | |
| SubSector: Biotechnology | |
| MarketCap: 274.885 Millions | |
| Recent Price: 4.97 Smart Investing & Trading Score: 68 | |
| Day Percent Change: -7.96% Day Change: -0.43 | |
| Week Change: -39.02% Year-to-date Change: 500.3% | |
| AGEN Links: Profile News Message Board | |
| Charts:- Daily , Weekly | |
| Add AGEN to Watchlist: View: Get Complete AGEN Trend Analysis ➞ | |
 | CMAX CareMax, Inc. |
| Sector: Health Care | |
| SubSector: Health Information Services | |
| MarketCap: 371 Millions | |
| Recent Price: 2.51 Smart Investing & Trading Score: 43 | |
| Day Percent Change: 0.20% Day Change: 0.00 | |
| Week Change: -21.81% Year-to-date Change: 417.5% | |
| CMAX Links: Profile News Message Board | |
| Charts:- Daily , Weekly | |
| Add CMAX to Watchlist: View: Get Complete CMAX Trend Analysis ➞ | |
 | JANX Janux Therapeutics, Inc. |
| Sector: Health Care | |
| SubSector: Biotechnology | |
| MarketCap: 496 Millions | |
| Recent Price: 48.15 Smart Investing & Trading Score: 51 | |
| Day Percent Change: 0.46% Day Change: 0.22 | |
| Week Change: -8.55% Year-to-date Change: 348.1% | |
| JANX Links: Profile News Message Board | |
| Charts:- Daily , Weekly | |
| Add JANX to Watchlist: View: Get Complete JANX Trend Analysis ➞ | |
 | VKTX Viking Therapeutics, Inc. |
| Sector: Health Care | |
| SubSector: Biotechnology | |
| MarketCap: 388.585 Millions | |
| Recent Price: 64.67 Smart Investing & Trading Score: 41 | |
| Day Percent Change: -2.71% Day Change: -1.80 | |
| Week Change: -5.76% Year-to-date Change: 247.5% | |
| VKTX Links: Profile News Message Board | |
| Charts:- Daily , Weekly | |
| Add VKTX to Watchlist: View: Get Complete VKTX Trend Analysis ➞ | |
 | LBPH Longboard Pharmaceuticals, Inc. |
| Sector: Health Care | |
| SubSector: Biotechnology | |
| MarketCap: 169 Millions | |
| Recent Price: 18.01 Smart Investing & Trading Score: 15 | |
| Day Percent Change: 6.07% Day Change: 1.03 | |
| Week Change: -6.2% Year-to-date Change: 194.8% | |
| LBPH Links: Profile News Message Board | |
| Charts:- Daily , Weekly | |
| Add LBPH to Watchlist: View: Get Complete LBPH Trend Analysis ➞ | |
 | ARQT Arcutis Biotherapeutics, Inc. |
| Sector: Health Care | |
| SubSector: Biotechnology | |
| MarketCap: 12787 Millions | |
| Recent Price: 9.45 Smart Investing & Trading Score: 36 | |
| Day Percent Change: -7.80% Day Change: -0.80 | |
| Week Change: -7.35% Year-to-date Change: 192.6% | |
| ARQT Links: Profile News Message Board | |
| Charts:- Daily , Weekly | |
| Add ARQT to Watchlist: View: Get Complete ARQT Trend Analysis ➞ | |
 | VERA Vera Therapeutics, Inc. |
| Sector: Health Care | |
| SubSector: Biotechnology | |
| MarketCap: 746 Millions | |
| Recent Price: 40.45 Smart Investing & Trading Score: 38 | |
| Day Percent Change: 1.10% Day Change: 0.44 | |
| Week Change: -15.68% Year-to-date Change: 161.3% | |
| VERA Links: Profile News Message Board | |
| Charts:- Daily , Weekly | |
| Add VERA to Watchlist: View: Get Complete VERA Trend Analysis ➞ | |
 | RNA Avidity Biosciences, Inc. |
| Sector: Health Care | |
| SubSector: Biotechnology | |
| MarketCap: 12287 Millions | |
| Recent Price: 23.04 Smart Investing & Trading Score: 36 | |
| Day Percent Change: -2.19% Day Change: -0.52 | |
| Week Change: -4.36% Year-to-date Change: 154.9% | |
| RNA Links: Profile News Message Board | |
| Charts:- Daily , Weekly | |
| Add RNA to Watchlist: View: Get Complete RNA Trend Analysis ➞ | |
 | STOK Stoke Therapeutics, Inc. |
| Sector: Health Care | |
| SubSector: Biotechnology | |
| MarketCap: 772.485 Millions | |
| Recent Price: 11.65 Smart Investing & Trading Score: 36 | |
| Day Percent Change: -0.60% Day Change: -0.07 | |
| Week Change: -8.77% Year-to-date Change: 121.5% | |
| STOK Links: Profile News Message Board | |
| Charts:- Daily , Weekly | |
| Add STOK to Watchlist: View: Get Complete STOK Trend Analysis ➞ | |
 | YMAB Y-mAbs Therapeutics, Inc. |
| Sector: Health Care | |
| SubSector: Biotechnology | |
| MarketCap: 899.585 Millions | |
| Recent Price: 15.00 Smart Investing & Trading Score: 56 | |
| Day Percent Change: -0.73% Day Change: -0.11 | |
| Week Change: 4.38% Year-to-date Change: 119.9% | |
| YMAB Links: Profile News Message Board | |
| Charts:- Daily , Weekly | |
| Add YMAB to Watchlist: View: Get Complete YMAB Trend Analysis ➞ | |
 | ACRV Acrivon Therapeutics, Inc. |
| Sector: Health Care | |
| SubSector: Biotechnology | |
| MarketCap: 286 Millions | |
| Recent Price: 10.87 Smart Investing & Trading Score: 88 | |
| Day Percent Change: 5.08% Day Change: 0.53 | |
| Week Change: 8.76% Year-to-date Change: 118.6% | |
| ACRV Links: Profile News Message Board | |
| Charts:- Daily , Weekly | |
| Add ACRV to Watchlist: View: Get Complete ACRV Trend Analysis ➞ | |
 | TRVI Trevi Therapeutics, Inc. |
| Sector: Health Care | |
| SubSector: Biotechnology | |
| MarketCap: 50.6785 Millions | |
| Recent Price: 2.68 Smart Investing & Trading Score: 48 | |
| Day Percent Change: 3.88% Day Change: 0.10 | |
| Week Change: -8.22% Year-to-date Change: 100.0% | |
| TRVI Links: Profile News Message Board | |
| Charts:- Daily , Weekly | |
| Add TRVI to Watchlist: View: Get Complete TRVI Trend Analysis ➞ | |
 | SANA Sana Biotechnology, Inc. |
| Sector: Health Care | |
| SubSector: Biotechnology | |
| MarketCap: 1210 Millions | |
| Recent Price: 7.87 Smart Investing & Trading Score: 31 | |
| Day Percent Change: -4.78% Day Change: -0.40 | |
| Week Change: -12.17% Year-to-date Change: 90.3% | |
| SANA Links: Profile News Message Board | |
| Charts:- Daily , Weekly | |
| Add SANA to Watchlist: View: Get Complete SANA Trend Analysis ➞ | |
 | CGEM Cullinan Oncology, Inc. |
| Sector: Health Care | |
| SubSector: Biotechnology | |
| MarketCap: 433 Millions | |
| Recent Price: 18.98 Smart Investing & Trading Score: 100 | |
| Day Percent Change: 6.42% Day Change: 1.14 | |
| Week Change: 13.89% Year-to-date Change: 86.2% | |
| CGEM Links: Profile News Message Board | |
| Charts:- Daily , Weekly | |
| Add CGEM to Watchlist: View: Get Complete CGEM Trend Analysis ➞ | |
 | OSCR Oscar Health, Inc. |
| Sector: Health Care | |
| SubSector: Healthcare Plans | |
| MarketCap: 1790 Millions | |
| Recent Price: 16.53 Smart Investing & Trading Score: 100 | |
| Day Percent Change: 6.37% Day Change: 0.99 | |
| Week Change: 12.14% Year-to-date Change: 81.6% | |
| OSCR Links: Profile News Message Board | |
| Charts:- Daily , Weekly | |
| Add OSCR to Watchlist: View: Get Complete OSCR Trend Analysis ➞ | |
 | VTYX Ventyx Biosciences, Inc. |
| Sector: Health Care | |
| SubSector: Biotechnology | |
| MarketCap: 1950 Millions | |
| Recent Price: 4.45 Smart Investing & Trading Score: 53 | |
| Day Percent Change: 1.60% Day Change: 0.07 | |
| Week Change: -3.26% Year-to-date Change: 79.8% | |
| VTYX Links: Profile News Message Board | |
| Charts:- Daily , Weekly | |
| Add VTYX to Watchlist: View: Get Complete VTYX Trend Analysis ➞ | |
 | DYN Dyne Therapeutics, Inc. |
| Sector: Health Care | |
| SubSector: Biotechnology | |
| MarketCap: 88487 Millions | |
| Recent Price: 23.65 Smart Investing & Trading Score: 20 | |
| Day Percent Change: -4.71% Day Change: -1.17 | |
| Week Change: -8.51% Year-to-date Change: 77.8% | |
| DYN Links: Profile News Message Board | |
| Charts:- Daily , Weekly | |
| Add DYN to Watchlist: View: Get Complete DYN Trend Analysis ➞ | |
 | GERN Geron Corporation |
| Sector: Health Care | |
| SubSector: Biotechnology | |
| MarketCap: 228.685 Millions | |
| Recent Price: 3.73 Smart Investing & Trading Score: 95 | |
| Day Percent Change: 1.36% Day Change: 0.05 | |
| Week Change: -1.06% Year-to-date Change: 76.8% | |
| GERN Links: Profile News Message Board | |
| Charts:- Daily , Weekly | |
| Add GERN to Watchlist: View: Get Complete GERN Trend Analysis ➞ | |
 | NUVB Nuvation Bio Inc. |
| Sector: Health Care | |
| SubSector: Biotechnology | |
| MarketCap: 381 Millions | |
| Recent Price: 2.65 Smart Investing & Trading Score: 36 | |
| Day Percent Change: -1.30% Day Change: -0.04 | |
| Week Change: -10.61% Year-to-date Change: 75.3% | |
| NUVB Links: Profile News Message Board | |
| Charts:- Daily , Weekly | |
| Add NUVB to Watchlist: View: Get Complete NUVB Trend Analysis ➞ | |
 | PEPG PepGen Inc. |
| Sector: Health Care | |
| SubSector: Biotechnology | |
| MarketCap: 216 Millions | |
| Recent Price: 11.90 Smart Investing & Trading Score: 53 | |
| Day Percent Change: 3.03% Day Change: 0.35 | |
| Week Change: -8.46% Year-to-date Change: 74.0% | |
| PEPG Links: Profile News Message Board | |
| Charts:- Daily , Weekly | |
| Add PEPG to Watchlist: View: Get Complete PEPG Trend Analysis ➞ | |
 | GBIO Generation Bio Co. |
| Sector: Health Care | |
| SubSector: Biotechnology | |
| MarketCap: 17487 Millions | |
| Recent Price: 2.77 Smart Investing & Trading Score: 36 | |
| Day Percent Change: -6.57% Day Change: -0.20 | |
| Week Change: -30.63% Year-to-date Change: 68.2% | |
| GBIO Links: Profile News Message Board | |
| Charts:- Daily , Weekly | |
| Add GBIO to Watchlist: View: Get Complete GBIO Trend Analysis ➞ | |
 | MGNX MacroGenics, Inc. |
| Sector: Health Care | |
| SubSector: Biotechnology | |
| MarketCap: 262.785 Millions | |
| Recent Price: 16.07 Smart Investing & Trading Score: 46 | |
| Day Percent Change: -0.19% Day Change: -0.03 | |
| Week Change: -8.38% Year-to-date Change: 67.1% | |
| MGNX Links: Profile News Message Board | |
| Charts:- Daily , Weekly | |
| Add MGNX to Watchlist: View: Get Complete MGNX Trend Analysis ➞ | |
 | TARS Tarsus Pharmaceuticals, Inc. |
| Sector: Health Care | |
| SubSector: Biotechnology | |
| MarketCap: 74487 Millions | |
| Recent Price: 32.89 Smart Investing & Trading Score: 31 | |
| Day Percent Change: -4.50% Day Change: -1.55 | |
| Week Change: -9.07% Year-to-date Change: 62.2% | |
| TARS Links: Profile News Message Board | |
| Charts:- Daily , Weekly | |
| Add TARS to Watchlist: View: Get Complete TARS Trend Analysis ➞ | |
 | HRTX Heron Therapeutics, Inc. |
| Sector: Health Care | |
| SubSector: Biotechnology | |
| MarketCap: 1172.75 Millions | |
| Recent Price: 2.71 Smart Investing & Trading Score: 38 | |
| Day Percent Change: -2.17% Day Change: -0.06 | |
| Week Change: -6.87% Year-to-date Change: 59.4% | |
| HRTX Links: Profile News Message Board | |
| Charts:- Daily , Weekly | |
| Add HRTX to Watchlist: View: Get Complete HRTX Trend Analysis ➞ | |
 | SPRY ARS Pharmaceuticals, Inc. |
| Sector: Health Care | |
| SubSector: Biotechnology | |
| MarketCap: 632 Millions | |
| Recent Price: 8.79 Smart Investing & Trading Score: 36 | |
| Day Percent Change: -3.04% Day Change: -0.28 | |
| Week Change: -2.61% Year-to-date Change: 54.5% | |
| SPRY Links: Profile News Message Board | |
| Charts:- Daily , Weekly | |
| Add SPRY to Watchlist: View: Get Complete SPRY Trend Analysis ➞ | |
| For tabular summary view of above stock list: Summary View ➞ 0 - 25 , 25 - 50 , 50 - 75 , 75 - 100 , 100 - 125 , 125 - 150 , 150 - 175 , 175 - 200 , 200 - 225 , 225 - 250 , 250 - 275 , 275 - 300 , 300 - 325 , 325 - 350 | ||
| Click To Change The Sort Order: By Market Cap or Company Size Performance: Year-to-date, Week and Day | |
| Select Chart Type: | ||
| Too many stocks? View smallcap stocks filtered by marketcap & sector |
| Marketcap: All SmallCap Stocks (default-no microcap), Large, Mid-Range, Small & MicroCap |
| Sector: Tech, Finance, Energy, Staples, Retail, Industrial, Materials, Utilities & Medical |
|
Best Stocks Today 12Stocks.com |
© 2024 12Stocks.com Terms & Conditions Privacy Contact Us
All Information Provided Only For Education And Not To Be Used For Investing or Trading. See Terms & Conditions


One More Thing ... Get Best Stocks Delivered Daily!
Never Ever Miss A Move With Our Top Ten Stocks Lists
Find Best Stocks In Any Market - Bull or Bear Market
Take A Peek At Our Top Ten Stocks Lists: Daily, Weekly, Year-to-Date & Top Trends
Find Best Stocks In Any Market - Bull or Bear Market
Take A Peek At Our Top Ten Stocks Lists: Daily, Weekly, Year-to-Date & Top Trends
Smallcap Stocks With Best Up Trends [0-bearish to 100-bullish]: Badger Meter[100], Cullinan Oncology[100], Oscar Health[100], NextNav [100], EchoStar [100], Victory Capital[100], Macatawa Bank[100], IMAX [100], Envestnet [100], ALX Oncology[100], Argan [95]
Best Smallcap Stocks Year-to-Date:
Agenus [500.31%], CareMax [417.53%], Janux [348.12%], Viking [247.5%], Alpine Immune[238.5%], Super Micro[226.63%], Longboard [194.76%], Arcutis Bio[192.57%], Vera [161.3%], Avidity Biosciences[154.87%], Hippo [128.32%] Best Smallcap Stocks This Week:
Macatawa Bank[44.42%], 23andMe Holding[33.3%], ProKidney [32%], Snap One[29.73%], Vertex Energy[25.96%], ALX Oncology[20.64%], Vanda [20.63%], Expensify [18.37%], Badger Meter[16.72%], ContextLogic [15%], Cullinan Oncology[13.89%] Best Smallcap Stocks Daily:
23andMe Holding[65.91%], Vertex Energy[33.78%], Zura Bio[17.20%], Badger Meter[16.65%], ContextLogic [15.81%], Expensify [15.23%], Montrose Environmental[12.84%], Vaxxinity [10.05%], Cipher Mining[8.65%], FiscalNote [8.61%], Vuzix [8.15%]