
 Login Sign Up


| |||||
 |  | ||||

| 12Stocks.com Market Intelligence |
Best SmallCap Stocks
|
| In a hurry? Small Cap Stock Lists: Performance Trends Table, Stock Charts
Sort Small Cap stocks: Daily, Weekly, Year-to-Date, Market Cap & Trends. Filter Small Cap stocks list by sector: Show all, Tech, Finance, Energy, Staples, Retail, Industrial, Materials, Utilities and HealthCare Filter Small Cap stocks list by size: All Large Medium Small and MicroCap |
| 12Stocks.com Small Cap Stocks Performances & Trends Daily | |||||||||
|
|  The overall Smart Investing & Trading Score is 14 (0-bearish to 100-bullish) which puts Small Cap index in short term bearish trend. The Smart Investing & Trading Score from previous trading session is 41 and hence a deterioration of trend.
| ||||||||
Here are the Smart Investing & Trading Scores of the most requested small cap stocks at 12Stocks.com (click stock name for detailed review):
|


| 12Stocks.com: Investing in Smallcap Index with Stocks | |
|
The following table helps investors and traders sort through current performance and trends (as measured by Smart Investing & Trading Score) of various
stocks in the Smallcap Index. Quick View: Move mouse or cursor over stock symbol (ticker) to view short-term technical chart and over stock name to view long term chart. Click on  to add stock symbol to your watchlist and to add stock symbol to your watchlist and  to view watchlist. Click on any ticker or stock name for detailed market intelligence report for that stock. to view watchlist. Click on any ticker or stock name for detailed market intelligence report for that stock. |
12Stocks.com Performance of Stocks in Smallcap Index
| Ticker | Stock Name | Watchlist | Category | Recent Price | Smart Investing & Trading Score | Change % | YTD Change% |
| AKRO | Akero |   | Health Care | 20.08 | 42 | 0.96% | -14.00% |
| ATEC | Alphatec | | Health Care | 12.97 | 49 | 2.77% | -14.16% |
| PRLD | Prelude | | Health Care | 3.73 | 15 | -1.06% | -14.25% |
| PETQ | PetIQ | | Health Care | 16.87 | 64 | 3.37% | -14.58% |
| ASRT | Assertio | | Health Care | 0.92 | 83 | 4.08% | -14.70% |
| TMCI | Treace Medical | | Health Care | 10.85 | 42 | 4.63% | -14.87% |
| RXRX | Recursion | | Health Care | 8.33 | 49 | 6.66% | -14.91% |
| USNA | USANA Health | | Health Care | 45.55 | 74 | 9.71% | -15.02% |
| WRBY | Warby Parker | | Health Care | 11.98 | 5 | 2.04% | -15.07% |
| ZYME | Zymeworks | | Health Care | 8.76 | 49 | 2.10% | -15.69% |
| OPK | OPKO Health | | Health Care | 1.27 | 88 | 4.10% | -15.89% |
| AVAH | Aveanna Healthcare | | Health Care | 2.26 | 42 | 0.44% | -16.14% |
| AVNS | Avanos Medical | | Health Care | 18.79 | 100 | 3.93% | -16.23% |
| NAUT | Nautilus | | Health Care | 2.75 | 90 | 8.27% | -16.41% |
| DVAX | Dynavax | | Health Care | 11.68 | 42 | 2.73% | -16.45% |
| MDXG | MiMedx Group | | Health Care | 7.31 | 29 | 18.67% | -16.65% |
| INSM | Insmed | | Health Care | 25.59 | 49 | 3.52% | -17.42% |
| PSTX | Poseida | | Health Care | 2.77 | 64 | 14.46% | -17.68% |
| HLVX | HilleVax | | Health Care | 13.53 | 49 | 2.58% | -17.88% |
| OMGA | Omega | | Health Care | 2.47 | 49 | 10.76% | -17.94% |
| LFST | LifeStance Health | | Health Care | 6.44 | 64 | 4.38% | -18.64% |
| RCUS | Arcus Biosciences | | Health Care | 15.50 | 42 | 1.77% | -18.85% |
| FENC | Fennec | | Health Care | 9.09 | 10 | -0.98% | -18.98% |
| AKYA | Akoya Biosciences | | Health Care | 3.96 | 59 | 3.66% | -19.02% |
| VREX | Varex Imaging | | Health Care | 16.58 | 10 | 2.03% | -19.12% |
| For chart view version of above stock list: Chart View ➞ 0 - 25 , 25 - 50 , 50 - 75 , 75 - 100 , 100 - 125 , 125 - 150 , 150 - 175 , 175 - 200 , 200 - 225 , 225 - 250 , 250 - 275 , 275 - 300 , 300 - 325 , 325 - 350 | ||
 | Click To Change The Sort Order: By Market Cap or Company Size Performance: Year-to-date, Week and Day |  |
| Too many stocks? View smallcap stocks filtered by marketcap & sector |
| Marketcap: All SmallCap Stocks (default-no microcap), Large, Mid-Range, Small |
| Smallcap Sector: Tech, Finance, Energy, Staples, Retail, Industrial, Materials, & Medical |
|
Get the most comprehensive stock market coverage daily at 12Stocks.com ➞ Best Stocks Today ➞ Best Stocks Weekly ➞ Best Stocks Year-to-Date ➞ Best Stocks Trends ➞  Best Stocks Today 12Stocks.com Best Nasdaq Stocks ➞ Best S&P 500 Stocks ➞ Best Tech Stocks ➞ Best Biotech Stocks ➞ |
| Detailed Overview of SmallCap Stocks |
| SmallCap Technical Overview, Leaders & Laggards, Top SmallCap ETF Funds & Detailed SmallCap Stocks List, Charts, Trends & More |
| Smallcap: Technical Analysis, Trends & YTD Performance | |
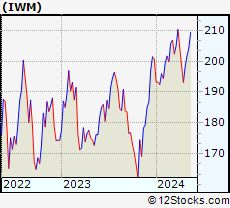
| SmallCap segment as represented by
IWM, an exchange-traded fund [ETF], holds basket of thousands of smallcap stocks from across all major sectors of the US stock market. The smallcap index (contains stocks like Riverbed & Sotheby's) is down by -2.19% and is currently underperforming the overall market by -6.73% year-to-date. Below is a quick view of technical charts and trends: | |
 IWM Weekly Chart |
|
| Long Term Trend: Not Good | |
| Medium Term Trend: Not Good | |
 IWM Daily Chart |
|
| Short Term Trend: Not Good | |
| Overall Trend Score: 14 | |
| YTD Performance: -2.19% | |
| **Trend Scores & Views Are Only For Educational Purposes And Not For Investing | |
| 12Stocks.com: Top Performing Small Cap Index Stocks | ||||||||||||||||||||||||||||||||||||||||||||||||
 The top performing Small Cap Index stocks year to date are
Now, more recently, over last week, the top performing Small Cap Index stocks on the move are


|
||||||||||||||||||||||||||||||||||||||||||||||||
| 12Stocks.com: Investing in Smallcap Index using Exchange Traded Funds | |
|
The following table shows list of key exchange traded funds (ETF) that
help investors track Smallcap index. The following list also includes leveraged ETF funds that track twice or thrice the daily returns of Smallcap indices. Short or inverse ETF funds move in the opposite direction to the index they track and are useful during market pullbacks or during bear markets. Quick View: Move mouse or cursor over ETF symbol (ticker) to view short-term technical chart and over ETF name to view long term chart. Click on ticker or stock name for detailed view. Click on to add stock symbol to your watchlist and to view watchlist. |
12Stocks.com List of ETFs that track Smallcap Index
| Ticker | ETF Name | Watchlist | Recent Price | Smart Investing & Trading Score | Change % | Week % | Year-to-date % |
| IWM | iShares Russell 2000 | | 196.31 | 14 | 0.21 | -1.05 | -2.19% |
| IJR | iShares Core S&P Small-Cap | | 104.74 | 22 | 0.34 | -0.86 | -3.24% |
| VTWO | Vanguard Russell 2000 ETF | | 79.36 | 14 | 0.25 | -1.07 | -2.15% |
| IWN | iShares Russell 2000 Value | | 149.82 | 22 | 0.52 | -0.87 | -3.55% |
| IJS | iShares S&P Small-Cap 600 Value | | 96.40 | 15 | 0.33 | -0.81 | -6.47% |
| IWO | iShares Russell 2000 Growth | | 249.58 | 7 | -0.30 | -1.39 | -1.05% |
| IJT | iShares S&P Small-Cap 600 Growth | | 124.94 | 15 | 0.27 | -0.91 | -0.16% |
| XSLV | PowerShares S&P SmallCap Low Volatil ETF | | 42.83 | 62 | 0.68 | 0.26 | -2.99% |
| SDD | ProShares UltraShort SmallCap600 | | 19.71 | 86 | 0.70 | 1.85 | 6.95% |
| SMLV | SPDR SSGA US Small Cap Low Volatil ETF | | 107.44 | 45 | 1.11 | -0.07 | -4.51% |
| SBB | ProShares Short SmallCap600 | | 16.56 | 79 | 0.05 | 1.06 | 3.94% |
| SAA | ProShares Ultra SmallCap600 | | 22.58 | 8 | -0.08 | -1.99 | -9.49% |
| 12Stocks.com: Charts, Trends, Fundamental Data and Performances of SmallCap Stocks | |
|
We now take in-depth look at all SmallCap stocks including charts, multi-period performances and overall trends (as measured by Smart Investing & Trading Score). One can sort SmallCap stocks (click link to choose) by Daily, Weekly and by Year-to-Date performances. Also, one can sort by size of the company or by market capitalization. |
| Select Your Default Chart Type: | |||||
| |||||
| Click on stock symbol or name for detailed view. Click on to add stock symbol to your watchlist and to view watchlist. Quick View: Move mouse or cursor over "Daily" to quickly view daily technical stock chart and over "Weekly" to view weekly technical stock chart. | |||||

 | AKRO Akero Therapeutics, Inc. |
| Sector: Health Care | |
| SubSector: Biotechnology | |
| MarketCap: 675.085 Millions | |
| Recent Price: 20.08 Smart Investing & Trading Score: 42 | |
| Day Percent Change: 0.96% Day Change: 0.19 | |
| Week Change: 1.72% Year-to-date Change: -14.0% | |
| AKRO Links: Profile News Message Board | |
| Charts:- Daily , Weekly | |
| Add AKRO to Watchlist: View: Get Complete AKRO Trend Analysis ➞ | |
 | ATEC Alphatec Holdings, Inc. |
| Sector: Health Care | |
| SubSector: Medical Instruments & Supplies | |
| MarketCap: 181.16 Millions | |
| Recent Price: 12.97 Smart Investing & Trading Score: 49 | |
| Day Percent Change: 2.77% Day Change: 0.35 | |
| Week Change: 4.26% Year-to-date Change: -14.2% | |
| ATEC Links: Profile News Message Board | |
| Charts:- Daily , Weekly | |
| Add ATEC to Watchlist: View: Get Complete ATEC Trend Analysis ➞ | |
 | PRLD Prelude Therapeutics Incorporated |
| Sector: Health Care | |
| SubSector: Biotechnology | |
| MarketCap: 26087 Millions | |
| Recent Price: 3.73 Smart Investing & Trading Score: 15 | |
| Day Percent Change: -1.06% Day Change: -0.04 | |
| Week Change: -8.35% Year-to-date Change: -14.3% | |
| PRLD Links: Profile News Message Board | |
| Charts:- Daily , Weekly | |
| Add PRLD to Watchlist: View: Get Complete PRLD Trend Analysis ➞ | |
 | PETQ PetIQ, Inc. |
| Sector: Health Care | |
| SubSector: Drugs - Generic | |
| MarketCap: 587.585 Millions | |
| Recent Price: 16.87 Smart Investing & Trading Score: 64 | |
| Day Percent Change: 3.37% Day Change: 0.55 | |
| Week Change: 2.06% Year-to-date Change: -14.6% | |
| PETQ Links: Profile News Message Board | |
| Charts:- Daily , Weekly | |
| Add PETQ to Watchlist: View: Get Complete PETQ Trend Analysis ➞ | |
 | ASRT Assertio Therapeutics, Inc. |
| Sector: Health Care | |
| SubSector: Drugs - Generic | |
| MarketCap: 65.8185 Millions | |
| Recent Price: 0.92 Smart Investing & Trading Score: 83 | |
| Day Percent Change: 4.08% Day Change: 0.04 | |
| Week Change: 11.23% Year-to-date Change: -14.7% | |
| ASRT Links: Profile News Message Board | |
| Charts:- Daily , Weekly | |
| Add ASRT to Watchlist: View: Get Complete ASRT Trend Analysis ➞ | |
 | TMCI Treace Medical Concepts, Inc. |
| Sector: Health Care | |
| SubSector: Medical Devices | |
| MarketCap: 1550 Millions | |
| Recent Price: 10.85 Smart Investing & Trading Score: 42 | |
| Day Percent Change: 4.63% Day Change: 0.48 | |
| Week Change: 4.38% Year-to-date Change: -14.9% | |
| TMCI Links: Profile News Message Board | |
| Charts:- Daily , Weekly | |
| Add TMCI to Watchlist: View: Get Complete TMCI Trend Analysis ➞ | |
 | RXRX Recursion Pharmaceuticals, Inc. |
| Sector: Health Care | |
| SubSector: Biotechnology | |
| MarketCap: 1470 Millions | |
| Recent Price: 8.33 Smart Investing & Trading Score: 49 | |
| Day Percent Change: 6.66% Day Change: 0.52 | |
| Week Change: 2.65% Year-to-date Change: -14.9% | |
| RXRX Links: Profile News Message Board | |
| Charts:- Daily , Weekly | |
| Add RXRX to Watchlist: View: Get Complete RXRX Trend Analysis ➞ | |
 | USNA USANA Health Sciences, Inc. |
| Sector: Health Care | |
| SubSector: Drug Related Products | |
| MarketCap: 1185.13 Millions | |
| Recent Price: 45.55 Smart Investing & Trading Score: 74 | |
| Day Percent Change: 9.71% Day Change: 4.03 | |
| Week Change: 4.78% Year-to-date Change: -15.0% | |
| USNA Links: Profile News Message Board | |
| Charts:- Daily , Weekly | |
| Add USNA to Watchlist: View: Get Complete USNA Trend Analysis ➞ | |
 | WRBY Warby Parker Inc. |
| Sector: Health Care | |
| SubSector: Medical Instruments & Supplies | |
| MarketCap: 1380 Millions | |
| Recent Price: 11.98 Smart Investing & Trading Score: 5 | |
| Day Percent Change: 2.04% Day Change: 0.24 | |
| Week Change: -7.28% Year-to-date Change: -15.1% | |
| WRBY Links: Profile News Message Board | |
| Charts:- Daily , Weekly | |
| Add WRBY to Watchlist: View: Get Complete WRBY Trend Analysis ➞ | |
 | ZYME Zymeworks Inc. |
| Sector: Health Care | |
| SubSector: Biotechnology | |
| MarketCap: 1373.55 Millions | |
| Recent Price: 8.76 Smart Investing & Trading Score: 49 | |
| Day Percent Change: 2.10% Day Change: 0.18 | |
| Week Change: 6.05% Year-to-date Change: -15.7% | |
| ZYME Links: Profile News Message Board | |
| Charts:- Daily , Weekly | |
| Add ZYME to Watchlist: View: Get Complete ZYME Trend Analysis ➞ | |
 | OPK OPKO Health, Inc. |
| Sector: Health Care | |
| SubSector: Biotechnology | |
| MarketCap: 1116.05 Millions | |
| Recent Price: 1.27 Smart Investing & Trading Score: 88 | |
| Day Percent Change: 4.10% Day Change: 0.05 | |
| Week Change: 0.79% Year-to-date Change: -15.9% | |
| OPK Links: Profile News Message Board | |
| Charts:- Daily , Weekly | |
| Add OPK to Watchlist: View: Get Complete OPK Trend Analysis ➞ | |
 | AVAH Aveanna Healthcare Holdings Inc. |
| Sector: Health Care | |
| SubSector: Medical Care Facilities | |
| MarketCap: 305 Millions | |
| Recent Price: 2.26 Smart Investing & Trading Score: 42 | |
| Day Percent Change: 0.44% Day Change: 0.01 | |
| Week Change: 2.73% Year-to-date Change: -16.1% | |
| AVAH Links: Profile News Message Board | |
| Charts:- Daily , Weekly | |
| Add AVAH to Watchlist: View: Get Complete AVAH Trend Analysis ➞ | |
 | AVNS Avanos Medical, Inc. |
| Sector: Health Care | |
| SubSector: Medical Instruments & Supplies | |
| MarketCap: 1229.6 Millions | |
| Recent Price: 18.79 Smart Investing & Trading Score: 100 | |
| Day Percent Change: 3.93% Day Change: 0.71 | |
| Week Change: 3.81% Year-to-date Change: -16.2% | |
| AVNS Links: Profile News Message Board | |
| Charts:- Daily , Weekly | |
| Add AVNS to Watchlist: View: Get Complete AVNS Trend Analysis ➞ | |
 | NAUT Nautilus Biotechnology, Inc. |
| Sector: Health Care | |
| SubSector: Biotechnology | |
| MarketCap: 458 Millions | |
| Recent Price: 2.75 Smart Investing & Trading Score: 90 | |
| Day Percent Change: 8.27% Day Change: 0.21 | |
| Week Change: 10.44% Year-to-date Change: -16.4% | |
| NAUT Links: Profile News Message Board | |
| Charts:- Daily , Weekly | |
| Add NAUT to Watchlist: View: Get Complete NAUT Trend Analysis ➞ | |
 | DVAX Dynavax Technologies Corporation |
| Sector: Health Care | |
| SubSector: Biotechnology | |
| MarketCap: 276.885 Millions | |
| Recent Price: 11.68 Smart Investing & Trading Score: 42 | |
| Day Percent Change: 2.73% Day Change: 0.31 | |
| Week Change: 4.19% Year-to-date Change: -16.5% | |
| DVAX Links: Profile News Message Board | |
| Charts:- Daily , Weekly | |
| Add DVAX to Watchlist: View: Get Complete DVAX Trend Analysis ➞ | |
 | MDXG MiMedx Group, Inc. |
| Sector: Health Care | |
| SubSector: Medical Appliances & Equipment | |
| MarketCap: 371.08 Millions | |
| Recent Price: 7.31 Smart Investing & Trading Score: 29 | |
| Day Percent Change: 18.67% Day Change: 1.15 | |
| Week Change: 16.59% Year-to-date Change: -16.7% | |
| MDXG Links: Profile News Message Board | |
| Charts:- Daily , Weekly | |
| Add MDXG to Watchlist: View: Get Complete MDXG Trend Analysis ➞ | |
 | INSM Insmed Incorporated |
| Sector: Health Care | |
| SubSector: Biotechnology | |
| MarketCap: 1452.45 Millions | |
| Recent Price: 25.59 Smart Investing & Trading Score: 49 | |
| Day Percent Change: 3.52% Day Change: 0.87 | |
| Week Change: 3.19% Year-to-date Change: -17.4% | |
| INSM Links: Profile News Message Board | |
| Charts:- Daily , Weekly | |
| Add INSM to Watchlist: View: Get Complete INSM Trend Analysis ➞ | |
 | PSTX Poseida Therapeutics, Inc. |
| Sector: Health Care | |
| SubSector: Biotechnology | |
| MarketCap: 64487 Millions | |
| Recent Price: 2.77 Smart Investing & Trading Score: 64 | |
| Day Percent Change: 14.46% Day Change: 0.35 | |
| Week Change: 30.05% Year-to-date Change: -17.7% | |
| PSTX Links: Profile News Message Board | |
| Charts:- Daily , Weekly | |
| Add PSTX to Watchlist: View: Get Complete PSTX Trend Analysis ➞ | |
 | HLVX HilleVax, Inc. |
| Sector: Health Care | |
| SubSector: Biotechnology | |
| MarketCap: 680 Millions | |
| Recent Price: 13.53 Smart Investing & Trading Score: 49 | |
| Day Percent Change: 2.58% Day Change: 0.34 | |
| Week Change: 5.62% Year-to-date Change: -17.9% | |
| HLVX Links: Profile News Message Board | |
| Charts:- Daily , Weekly | |
| Add HLVX to Watchlist: View: Get Complete HLVX Trend Analysis ➞ | |
 | OMGA Omega Therapeutics, Inc. |
| Sector: Health Care | |
| SubSector: Biotechnology | |
| MarketCap: 304 Millions | |
| Recent Price: 2.47 Smart Investing & Trading Score: 49 | |
| Day Percent Change: 10.76% Day Change: 0.24 | |
| Week Change: 8.81% Year-to-date Change: -17.9% | |
| OMGA Links: Profile News Message Board | |
| Charts:- Daily , Weekly | |
| Add OMGA to Watchlist: View: Get Complete OMGA Trend Analysis ➞ | |
 | LFST LifeStance Health Group, Inc. |
| Sector: Health Care | |
| SubSector: Medical Care Facilities | |
| MarketCap: 3460 Millions | |
| Recent Price: 6.44 Smart Investing & Trading Score: 64 | |
| Day Percent Change: 4.38% Day Change: 0.27 | |
| Week Change: 3.87% Year-to-date Change: -18.6% | |
| LFST Links: Profile News Message Board | |
| Charts:- Daily , Weekly | |
| Add LFST to Watchlist: View: Get Complete LFST Trend Analysis ➞ | |
 | RCUS Arcus Biosciences, Inc. |
| Sector: Health Care | |
| SubSector: Biotechnology | |
| MarketCap: 539.285 Millions | |
| Recent Price: 15.50 Smart Investing & Trading Score: 42 | |
| Day Percent Change: 1.77% Day Change: 0.27 | |
| Week Change: -0.32% Year-to-date Change: -18.9% | |
| RCUS Links: Profile News Message Board | |
| Charts:- Daily , Weekly | |
| Add RCUS to Watchlist: View: Get Complete RCUS Trend Analysis ➞ | |
 | FENC Fennec Pharmaceuticals Inc. |
| Sector: Health Care | |
| SubSector: Biotechnology | |
| MarketCap: 126.785 Millions | |
| Recent Price: 9.09 Smart Investing & Trading Score: 10 | |
| Day Percent Change: -0.98% Day Change: -0.09 | |
| Week Change: -1.3% Year-to-date Change: -19.0% | |
| FENC Links: Profile News Message Board | |
| Charts:- Daily , Weekly | |
| Add FENC to Watchlist: View: Get Complete FENC Trend Analysis ➞ | |
 | AKYA Akoya Biosciences, Inc. |
| Sector: Health Care | |
| SubSector: Medical Instruments & Supplies | |
| MarketCap: 340 Millions | |
| Recent Price: 3.96 Smart Investing & Trading Score: 59 | |
| Day Percent Change: 3.66% Day Change: 0.14 | |
| Week Change: 4.21% Year-to-date Change: -19.0% | |
| AKYA Links: Profile News Message Board | |
| Charts:- Daily , Weekly | |
| Add AKYA to Watchlist: View: Get Complete AKYA Trend Analysis ➞ | |
 | VREX Varex Imaging Corporation |
| Sector: Health Care | |
| SubSector: Medical Appliances & Equipment | |
| MarketCap: 718.78 Millions | |
| Recent Price: 16.58 Smart Investing & Trading Score: 10 | |
| Day Percent Change: 2.03% Day Change: 0.33 | |
| Week Change: -1.25% Year-to-date Change: -19.1% | |
| VREX Links: Profile News Message Board | |
| Charts:- Daily , Weekly | |
| Add VREX to Watchlist: View: Get Complete VREX Trend Analysis ➞ | |
| For tabular summary view of above stock list: Summary View ➞ 0 - 25 , 25 - 50 , 50 - 75 , 75 - 100 , 100 - 125 , 125 - 150 , 150 - 175 , 175 - 200 , 200 - 225 , 225 - 250 , 250 - 275 , 275 - 300 , 300 - 325 , 325 - 350 | ||
| Click To Change The Sort Order: By Market Cap or Company Size Performance: Year-to-date, Week and Day | |
| Select Chart Type: | ||
| Too many stocks? View smallcap stocks filtered by marketcap & sector |
| Marketcap: All SmallCap Stocks (default-no microcap), Large, Mid-Range, Small & MicroCap |
| Sector: Tech, Finance, Energy, Staples, Retail, Industrial, Materials, Utilities & Medical |
|
Best Stocks Today 12Stocks.com |
© 2024 12Stocks.com Terms & Conditions Privacy Contact Us
All Information Provided Only For Education And Not To Be Used For Investing or Trading. See Terms & Conditions


One More Thing ... Get Best Stocks Delivered Daily!
Never Ever Miss A Move With Our Top Ten Stocks Lists
Find Best Stocks In Any Market - Bull or Bear Market
Take A Peek At Our Top Ten Stocks Lists: Daily, Weekly, Year-to-Date & Top Trends
Find Best Stocks In Any Market - Bull or Bear Market
Take A Peek At Our Top Ten Stocks Lists: Daily, Weekly, Year-to-Date & Top Trends
Smallcap Stocks With Best Up Trends [0-bearish to 100-bullish]: Surmodics [100], Rocky Brands[100], TransMedics Group[100], LendingClub [100], Summit [100], A10 s[100], Carpenter [100], UFP [100], PROCEPT BioRobotics[100], Xencor [100], Trinity Industries[100]
Best Smallcap Stocks Year-to-Date:
Janux [441.55%], Viking [310.69%], Longboard [259.25%], Alpine Immune[239.29%], Avidity Biosciences[185.4%], Bakkt [182.96%], Cullinan Oncology[175.33%], Arcutis Bio[173.68%], Vera [173.32%], Super Micro[159.73%], Y-mAbs [141.79%] Best Smallcap Stocks This Week:
Deciphera [73.11%], Eyenovia [45.65%], Cue Biopharma[39.56%], Seres [30.91%], Poseida [30.05%], P3 Health[29.62%], Phibro Animal[28.44%], TransMedics Group[27.72%], Surmodics [27.36%], LendingTree [26.36%], Rocky Brands[24.92%] Best Smallcap Stocks Daily:
Surmodics [29.74%], Rocky Brands[28.41%], TransMedics Group[24.93%], Ventyx Biosciences[24.63%], Eyenovia [21.84%], LendingClub [19.68%], Summit [19.59%], Powell Industries[18.89%], MiMedx Group[18.67%], CareDx [18.30%], A10 s[17.69%]