
 Login Sign Up


| |||||
 |  | ||||

| 12Stocks.com Market Intelligence |
Best SmallCap Stocks
|
| In a hurry? Small Cap Stock Lists: Performance Trends Table, Stock Charts
Sort Small Cap stocks: Daily, Weekly, Year-to-Date, Market Cap & Trends. Filter Small Cap stocks list by sector: Show all, Tech, Finance, Energy, Staples, Retail, Industrial, Materials, Utilities and HealthCare Filter Small Cap stocks list by size: All Large Medium Small and MicroCap |
| 12Stocks.com Small Cap Stocks Performances & Trends Daily | |||||||||
|
|  The overall Smart Investing & Trading Score is 14 (0-bearish to 100-bullish) which puts Small Cap index in short term bearish trend. The Smart Investing & Trading Score from previous trading session is 41 and hence a deterioration of trend.
| ||||||||
Here are the Smart Investing & Trading Scores of the most requested small cap stocks at 12Stocks.com (click stock name for detailed review):
|


| 12Stocks.com: Investing in Smallcap Index with Stocks | |
|
The following table helps investors and traders sort through current performance and trends (as measured by Smart Investing & Trading Score) of various
stocks in the Smallcap Index. Quick View: Move mouse or cursor over stock symbol (ticker) to view short-term technical chart and over stock name to view long term chart. Click on  to add stock symbol to your watchlist and to add stock symbol to your watchlist and  to view watchlist. Click on any ticker or stock name for detailed market intelligence report for that stock. to view watchlist. Click on any ticker or stock name for detailed market intelligence report for that stock. |
12Stocks.com Performance of Stocks in Smallcap Index
| Ticker | Stock Name | Watchlist | Category | Recent Price | Smart Investing & Trading Score | Change % | YTD Change% |
| OLP | One Liberty |   | Financials | 23.09 | 100 | 0.79% | 5.39% |
| IBOC | Bancshares | | Financials | 57.17 | 100 | 2.73% | 5.25% |
| STC | Stewart Information | | Financials | 61.70 | 22 | -0.50% | 5.02% |
| IIPR | Innovative Industrial | | Financials | 105.53 | 100 | 2.06% | 4.67% |
| LTC | LTC Properties | | Financials | 33.50 | 100 | 1.21% | 4.30% |
| MBI | MBIA | | Financials | 6.35 | 49 | 0.95% | 3.76% |
| SKWD | Skyward Specialty | | Financials | 35.21 | 32 | 0.98% | 3.71% |
| BANC | Banc of California | | Financials | 13.91 | 29 | 1.61% | 3.57% |
| VEL | Velocity Financial | | Financials | 17.15 | 83 | 0.00% | 3.19% |
| CPF | Central Pacific | | Financials | 20.30 | 95 | 1.81% | 3.15% |
| UMH | UMH Properties | | Financials | 15.80 | 83 | -0.75% | 3.13% |
| EPRT | Essential Properties | | Financials | 26.35 | 100 | 0.04% | 3.09% |
| ACT | Enact | | Financials | 29.97 | 73 | 0.82% | 3.06% |
| IRT | Independence Realty | | Financials | 15.76 | 61 | -0.06% | 3.01% |
| LC | LendingClub | | Financials | 9.00 | 100 | 19.68% | 2.97% |
| SIGI | Selective Insurance | | Financials | 102.28 | 57 | 0.62% | 2.81% |
| FULT | Fulton Financial | | Financials | 16.90 | 93 | 2.11% | 2.67% |
| AOMR | Angel Oak | | Financials | 10.88 | 56 | 3.32% | 2.54% |
| GOOD | Gladstone Commercial | | Financials | 13.56 | 100 | 1.42% | 2.42% |
| XHR | Xenia Hotels | | Financials | 13.94 | 10 | 0.50% | 2.35% |
| CXW | CoreCivic | | Financials | 14.84 | 10 | -0.40% | 2.13% |
| AX | Axos Financial | | Financials | 55.50 | 100 | 9.66% | 1.65% |
| ESNT | Essent Group | | Financials | 53.59 | 45 | 1.17% | 1.61% |
| ALX | Alexander s | | Financials | 216.96 | 55 | 2.55% | 1.59% |
| PRK | Park National | | Financials | 134.38 | 88 | 2.03% | 1.14% |
| For chart view version of above stock list: Chart View ➞ 0 - 25 , 25 - 50 , 50 - 75 , 75 - 100 , 100 - 125 , 125 - 150 , 150 - 175 , 175 - 200 , 200 - 225 , 225 - 250 , 250 - 275 , 275 - 300 , 300 - 325 , 325 - 350 , 350 - 375 , 375 - 400 | ||
 | Click To Change The Sort Order: By Market Cap or Company Size Performance: Year-to-date, Week and Day |  |
| Too many stocks? View smallcap stocks filtered by marketcap & sector |
| Marketcap: All SmallCap Stocks (default-no microcap), Large, Mid-Range, Small |
| Smallcap Sector: Tech, Finance, Energy, Staples, Retail, Industrial, Materials, & Medical |
|
Get the most comprehensive stock market coverage daily at 12Stocks.com ➞ Best Stocks Today ➞ Best Stocks Weekly ➞ Best Stocks Year-to-Date ➞ Best Stocks Trends ➞  Best Stocks Today 12Stocks.com Best Nasdaq Stocks ➞ Best S&P 500 Stocks ➞ Best Tech Stocks ➞ Best Biotech Stocks ➞ |
| Detailed Overview of SmallCap Stocks |
| SmallCap Technical Overview, Leaders & Laggards, Top SmallCap ETF Funds & Detailed SmallCap Stocks List, Charts, Trends & More |
| Smallcap: Technical Analysis, Trends & YTD Performance | |
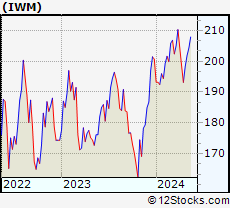
| SmallCap segment as represented by
IWM, an exchange-traded fund [ETF], holds basket of thousands of smallcap stocks from across all major sectors of the US stock market. The smallcap index (contains stocks like Riverbed & Sotheby's) is down by -2.19% and is currently underperforming the overall market by -6.73% year-to-date. Below is a quick view of technical charts and trends: | |
 IWM Weekly Chart |
|
| Long Term Trend: Not Good | |
| Medium Term Trend: Not Good | |
 IWM Daily Chart |
|
| Short Term Trend: Not Good | |
| Overall Trend Score: 14 | |
| YTD Performance: -2.19% | |
| **Trend Scores & Views Are Only For Educational Purposes And Not For Investing | |
| 12Stocks.com: Top Performing Small Cap Index Stocks | ||||||||||||||||||||||||||||||||||||||||||||||||
 The top performing Small Cap Index stocks year to date are
Now, more recently, over last week, the top performing Small Cap Index stocks on the move are


|
||||||||||||||||||||||||||||||||||||||||||||||||
| 12Stocks.com: Investing in Smallcap Index using Exchange Traded Funds | |
|
The following table shows list of key exchange traded funds (ETF) that
help investors track Smallcap index. The following list also includes leveraged ETF funds that track twice or thrice the daily returns of Smallcap indices. Short or inverse ETF funds move in the opposite direction to the index they track and are useful during market pullbacks or during bear markets. Quick View: Move mouse or cursor over ETF symbol (ticker) to view short-term technical chart and over ETF name to view long term chart. Click on ticker or stock name for detailed view. Click on to add stock symbol to your watchlist and to view watchlist. |
12Stocks.com List of ETFs that track Smallcap Index
| Ticker | ETF Name | Watchlist | Recent Price | Smart Investing & Trading Score | Change % | Week % | Year-to-date % |
| IWM | iShares Russell 2000 | | 196.31 | 14 | 0.21 | -1.05 | -2.19% |
| IJR | iShares Core S&P Small-Cap | | 104.74 | 22 | 0.34 | -0.86 | -3.24% |
| VTWO | Vanguard Russell 2000 ETF | | 79.36 | 14 | 0.25 | -1.07 | -2.15% |
| IWN | iShares Russell 2000 Value | | 149.82 | 22 | 0.52 | -0.87 | -3.55% |
| IJS | iShares S&P Small-Cap 600 Value | | 96.40 | 15 | 0.33 | -0.81 | -6.47% |
| IWO | iShares Russell 2000 Growth | | 249.58 | 7 | -0.30 | -1.39 | -1.05% |
| IJT | iShares S&P Small-Cap 600 Growth | | 124.94 | 15 | 0.27 | -0.91 | -0.16% |
| XSLV | PowerShares S&P SmallCap Low Volatil ETF | | 42.83 | 62 | 0.68 | 0.26 | -2.99% |
| SDD | ProShares UltraShort SmallCap600 | | 19.71 | 86 | 0.70 | 1.85 | 6.95% |
| SMLV | SPDR SSGA US Small Cap Low Volatil ETF | | 107.44 | 45 | 1.11 | -0.07 | -4.51% |
| SBB | ProShares Short SmallCap600 | | 16.56 | 79 | 0.05 | 1.06 | 3.94% |
| SAA | ProShares Ultra SmallCap600 | | 22.58 | 8 | -0.08 | -1.99 | -9.49% |
| 12Stocks.com: Charts, Trends, Fundamental Data and Performances of SmallCap Stocks | |
|
We now take in-depth look at all SmallCap stocks including charts, multi-period performances and overall trends (as measured by Smart Investing & Trading Score). One can sort SmallCap stocks (click link to choose) by Daily, Weekly and by Year-to-Date performances. Also, one can sort by size of the company or by market capitalization. |
| Select Your Default Chart Type: | |||||
| |||||
| Click on stock symbol or name for detailed view. Click on to add stock symbol to your watchlist and to view watchlist. Quick View: Move mouse or cursor over "Daily" to quickly view daily technical stock chart and over "Weekly" to view weekly technical stock chart. | |||||

 | OLP One Liberty Properties, Inc. |
| Sector: Financials | |
| SubSector: REIT - Diversified | |
| MarketCap: 378.353 Millions | |
| Recent Price: 23.09 Smart Investing & Trading Score: 100 | |
| Day Percent Change: 0.79% Day Change: 0.18 | |
| Week Change: 1.58% Year-to-date Change: 5.4% | |
| OLP Links: Profile News Message Board | |
| Charts:- Daily , Weekly | |
| Add OLP to Watchlist: View: Get Complete OLP Trend Analysis ➞ | |
 | IBOC International Bancshares Corporation |
| Sector: Financials | |
| SubSector: Regional - Southwest Banks | |
| MarketCap: 1159.45 Millions | |
| Recent Price: 57.17 Smart Investing & Trading Score: 100 | |
| Day Percent Change: 2.73% Day Change: 1.52 | |
| Week Change: 1.82% Year-to-date Change: 5.3% | |
| IBOC Links: Profile News Message Board | |
| Charts:- Daily , Weekly | |
| Add IBOC to Watchlist: View: Get Complete IBOC Trend Analysis ➞ | |
 | STC Stewart Information Services Corporation |
| Sector: Financials | |
| SubSector: Property & Casualty Insurance | |
| MarketCap: 629.912 Millions | |
| Recent Price: 61.70 Smart Investing & Trading Score: 22 | |
| Day Percent Change: -0.50% Day Change: -0.31 | |
| Week Change: -1.2% Year-to-date Change: 5.0% | |
| STC Links: Profile News Message Board | |
| Charts:- Daily , Weekly | |
| Add STC to Watchlist: View: Get Complete STC Trend Analysis ➞ | |
 | IIPR Innovative Industrial Properties, Inc. |
| Sector: Financials | |
| SubSector: REIT - Industrial | |
| MarketCap: 1193.29 Millions | |
| Recent Price: 105.53 Smart Investing & Trading Score: 100 | |
| Day Percent Change: 2.06% Day Change: 2.13 | |
| Week Change: 8% Year-to-date Change: 4.7% | |
| IIPR Links: Profile News Message Board | |
| Charts:- Daily , Weekly | |
| Add IIPR to Watchlist: View: Get Complete IIPR Trend Analysis ➞ | |
 | LTC LTC Properties, Inc. |
| Sector: Financials | |
| SubSector: REIT - Healthcare Facilities | |
| MarketCap: 1369.24 Millions | |
| Recent Price: 33.50 Smart Investing & Trading Score: 100 | |
| Day Percent Change: 1.21% Day Change: 0.40 | |
| Week Change: 2.89% Year-to-date Change: 4.3% | |
| LTC Links: Profile News Message Board | |
| Charts:- Daily , Weekly | |
| Add LTC to Watchlist: View: Get Complete LTC Trend Analysis ➞ | |
 | MBI MBIA Inc. |
| Sector: Financials | |
| SubSector: Property & Casualty Insurance | |
| MarketCap: 539.012 Millions | |
| Recent Price: 6.35 Smart Investing & Trading Score: 49 | |
| Day Percent Change: 0.95% Day Change: 0.06 | |
| Week Change: -6.89% Year-to-date Change: 3.8% | |
| MBI Links: Profile News Message Board | |
| Charts:- Daily , Weekly | |
| Add MBI to Watchlist: View: Get Complete MBI Trend Analysis ➞ | |
 | SKWD Skyward Specialty Insurance Group, Inc. |
| Sector: Financials | |
| SubSector: Insurance - Property & Casualty | |
| MarketCap: 936 Millions | |
| Recent Price: 35.21 Smart Investing & Trading Score: 32 | |
| Day Percent Change: 0.98% Day Change: 0.34 | |
| Week Change: 5.45% Year-to-date Change: 3.7% | |
| SKWD Links: Profile News Message Board | |
| Charts:- Daily , Weekly | |
| Add SKWD to Watchlist: View: Get Complete SKWD Trend Analysis ➞ | |
 | BANC Banc of California, Inc. |
| Sector: Financials | |
| SubSector: Regional - Pacific Banks | |
| MarketCap: 459.929 Millions | |
| Recent Price: 13.91 Smart Investing & Trading Score: 29 | |
| Day Percent Change: 1.61% Day Change: 0.22 | |
| Week Change: -2.86% Year-to-date Change: 3.6% | |
| BANC Links: Profile News Message Board | |
| Charts:- Daily , Weekly | |
| Add BANC to Watchlist: View: Get Complete BANC Trend Analysis ➞ | |
 | VEL Velocity Financial, Inc. |
| Sector: Financials | |
| SubSector: Mortgage Finance | |
| MarketCap: 12157 Millions | |
| Recent Price: 17.15 Smart Investing & Trading Score: 83 | |
| Day Percent Change: 0.00% Day Change: 0.00 | |
| Week Change: 0.82% Year-to-date Change: 3.2% | |
| VEL Links: Profile News Message Board | |
| Charts:- Daily , Weekly | |
| Add VEL to Watchlist: View: Get Complete VEL Trend Analysis ➞ | |
 | CPF Central Pacific Financial Corp. |
| Sector: Financials | |
| SubSector: Regional - Pacific Banks | |
| MarketCap: 407.429 Millions | |
| Recent Price: 20.30 Smart Investing & Trading Score: 95 | |
| Day Percent Change: 1.81% Day Change: 0.36 | |
| Week Change: 0.89% Year-to-date Change: 3.2% | |
| CPF Links: Profile News Message Board | |
| Charts:- Daily , Weekly | |
| Add CPF to Watchlist: View: Get Complete CPF Trend Analysis ➞ | |
 | UMH UMH Properties, Inc. |
| Sector: Financials | |
| SubSector: REIT - Diversified | |
| MarketCap: 433.353 Millions | |
| Recent Price: 15.80 Smart Investing & Trading Score: 83 | |
| Day Percent Change: -0.75% Day Change: -0.12 | |
| Week Change: 0.89% Year-to-date Change: 3.1% | |
| UMH Links: Profile News Message Board | |
| Charts:- Daily , Weekly | |
| Add UMH to Watchlist: View: Get Complete UMH Trend Analysis ➞ | |
 | EPRT Essential Properties Realty Trust, Inc. |
| Sector: Financials | |
| SubSector: REIT - Diversified | |
| MarketCap: 1424.43 Millions | |
| Recent Price: 26.35 Smart Investing & Trading Score: 100 | |
| Day Percent Change: 0.04% Day Change: 0.01 | |
| Week Change: 2.57% Year-to-date Change: 3.1% | |
| EPRT Links: Profile News Message Board | |
| Charts:- Daily , Weekly | |
| Add EPRT to Watchlist: View: Get Complete EPRT Trend Analysis ➞ | |
 | ACT Enact Holdings, Inc. |
| Sector: Financials | |
| SubSector: Insurance - Specialty | |
| MarketCap: 4010 Millions | |
| Recent Price: 29.97 Smart Investing & Trading Score: 73 | |
| Day Percent Change: 0.82% Day Change: 0.24 | |
| Week Change: 0.1% Year-to-date Change: 3.1% | |
| ACT Links: Profile News Message Board | |
| Charts:- Daily , Weekly | |
| Add ACT to Watchlist: View: Get Complete ACT Trend Analysis ➞ | |
 | IRT Independence Realty Trust, Inc. |
| Sector: Financials | |
| SubSector: REIT - Residential | |
| MarketCap: 980.161 Millions | |
| Recent Price: 15.76 Smart Investing & Trading Score: 61 | |
| Day Percent Change: -0.06% Day Change: -0.01 | |
| Week Change: -0.63% Year-to-date Change: 3.0% | |
| IRT Links: Profile News Message Board | |
| Charts:- Daily , Weekly | |
| Add IRT to Watchlist: View: Get Complete IRT Trend Analysis ➞ | |
 | LC LendingClub Corporation |
| Sector: Financials | |
| SubSector: Credit Services | |
| MarketCap: 852.308 Millions | |
| Recent Price: 9.00 Smart Investing & Trading Score: 100 | |
| Day Percent Change: 19.68% Day Change: 1.48 | |
| Week Change: 11.11% Year-to-date Change: 3.0% | |
| LC Links: Profile News Message Board | |
| Charts:- Daily , Weekly | |
| Add LC to Watchlist: View: Get Complete LC Trend Analysis ➞ | |
 | SIGI Selective Insurance Group, Inc. |
| Sector: Financials | |
| SubSector: Property & Casualty Insurance | |
| MarketCap: 3039.12 Millions | |
| Recent Price: 102.28 Smart Investing & Trading Score: 57 | |
| Day Percent Change: 0.62% Day Change: 0.63 | |
| Week Change: 2.15% Year-to-date Change: 2.8% | |
| SIGI Links: Profile News Message Board | |
| Charts:- Daily , Weekly | |
| Add SIGI to Watchlist: View: Get Complete SIGI Trend Analysis ➞ | |
 | FULT Fulton Financial Corporation |
| Sector: Financials | |
| SubSector: Regional - Northeast Banks | |
| MarketCap: 2030.89 Millions | |
| Recent Price: 16.90 Smart Investing & Trading Score: 93 | |
| Day Percent Change: 2.11% Day Change: 0.35 | |
| Week Change: 8.19% Year-to-date Change: 2.7% | |
| FULT Links: Profile News Message Board | |
| Charts:- Daily , Weekly | |
| Add FULT to Watchlist: View: Get Complete FULT Trend Analysis ➞ | |
 | AOMR Angel Oak Mortgage REIT, Inc. |
| Sector: Financials | |
| SubSector: REIT - Mortgage | |
| MarketCap: 202 Millions | |
| Recent Price: 10.88 Smart Investing & Trading Score: 56 | |
| Day Percent Change: 3.32% Day Change: 0.35 | |
| Week Change: -0.09% Year-to-date Change: 2.5% | |
| AOMR Links: Profile News Message Board | |
| Charts:- Daily , Weekly | |
| Add AOMR to Watchlist: View: Get Complete AOMR Trend Analysis ➞ | |
 | GOOD Gladstone Commercial Corporation |
| Sector: Financials | |
| SubSector: REIT - Diversified | |
| MarketCap: 425.253 Millions | |
| Recent Price: 13.56 Smart Investing & Trading Score: 100 | |
| Day Percent Change: 1.42% Day Change: 0.19 | |
| Week Change: 1.73% Year-to-date Change: 2.4% | |
| GOOD Links: Profile News Message Board | |
| Charts:- Daily , Weekly | |
| Add GOOD to Watchlist: View: Get Complete GOOD Trend Analysis ➞ | |
 | XHR Xenia Hotels & Resorts, Inc. |
| Sector: Financials | |
| SubSector: REIT - Hotel/Motel | |
| MarketCap: 1058.24 Millions | |
| Recent Price: 13.94 Smart Investing & Trading Score: 10 | |
| Day Percent Change: 0.50% Day Change: 0.07 | |
| Week Change: -1.34% Year-to-date Change: 2.4% | |
| XHR Links: Profile News Message Board | |
| Charts:- Daily , Weekly | |
| Add XHR to Watchlist: View: Get Complete XHR Trend Analysis ➞ | |
 | CXW CoreCivic, Inc. |
| Sector: Financials | |
| SubSector: REIT - Diversified | |
| MarketCap: 1440.23 Millions | |
| Recent Price: 14.84 Smart Investing & Trading Score: 10 | |
| Day Percent Change: -0.40% Day Change: -0.06 | |
| Week Change: -1.46% Year-to-date Change: 2.1% | |
| CXW Links: Profile News Message Board | |
| Charts:- Daily , Weekly | |
| Add CXW to Watchlist: View: Get Complete CXW Trend Analysis ➞ | |
 | AX Axos Financial, Inc. |
| Sector: Financials | |
| SubSector: Savings & Loans | |
| MarketCap: 1037.3 Millions | |
| Recent Price: 55.50 Smart Investing & Trading Score: 100 | |
| Day Percent Change: 9.66% Day Change: 4.89 | |
| Week Change: 4.62% Year-to-date Change: 1.7% | |
| AX Links: Profile News Message Board | |
| Charts:- Daily , Weekly | |
| Add AX to Watchlist: View: Get Complete AX Trend Analysis ➞ | |
 | ESNT Essent Group Ltd. |
| Sector: Financials | |
| SubSector: Mortgage Investment | |
| MarketCap: 2806.19 Millions | |
| Recent Price: 53.59 Smart Investing & Trading Score: 45 | |
| Day Percent Change: 1.17% Day Change: 0.62 | |
| Week Change: -0.72% Year-to-date Change: 1.6% | |
| ESNT Links: Profile News Message Board | |
| Charts:- Daily , Weekly | |
| Add ESNT to Watchlist: View: Get Complete ESNT Trend Analysis ➞ | |
 | ALX Alexander s, Inc. |
| Sector: Financials | |
| SubSector: REIT - Retail | |
| MarketCap: 1251.54 Millions | |
| Recent Price: 216.96 Smart Investing & Trading Score: 55 | |
| Day Percent Change: 2.55% Day Change: 5.40 | |
| Week Change: 4.86% Year-to-date Change: 1.6% | |
| ALX Links: Profile News Message Board | |
| Charts:- Daily , Weekly | |
| Add ALX to Watchlist: View: Get Complete ALX Trend Analysis ➞ | |
 | PRK Park National Corporation |
| Sector: Financials | |
| SubSector: Regional - Midwest Banks | |
| MarketCap: 1416.6 Millions | |
| Recent Price: 134.38 Smart Investing & Trading Score: 88 | |
| Day Percent Change: 2.03% Day Change: 2.67 | |
| Week Change: 0.04% Year-to-date Change: 1.1% | |
| PRK Links: Profile News Message Board | |
| Charts:- Daily , Weekly | |
| Add PRK to Watchlist: View: Get Complete PRK Trend Analysis ➞ | |
| For tabular summary view of above stock list: Summary View ➞ 0 - 25 , 25 - 50 , 50 - 75 , 75 - 100 , 100 - 125 , 125 - 150 , 150 - 175 , 175 - 200 , 200 - 225 , 225 - 250 , 250 - 275 , 275 - 300 , 300 - 325 , 325 - 350 , 350 - 375 , 375 - 400 | ||
| Click To Change The Sort Order: By Market Cap or Company Size Performance: Year-to-date, Week and Day | |
| Select Chart Type: | ||
| Too many stocks? View smallcap stocks filtered by marketcap & sector |
| Marketcap: All SmallCap Stocks (default-no microcap), Large, Mid-Range, Small & MicroCap |
| Sector: Tech, Finance, Energy, Staples, Retail, Industrial, Materials, Utilities & Medical |
|
Best Stocks Today 12Stocks.com |
© 2024 12Stocks.com Terms & Conditions Privacy Contact Us
All Information Provided Only For Education And Not To Be Used For Investing or Trading. See Terms & Conditions


One More Thing ... Get Best Stocks Delivered Daily!
Never Ever Miss A Move With Our Top Ten Stocks Lists
Find Best Stocks In Any Market - Bull or Bear Market
Take A Peek At Our Top Ten Stocks Lists: Daily, Weekly, Year-to-Date & Top Trends
Find Best Stocks In Any Market - Bull or Bear Market
Take A Peek At Our Top Ten Stocks Lists: Daily, Weekly, Year-to-Date & Top Trends
Smallcap Stocks With Best Up Trends [0-bearish to 100-bullish]: Surmodics [100], Rocky Brands[100], TransMedics Group[100], LendingClub [100], Summit [100], A10 s[100], Carpenter [100], UFP [100], PROCEPT BioRobotics[100], Xencor [100], Trinity Industries[100]
Best Smallcap Stocks Year-to-Date:
Janux [441.55%], Viking [310.69%], Longboard [259.25%], Alpine Immune[239.29%], Avidity Biosciences[185.4%], Bakkt [182.96%], Cullinan Oncology[175.33%], Arcutis Bio[173.68%], Vera [173.32%], Super Micro[159.73%], Y-mAbs [141.79%] Best Smallcap Stocks This Week:
Deciphera [73.11%], Eyenovia [45.65%], Cue Biopharma[39.56%], Seres [30.91%], Poseida [30.05%], P3 Health[29.62%], Phibro Animal[28.44%], TransMedics Group[27.72%], Surmodics [27.36%], LendingTree [26.36%], Rocky Brands[24.92%] Best Smallcap Stocks Daily:
Surmodics [29.74%], Rocky Brands[28.41%], TransMedics Group[24.93%], Ventyx Biosciences[24.63%], Eyenovia [21.84%], LendingClub [19.68%], Summit [19.59%], Powell Industries[18.89%], MiMedx Group[18.67%], CareDx [18.30%], A10 s[17.69%]