
 Login Sign Up


| |||||
 |  | ||||

| 12Stocks.com Market Intelligence |
Best SmallCap Stocks
|
| In a hurry? Small Cap Stock Lists: Performance Trends Table, Stock Charts
Sort Small Cap stocks: Daily, Weekly, Year-to-Date, Market Cap & Trends. Filter Small Cap stocks list by sector: Show all, Tech, Finance, Energy, Staples, Retail, Industrial, Materials, Utilities and HealthCare Filter Small Cap stocks list by size: All Large Medium Small and MicroCap |
| 12Stocks.com Small Cap Stocks Performances & Trends Daily | |||||||||
|
|  The overall Smart Investing & Trading Score is 14 (0-bearish to 100-bullish) which puts Small Cap index in short term bearish trend. The Smart Investing & Trading Score from previous trading session is 41 and hence a deterioration of trend.
| ||||||||
Here are the Smart Investing & Trading Scores of the most requested small cap stocks at 12Stocks.com (click stock name for detailed review):
|


| 12Stocks.com: Investing in Smallcap Index with Stocks | |
|
The following table helps investors and traders sort through current performance and trends (as measured by Smart Investing & Trading Score) of various
stocks in the Smallcap Index. Quick View: Move mouse or cursor over stock symbol (ticker) to view short-term technical chart and over stock name to view long term chart. Click on  to add stock symbol to your watchlist and to add stock symbol to your watchlist and  to view watchlist. Click on any ticker or stock name for detailed market intelligence report for that stock. to view watchlist. Click on any ticker or stock name for detailed market intelligence report for that stock. |
12Stocks.com Performance of Stocks in Smallcap Index
| Ticker | Stock Name | Watchlist | Category | Recent Price | Smart Investing & Trading Score | Change % | YTD Change% |
| NREF | NexPoint Real |   | Financials | 12.95 | 17 | -0.08% | -17.70% |
| PKBK | Parke Bancorp | | Financials | 16.61 | 57 | 0.67% | -17.98% |
| HTBK | Heritage Commerce | | Financials | 8.13 | 74 | 2.39% | -18.04% |
| TSBK | Timberland Bancorp | | Financials | 25.77 | 67 | 4.67% | -18.09% |
| FISI | Financial Institutions | | Financials | 17.43 | 44 | 1.22% | -18.17% |
| OVLY | Oak Valley | | Financials | 24.41 | 47 | 1.94% | -18.50% |
| PWOD | Penns Woods | | Financials | 18.30 | 74 | 4.69% | -18.70% |
| CBNK | Capital Bancorp | | Financials | 19.63 | 42 | 1.19% | -18.88% |
| TBBK | Bancorp | | Financials | 31.27 | 50 | 4.44% | -18.91% |
| CNOB | ConnectOne Bancorp | | Financials | 18.55 | 57 | 3.57% | -19.03% |
| CZNC | Citizens & Northern | | Financials | 18.16 | 67 | 6.51% | -19.04% |
| HAFC | Hanmi Financial | | Financials | 15.70 | 85 | 2.61% | -19.07% |
| WASH | Washington Trust | | Financials | 26.20 | 86 | 2.91% | -19.09% |
| FRBA | First Bank | | Financials | 11.89 | 17 | 2.24% | -19.12% |
| STHO | Star | | Financials | 12.10 | 60 | 1.72% | -19.34% |
| WTBA | West Ban | | Financials | 17.02 | 67 | 4.67% | -19.72% |
| PFIS | Peoples Financial | | Financials | 38.99 | 74 | 2.96% | -19.94% |
| BOH | Bank of Hawaii | | Financials | 58.00 | 42 | 2.31% | -19.96% |
| CUBI | Customers Bancorp | | Financials | 46.09 | 14 | 0.92% | -20.01% |
| FNLC | First Bancorp | | Financials | 22.56 | 42 | 2.15% | -20.07% |
| STRS | Stratus Properties | | Financials | 22.91 | 93 | 1.01% | -20.62% |
| ARL | American Realty | | Financials | 13.78 | 17 | -2.61% | -20.85% |
| CFFN | Capitol Federal | | Financials | 5.10 | 42 | 6.92% | -20.93% |
| AI | C3.ai | | Financials | 22.69 | 57 | 0.71% | -20.97% |
| CATY | Cathay General | | Financials | 35.18 | 49 | 2.15% | -21.07% |
| For chart view version of above stock list: Chart View ➞ 0 - 25 , 25 - 50 , 50 - 75 , 75 - 100 , 100 - 125 , 125 - 150 , 150 - 175 , 175 - 200 , 200 - 225 , 225 - 250 , 250 - 275 , 275 - 300 , 300 - 325 , 325 - 350 , 350 - 375 , 375 - 400 | ||
 | Click To Change The Sort Order: By Market Cap or Company Size Performance: Year-to-date, Week and Day |  |
| Too many stocks? View smallcap stocks filtered by marketcap & sector |
| Marketcap: All SmallCap Stocks (default-no microcap), Large, Mid-Range, Small |
| Smallcap Sector: Tech, Finance, Energy, Staples, Retail, Industrial, Materials, & Medical |
|
Get the most comprehensive stock market coverage daily at 12Stocks.com ➞ Best Stocks Today ➞ Best Stocks Weekly ➞ Best Stocks Year-to-Date ➞ Best Stocks Trends ➞  Best Stocks Today 12Stocks.com Best Nasdaq Stocks ➞ Best S&P 500 Stocks ➞ Best Tech Stocks ➞ Best Biotech Stocks ➞ |
| Detailed Overview of SmallCap Stocks |
| SmallCap Technical Overview, Leaders & Laggards, Top SmallCap ETF Funds & Detailed SmallCap Stocks List, Charts, Trends & More |
| Smallcap: Technical Analysis, Trends & YTD Performance | |
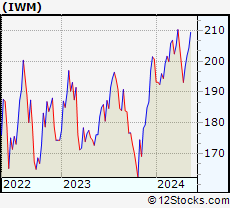
| SmallCap segment as represented by
IWM, an exchange-traded fund [ETF], holds basket of thousands of smallcap stocks from across all major sectors of the US stock market. The smallcap index (contains stocks like Riverbed & Sotheby's) is down by -2.19% and is currently underperforming the overall market by -6.73% year-to-date. Below is a quick view of technical charts and trends: | |
 IWM Weekly Chart |
|
| Long Term Trend: Not Good | |
| Medium Term Trend: Not Good | |
 IWM Daily Chart |
|
| Short Term Trend: Not Good | |
| Overall Trend Score: 14 | |
| YTD Performance: -2.19% | |
| **Trend Scores & Views Are Only For Educational Purposes And Not For Investing | |
| 12Stocks.com: Top Performing Small Cap Index Stocks | ||||||||||||||||||||||||||||||||||||||||||||||||
 The top performing Small Cap Index stocks year to date are
Now, more recently, over last week, the top performing Small Cap Index stocks on the move are


|
||||||||||||||||||||||||||||||||||||||||||||||||
| 12Stocks.com: Investing in Smallcap Index using Exchange Traded Funds | |
|
The following table shows list of key exchange traded funds (ETF) that
help investors track Smallcap index. The following list also includes leveraged ETF funds that track twice or thrice the daily returns of Smallcap indices. Short or inverse ETF funds move in the opposite direction to the index they track and are useful during market pullbacks or during bear markets. Quick View: Move mouse or cursor over ETF symbol (ticker) to view short-term technical chart and over ETF name to view long term chart. Click on ticker or stock name for detailed view. Click on to add stock symbol to your watchlist and to view watchlist. |
12Stocks.com List of ETFs that track Smallcap Index
| Ticker | ETF Name | Watchlist | Recent Price | Smart Investing & Trading Score | Change % | Week % | Year-to-date % |
| IWM | iShares Russell 2000 | | 196.31 | 14 | 0.21 | -1.05 | -2.19% |
| IJR | iShares Core S&P Small-Cap | | 104.74 | 22 | 0.34 | -0.86 | -3.24% |
| VTWO | Vanguard Russell 2000 ETF | | 79.36 | 14 | 0.25 | -1.07 | -2.15% |
| IWN | iShares Russell 2000 Value | | 149.82 | 22 | 0.52 | -0.87 | -3.55% |
| IJS | iShares S&P Small-Cap 600 Value | | 96.40 | 15 | 0.33 | -0.81 | -6.47% |
| IWO | iShares Russell 2000 Growth | | 249.58 | 7 | -0.30 | -1.39 | -1.05% |
| IJT | iShares S&P Small-Cap 600 Growth | | 124.94 | 15 | 0.27 | -0.91 | -0.16% |
| XSLV | PowerShares S&P SmallCap Low Volatil ETF | | 42.83 | 62 | 0.68 | 0.26 | -2.99% |
| SDD | ProShares UltraShort SmallCap600 | | 19.71 | 86 | 0.70 | 1.85 | 6.95% |
| SMLV | SPDR SSGA US Small Cap Low Volatil ETF | | 107.44 | 45 | 1.11 | -0.07 | -4.51% |
| SBB | ProShares Short SmallCap600 | | 16.56 | 79 | 0.05 | 1.06 | 3.94% |
| SAA | ProShares Ultra SmallCap600 | | 22.58 | 8 | -0.08 | -1.99 | -9.49% |
| 12Stocks.com: Charts, Trends, Fundamental Data and Performances of SmallCap Stocks | |
|
We now take in-depth look at all SmallCap stocks including charts, multi-period performances and overall trends (as measured by Smart Investing & Trading Score). One can sort SmallCap stocks (click link to choose) by Daily, Weekly and by Year-to-Date performances. Also, one can sort by size of the company or by market capitalization. |
| Select Your Default Chart Type: | |||||
| |||||
| Click on stock symbol or name for detailed view. Click on to add stock symbol to your watchlist and to view watchlist. Quick View: Move mouse or cursor over "Daily" to quickly view daily technical stock chart and over "Weekly" to view weekly technical stock chart. | |||||

 | NREF NexPoint Real Estate Finance, Inc. |
| Sector: Financials | |
| SubSector: REIT Diversified | |
| MarketCap: 97267 Millions | |
| Recent Price: 12.95 Smart Investing & Trading Score: 17 | |
| Day Percent Change: -0.08% Day Change: -0.01 | |
| Week Change: -2.34% Year-to-date Change: -17.7% | |
| NREF Links: Profile News Message Board | |
| Charts:- Daily , Weekly | |
| Add NREF to Watchlist: View: Get Complete NREF Trend Analysis ➞ | |
 | PKBK Parke Bancorp, Inc. |
| Sector: Financials | |
| SubSector: Regional - Northeast Banks | |
| MarketCap: 165.799 Millions | |
| Recent Price: 16.61 Smart Investing & Trading Score: 57 | |
| Day Percent Change: 0.67% Day Change: 0.11 | |
| Week Change: 0.91% Year-to-date Change: -18.0% | |
| PKBK Links: Profile News Message Board | |
| Charts:- Daily , Weekly | |
| Add PKBK to Watchlist: View: Get Complete PKBK Trend Analysis ➞ | |
 | HTBK Heritage Commerce Corp |
| Sector: Financials | |
| SubSector: Regional - Pacific Banks | |
| MarketCap: 416.129 Millions | |
| Recent Price: 8.13 Smart Investing & Trading Score: 74 | |
| Day Percent Change: 2.39% Day Change: 0.19 | |
| Week Change: 1.63% Year-to-date Change: -18.0% | |
| HTBK Links: Profile News Message Board | |
| Charts:- Daily , Weekly | |
| Add HTBK to Watchlist: View: Get Complete HTBK Trend Analysis ➞ | |
 | TSBK Timberland Bancorp, Inc. |
| Sector: Financials | |
| SubSector: Savings & Loans | |
| MarketCap: 155.03 Millions | |
| Recent Price: 25.77 Smart Investing & Trading Score: 67 | |
| Day Percent Change: 4.67% Day Change: 1.15 | |
| Week Change: 2.06% Year-to-date Change: -18.1% | |
| TSBK Links: Profile News Message Board | |
| Charts:- Daily , Weekly | |
| Add TSBK to Watchlist: View: Get Complete TSBK Trend Analysis ➞ | |
 | FISI Financial Institutions, Inc. |
| Sector: Financials | |
| SubSector: Regional - Mid-Atlantic Banks | |
| MarketCap: 253.459 Millions | |
| Recent Price: 17.43 Smart Investing & Trading Score: 44 | |
| Day Percent Change: 1.22% Day Change: 0.21 | |
| Week Change: -0.97% Year-to-date Change: -18.2% | |
| FISI Links: Profile News Message Board | |
| Charts:- Daily , Weekly | |
| Add FISI to Watchlist: View: Get Complete FISI Trend Analysis ➞ | |
 | OVLY Oak Valley Bancorp |
| Sector: Financials | |
| SubSector: Regional - Pacific Banks | |
| MarketCap: 148.429 Millions | |
| Recent Price: 24.41 Smart Investing & Trading Score: 47 | |
| Day Percent Change: 1.94% Day Change: 0.46 | |
| Week Change: 0.29% Year-to-date Change: -18.5% | |
| OVLY Links: Profile News Message Board | |
| Charts:- Daily , Weekly | |
| Add OVLY to Watchlist: View: Get Complete OVLY Trend Analysis ➞ | |
 | PWOD Penns Woods Bancorp, Inc. |
| Sector: Financials | |
| SubSector: Regional - Mid-Atlantic Banks | |
| MarketCap: 152.559 Millions | |
| Recent Price: 18.30 Smart Investing & Trading Score: 74 | |
| Day Percent Change: 4.69% Day Change: 0.82 | |
| Week Change: 4.48% Year-to-date Change: -18.7% | |
| PWOD Links: Profile News Message Board | |
| Charts:- Daily , Weekly | |
| Add PWOD to Watchlist: View: Get Complete PWOD Trend Analysis ➞ | |
 | CBNK Capital Bancorp, Inc. |
| Sector: Financials | |
| SubSector: Savings & Loans | |
| MarketCap: 174.93 Millions | |
| Recent Price: 19.63 Smart Investing & Trading Score: 42 | |
| Day Percent Change: 1.19% Day Change: 0.23 | |
| Week Change: 0.26% Year-to-date Change: -18.9% | |
| CBNK Links: Profile News Message Board | |
| Charts:- Daily , Weekly | |
| Add CBNK to Watchlist: View: Get Complete CBNK Trend Analysis ➞ | |
 | TBBK The Bancorp, Inc. |
| Sector: Financials | |
| SubSector: Regional - Mid-Atlantic Banks | |
| MarketCap: 267.859 Millions | |
| Recent Price: 31.27 Smart Investing & Trading Score: 50 | |
| Day Percent Change: 4.44% Day Change: 1.33 | |
| Week Change: 1.53% Year-to-date Change: -18.9% | |
| TBBK Links: Profile News Message Board | |
| Charts:- Daily , Weekly | |
| Add TBBK to Watchlist: View: Get Complete TBBK Trend Analysis ➞ | |
 | CNOB ConnectOne Bancorp, Inc. |
| Sector: Financials | |
| SubSector: Regional - Northeast Banks | |
| MarketCap: 491.899 Millions | |
| Recent Price: 18.55 Smart Investing & Trading Score: 57 | |
| Day Percent Change: 3.57% Day Change: 0.64 | |
| Week Change: 1.37% Year-to-date Change: -19.0% | |
| CNOB Links: Profile News Message Board | |
| Charts:- Daily , Weekly | |
| Add CNOB to Watchlist: View: Get Complete CNOB Trend Analysis ➞ | |
 | CZNC Citizens & Northern Corporation |
| Sector: Financials | |
| SubSector: Regional - Mid-Atlantic Banks | |
| MarketCap: 274.459 Millions | |
| Recent Price: 18.16 Smart Investing & Trading Score: 67 | |
| Day Percent Change: 6.51% Day Change: 1.11 | |
| Week Change: 1.51% Year-to-date Change: -19.0% | |
| CZNC Links: Profile News Message Board | |
| Charts:- Daily , Weekly | |
| Add CZNC to Watchlist: View: Get Complete CZNC Trend Analysis ➞ | |
 | HAFC Hanmi Financial Corporation |
| Sector: Financials | |
| SubSector: Regional - Pacific Banks | |
| MarketCap: 319.929 Millions | |
| Recent Price: 15.70 Smart Investing & Trading Score: 85 | |
| Day Percent Change: 2.61% Day Change: 0.40 | |
| Week Change: -0.76% Year-to-date Change: -19.1% | |
| HAFC Links: Profile News Message Board | |
| Charts:- Daily , Weekly | |
| Add HAFC to Watchlist: View: Get Complete HAFC Trend Analysis ➞ | |
 | WASH Washington Trust Bancorp, Inc. |
| Sector: Financials | |
| SubSector: Regional - Northeast Banks | |
| MarketCap: 590.099 Millions | |
| Recent Price: 26.20 Smart Investing & Trading Score: 86 | |
| Day Percent Change: 2.91% Day Change: 0.74 | |
| Week Change: 0.23% Year-to-date Change: -19.1% | |
| WASH Links: Profile News Message Board | |
| Charts:- Daily , Weekly | |
| Add WASH to Watchlist: View: Get Complete WASH Trend Analysis ➞ | |
 | FRBA First Bank |
| Sector: Financials | |
| SubSector: Regional - Mid-Atlantic Banks | |
| MarketCap: 124.859 Millions | |
| Recent Price: 11.89 Smart Investing & Trading Score: 17 | |
| Day Percent Change: 2.24% Day Change: 0.26 | |
| Week Change: -2.06% Year-to-date Change: -19.1% | |
| FRBA Links: Profile News Message Board | |
| Charts:- Daily , Weekly | |
| Add FRBA to Watchlist: View: Get Complete FRBA Trend Analysis ➞ | |
 | STHO Star Holdings |
| Sector: Financials | |
| SubSector: Financials Services | |
| MarketCap: 195 Millions | |
| Recent Price: 12.10 Smart Investing & Trading Score: 60 | |
| Day Percent Change: 1.72% Day Change: 0.21 | |
| Week Change: 3.2% Year-to-date Change: -19.3% | |
| STHO Links: Profile News Message Board | |
| Charts:- Daily , Weekly | |
| Add STHO to Watchlist: View: Get Complete STHO Trend Analysis ➞ | |
 | WTBA West Bancorporation, Inc. |
| Sector: Financials | |
| SubSector: Regional - Southwest Banks | |
| MarketCap: 272.965 Millions | |
| Recent Price: 17.02 Smart Investing & Trading Score: 67 | |
| Day Percent Change: 4.67% Day Change: 0.76 | |
| Week Change: 1.86% Year-to-date Change: -19.7% | |
| WTBA Links: Profile News Message Board | |
| Charts:- Daily , Weekly | |
| Add WTBA to Watchlist: View: Get Complete WTBA Trend Analysis ➞ | |
 | PFIS Peoples Financial Services Corp. |
| Sector: Financials | |
| SubSector: Regional - Northeast Banks | |
| MarketCap: 305.499 Millions | |
| Recent Price: 38.99 Smart Investing & Trading Score: 74 | |
| Day Percent Change: 2.96% Day Change: 1.12 | |
| Week Change: 1.85% Year-to-date Change: -19.9% | |
| PFIS Links: Profile News Message Board | |
| Charts:- Daily , Weekly | |
| Add PFIS to Watchlist: View: Get Complete PFIS Trend Analysis ➞ | |
 | BOH Bank of Hawaii Corporation |
| Sector: Financials | |
| SubSector: Regional - Pacific Banks | |
| MarketCap: 2305.19 Millions | |
| Recent Price: 58.00 Smart Investing & Trading Score: 42 | |
| Day Percent Change: 2.31% Day Change: 1.31 | |
| Week Change: -1.07% Year-to-date Change: -20.0% | |
| BOH Links: Profile News Message Board | |
| Charts:- Daily , Weekly | |
| Add BOH to Watchlist: View: Get Complete BOH Trend Analysis ➞ | |
 | CUBI Customers Bancorp, Inc. |
| Sector: Financials | |
| SubSector: Regional - Northeast Banks | |
| MarketCap: 385.399 Millions | |
| Recent Price: 46.09 Smart Investing & Trading Score: 14 | |
| Day Percent Change: 0.92% Day Change: 0.42 | |
| Week Change: -1.56% Year-to-date Change: -20.0% | |
| CUBI Links: Profile News Message Board | |
| Charts:- Daily , Weekly | |
| Add CUBI to Watchlist: View: Get Complete CUBI Trend Analysis ➞ | |
 | FNLC The First Bancorp, Inc. |
| Sector: Financials | |
| SubSector: Regional - Northeast Banks | |
| MarketCap: 264.799 Millions | |
| Recent Price: 22.56 Smart Investing & Trading Score: 42 | |
| Day Percent Change: 2.15% Day Change: 0.48 | |
| Week Change: 0.02% Year-to-date Change: -20.1% | |
| FNLC Links: Profile News Message Board | |
| Charts:- Daily , Weekly | |
| Add FNLC to Watchlist: View: Get Complete FNLC Trend Analysis ➞ | |
 | STRS Stratus Properties Inc. |
| Sector: Financials | |
| SubSector: Real Estate Development | |
| MarketCap: 167.819 Millions | |
| Recent Price: 22.91 Smart Investing & Trading Score: 93 | |
| Day Percent Change: 1.01% Day Change: 0.23 | |
| Week Change: 0.66% Year-to-date Change: -20.6% | |
| STRS Links: Profile News Message Board | |
| Charts:- Daily , Weekly | |
| Add STRS to Watchlist: View: Get Complete STRS Trend Analysis ➞ | |
 | ARL American Realty Investors, Inc. |
| Sector: Financials | |
| SubSector: Property Management | |
| MarketCap: 132.242 Millions | |
| Recent Price: 13.78 Smart Investing & Trading Score: 17 | |
| Day Percent Change: -2.61% Day Change: -0.37 | |
| Week Change: -3.77% Year-to-date Change: -20.9% | |
| ARL Links: Profile News Message Board | |
| Charts:- Daily , Weekly | |
| Add ARL to Watchlist: View: Get Complete ARL Trend Analysis ➞ | |
 | CFFN Capitol Federal Financial, Inc. |
| Sector: Financials | |
| SubSector: Savings & Loans | |
| MarketCap: 1639.1 Millions | |
| Recent Price: 5.10 Smart Investing & Trading Score: 42 | |
| Day Percent Change: 6.92% Day Change: 0.33 | |
| Week Change: 6.03% Year-to-date Change: -20.9% | |
| CFFN Links: Profile News Message Board | |
| Charts:- Daily , Weekly | |
| Add CFFN to Watchlist: View: Get Complete CFFN Trend Analysis ➞ | |
 | AI C3.ai, Inc. |
| Sector: Financials | |
| SubSector: REIT Mortgage | |
| MarketCap: 12467 Millions | |
| Recent Price: 22.69 Smart Investing & Trading Score: 57 | |
| Day Percent Change: 0.71% Day Change: 0.16 | |
| Week Change: -0.61% Year-to-date Change: -21.0% | |
| AI Links: Profile News Message Board | |
| Charts:- Daily , Weekly | |
| Add AI to Watchlist: View: Get Complete AI Trend Analysis ➞ | |
 | CATY Cathay General Bancorp |
| Sector: Financials | |
| SubSector: Regional - Pacific Banks | |
| MarketCap: 1781.99 Millions | |
| Recent Price: 35.18 Smart Investing & Trading Score: 49 | |
| Day Percent Change: 2.15% Day Change: 0.74 | |
| Week Change: 0.4% Year-to-date Change: -21.1% | |
| CATY Links: Profile News Message Board | |
| Charts:- Daily , Weekly | |
| Add CATY to Watchlist: View: Get Complete CATY Trend Analysis ➞ | |
| For tabular summary view of above stock list: Summary View ➞ 0 - 25 , 25 - 50 , 50 - 75 , 75 - 100 , 100 - 125 , 125 - 150 , 150 - 175 , 175 - 200 , 200 - 225 , 225 - 250 , 250 - 275 , 275 - 300 , 300 - 325 , 325 - 350 , 350 - 375 , 375 - 400 | ||
| Click To Change The Sort Order: By Market Cap or Company Size Performance: Year-to-date, Week and Day | |
| Select Chart Type: | ||
| Too many stocks? View smallcap stocks filtered by marketcap & sector |
| Marketcap: All SmallCap Stocks (default-no microcap), Large, Mid-Range, Small & MicroCap |
| Sector: Tech, Finance, Energy, Staples, Retail, Industrial, Materials, Utilities & Medical |
|
Best Stocks Today 12Stocks.com |
© 2024 12Stocks.com Terms & Conditions Privacy Contact Us
All Information Provided Only For Education And Not To Be Used For Investing or Trading. See Terms & Conditions


One More Thing ... Get Best Stocks Delivered Daily!
Never Ever Miss A Move With Our Top Ten Stocks Lists
Find Best Stocks In Any Market - Bull or Bear Market
Take A Peek At Our Top Ten Stocks Lists: Daily, Weekly, Year-to-Date & Top Trends
Find Best Stocks In Any Market - Bull or Bear Market
Take A Peek At Our Top Ten Stocks Lists: Daily, Weekly, Year-to-Date & Top Trends
Smallcap Stocks With Best Up Trends [0-bearish to 100-bullish]: Surmodics [100], Rocky Brands[100], TransMedics Group[100], LendingClub [100], Summit [100], A10 s[100], Carpenter [100], UFP [100], PROCEPT BioRobotics[100], Xencor [100], Trinity Industries[100]
Best Smallcap Stocks Year-to-Date:
Janux [441.55%], Viking [310.69%], Longboard [259.25%], Alpine Immune[239.29%], Avidity Biosciences[185.4%], Bakkt [182.96%], Cullinan Oncology[175.33%], Arcutis Bio[173.68%], Vera [173.32%], Super Micro[159.73%], Y-mAbs [141.79%] Best Smallcap Stocks This Week:
Deciphera [73.11%], Eyenovia [45.65%], Cue Biopharma[39.56%], Seres [30.91%], Poseida [30.05%], P3 Health[29.62%], Phibro Animal[28.44%], TransMedics Group[27.72%], Surmodics [27.36%], LendingTree [26.36%], Rocky Brands[24.92%] Best Smallcap Stocks Daily:
Surmodics [29.74%], Rocky Brands[28.41%], TransMedics Group[24.93%], Ventyx Biosciences[24.63%], Eyenovia [21.84%], LendingClub [19.68%], Summit [19.59%], Powell Industries[18.89%], MiMedx Group[18.67%], CareDx [18.30%], A10 s[17.69%]