
 Login Sign Up


| |||||
 |  | ||||

| 12Stocks.com Market Intelligence |
Best SmallCap Stocks
|
| In a hurry? Small Cap Stock Lists: Performance Trends Table, Stock Charts
Sort Small Cap stocks: Daily, Weekly, Year-to-Date, Market Cap & Trends. Filter Small Cap stocks list by sector: Show all, Tech, Finance, Energy, Staples, Retail, Industrial, Materials, Utilities and HealthCare Filter Small Cap stocks list by size: All Large Medium Small and MicroCap |
| 12Stocks.com Small Cap Stocks Performances & Trends Daily | |||||||||
|
|  The overall Smart Investing & Trading Score is 56 (0-bearish to 100-bullish) which puts Small Cap index in short term neutral trend. The Smart Investing & Trading Score from previous trading session is 44 and hence an improvement of trend.
| ||||||||
Here are the Smart Investing & Trading Scores of the most requested small cap stocks at 12Stocks.com (click stock name for detailed review):
|


| 12Stocks.com: Investing in Smallcap Index with Stocks | |
|
The following table helps investors and traders sort through current performance and trends (as measured by Smart Investing & Trading Score) of various
stocks in the Smallcap Index. Quick View: Move mouse or cursor over stock symbol (ticker) to view short-term technical chart and over stock name to view long term chart. Click on  to add stock symbol to your watchlist and to add stock symbol to your watchlist and  to view watchlist. Click on any ticker or stock name for detailed market intelligence report for that stock. to view watchlist. Click on any ticker or stock name for detailed market intelligence report for that stock. |
12Stocks.com Performance of Stocks in Smallcap Index
| Ticker | Stock Name | Watchlist | Category | Recent Price | Smart Investing & Trading Score | Change % | YTD Change% |
| GAMB | Gambling.com Group |   | Services & Goods | 8.73 | 22 | -0.11 | -10.55% |
| ACRV | Acrivon | | Health Care | 8.46 | 51 | -0.12 | 70.22% |
| DXPE | DXP Enterprises | | Services & Goods | 50.90 | 68 | -0.14 | 51.04% |
| PARR | Par Pacific | | Energy | 32.41 | 10 | -0.15 | -10.89% |
| STHO | Star | | Financials | 11.72 | 53 | -0.17 | -21.84% |
| MHO | M/I Homes | | Industrials | 120.07 | 49 | -0.18 | -12.83% |
| RMNI | Rimini Street | | Technology | 2.80 | 25 | -0.18 | -14.37% |
| DCO | Ducommun | | Industrials | 53.94 | 93 | -0.20 | 3.61% |
| THFF | First Financial | | Financials | 36.86 | 67 | -0.22 | -14.34% |
| LE | Lands | | Services & Goods | 13.01 | 75 | -0.23 | 36.09% |
| IIIV | i3 Verticals | | Technology | 23.10 | 88 | -0.24 | 9.12% |
| MIRM | Mirum | | Health Care | 24.46 | 42 | -0.24 | -17.14% |
| GIII | G-III Apparel | | Consumer Staples | 28.42 | 47 | -0.28 | -16.36% |
| ATEN | A10 s | | Technology | 13.54 | 93 | -0.29 | 2.81% |
| FNKO | Funko | | Consumer Staples | 6.20 | 62 | -0.32 | -19.79% |
| QTRX | Quanterix | | Health Care | 15.56 | 10 | -0.32 | -43.09% |
| IPI | Intrepid Potash | | Materials | 19.53 | 53 | -0.36 | -18.25% |
| NDLS | Noodles & | | Services & Goods | 1.40 | 35 | -0.36 | -55.56% |
| PDLB | PDL Community | | Financials | 8.15 | 17 | -0.37 | -16.50% |
| SFST | Southern First | | Financials | 27.18 | 17 | -0.38 | -26.74% |
| CRNX | Crinetics | | Health Care | 42.12 | 31 | -0.38 | 18.38% |
| ACCO | ACCO Brands | | Consumer Staples | 4.83 | 17 | -0.41 | -20.56% |
| VLGEA | Village Super | | Services & Goods | 27.40 | 56 | -0.44 | 4.46% |
| FSBC | Five Star | | Financials | 21.75 | 17 | -0.46 | -16.92% |
| BHB | Bar Harbor | | Financials | 25.51 | 74 | -0.47 | -13.11% |
| For chart view version of above stock list: Chart View ➞ 0 - 25 , 25 - 50 , 50 - 75 , 75 - 100 , 100 - 125 , 125 - 150 , 150 - 175 , 175 - 200 , 200 - 225 , 225 - 250 , 250 - 275 , 275 - 300 , 300 - 325 , 325 - 350 , 350 - 375 , 375 - 400 , 400 - 425 , 425 - 450 , 450 - 475 , 475 - 500 , 500 - 525 | ||
 | Click To Change The Sort Order: By Market Cap or Company Size Performance: Year-to-date, Week and Day |  |
| Too many stocks? View smallcap stocks filtered by marketcap & sector |
| Marketcap: All SmallCap Stocks (default-no microcap), Large, Mid-Range, Small |
| Smallcap Sector: Tech, Finance, Energy, Staples, Retail, Industrial, Materials, & Medical |
|
Get the most comprehensive stock market coverage daily at 12Stocks.com ➞ Best Stocks Today ➞ Best Stocks Weekly ➞ Best Stocks Year-to-Date ➞ Best Stocks Trends ➞  Best Stocks Today 12Stocks.com Best Nasdaq Stocks ➞ Best S&P 500 Stocks ➞ Best Tech Stocks ➞ Best Biotech Stocks ➞ |
| Detailed Overview of SmallCap Stocks |
| SmallCap Technical Overview, Leaders & Laggards, Top SmallCap ETF Funds & Detailed SmallCap Stocks List, Charts, Trends & More |
| Smallcap: Technical Analysis, Trends & YTD Performance | |
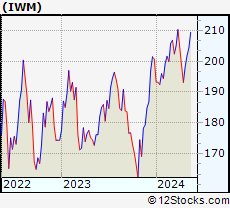
| SmallCap segment as represented by
IWM, an exchange-traded fund [ETF], holds basket of thousands of smallcap stocks from across all major sectors of the US stock market. The smallcap index (contains stocks like Riverbed & Sotheby's) is down by -1.16% and is currently underperforming the overall market by -7.3% year-to-date. Below is a quick view of technical charts and trends: | |
 IWM Weekly Chart |
|
| Long Term Trend: Good | |
| Medium Term Trend: Not Good | |
 IWM Daily Chart |
|
| Short Term Trend: Very Good | |
| Overall Trend Score: 56 | |
| YTD Performance: -1.16% | |
| **Trend Scores & Views Are Only For Educational Purposes And Not For Investing | |
| 12Stocks.com: Top Performing Small Cap Index Stocks | ||||||||||||||||||||||||||||||||||||||||||||||||
 The top performing Small Cap Index stocks year to date are
Now, more recently, over last week, the top performing Small Cap Index stocks on the move are


|
||||||||||||||||||||||||||||||||||||||||||||||||
| 12Stocks.com: Investing in Smallcap Index using Exchange Traded Funds | |
|
The following table shows list of key exchange traded funds (ETF) that
help investors track Smallcap index. The following list also includes leveraged ETF funds that track twice or thrice the daily returns of Smallcap indices. Short or inverse ETF funds move in the opposite direction to the index they track and are useful during market pullbacks or during bear markets. Quick View: Move mouse or cursor over ETF symbol (ticker) to view short-term technical chart and over ETF name to view long term chart. Click on ticker or stock name for detailed view. Click on to add stock symbol to your watchlist and to view watchlist. |
12Stocks.com List of ETFs that track Smallcap Index
| Ticker | ETF Name | Watchlist | Recent Price | Smart Investing & Trading Score | Change % | Week % | Year-to-date % |
| IWM | iShares Russell 2000 | | 198.39 | 56 | 0.97 | 2.72 | -1.16% |
| IJR | iShares Core S&P Small-Cap | | 105.65 | 75 | 0.75 | 2.35 | -2.4% |
| VTWO | Vanguard Russell 2000 ETF | | 80.22 | 63 | 0.97 | 2.74 | -1.09% |
| IWN | iShares Russell 2000 Value | | 151.14 | 68 | 0.64 | 2.27 | -2.7% |
| IWO | iShares Russell 2000 Growth | | 253.09 | 58 | 1.29 | 3.18 | 0.34% |
| IJS | iShares S&P Small-Cap 600 Value | | 97.19 | 60 | 0.52 | 1.65 | -5.7% |
| IJT | iShares S&P Small-Cap 600 Growth | | 126.09 | 70 | 0.82 | 3.17 | 0.76% |
| XSLV | PowerShares S&P SmallCap Low Volatil ETF | | 42.72 | 72 | 0.42 | 1.28 | -3.24% |
| SAA | ProShares Ultra SmallCap600 | | 23.04 | 80 | 1.68 | 5.69 | -7.66% |
| SBB | ProShares Short SmallCap600 | | 16.39 | 20 | -0.70 | -2.7 | 2.86% |
| SDD | ProShares UltraShort SmallCap600 | | 19.35 | 38 | -1.17 | -4.87 | 5.01% |
| SMLV | SPDR SSGA US Small Cap Low Volatil ETF | | 107.52 | 60 | 0.18 | 1.35 | -4.44% |
| 12Stocks.com: Charts, Trends, Fundamental Data and Performances of SmallCap Stocks | |
|
We now take in-depth look at all SmallCap stocks including charts, multi-period performances and overall trends (as measured by Smart Investing & Trading Score). One can sort SmallCap stocks (click link to choose) by Daily, Weekly and by Year-to-Date performances. Also, one can sort by size of the company or by market capitalization. |
| Select Your Default Chart Type: | |||||
| |||||
| Click on stock symbol or name for detailed view. Click on to add stock symbol to your watchlist and to view watchlist. Quick View: Move mouse or cursor over "Daily" to quickly view daily technical stock chart and over "Weekly" to view weekly technical stock chart. | |||||

 | GAMB Gambling.com Group Limited |
| Sector: Services & Goods | |
| SubSector: Gambling | |
| MarketCap: 376 Millions | |
| Recent Price: 8.73 Smart Investing & Trading Score: 22 | |
| Day Percent Change: -0.11% Day Change: -0.01 | |
| Week Change: 0.34% Year-to-date Change: -10.6% | |
| GAMB Links: Profile News Message Board | |
| Charts:- Daily , Weekly | |
| Add GAMB to Watchlist: View: Get Complete GAMB Trend Analysis ➞ | |
 | ACRV Acrivon Therapeutics, Inc. |
| Sector: Health Care | |
| SubSector: Biotechnology | |
| MarketCap: 286 Millions | |
| Recent Price: 8.46 Smart Investing & Trading Score: 51 | |
| Day Percent Change: -0.12% Day Change: -0.01 | |
| Week Change: -9.9% Year-to-date Change: 70.2% | |
| ACRV Links: Profile News Message Board | |
| Charts:- Daily , Weekly | |
| Add ACRV to Watchlist: View: Get Complete ACRV Trend Analysis ➞ | |
 | DXPE DXP Enterprises, Inc. |
| Sector: Services & Goods | |
| SubSector: Industrial Equipment Wholesale | |
| MarketCap: 243.758 Millions | |
| Recent Price: 50.90 Smart Investing & Trading Score: 68 | |
| Day Percent Change: -0.14% Day Change: -0.07 | |
| Week Change: 0.85% Year-to-date Change: 51.0% | |
| DXPE Links: Profile News Message Board | |
| Charts:- Daily , Weekly | |
| Add DXPE to Watchlist: View: Get Complete DXPE Trend Analysis ➞ | |
 | PARR Par Pacific Holdings, Inc. |
| Sector: Energy | |
| SubSector: Oil & Gas Refining & Marketing | |
| MarketCap: 443.154 Millions | |
| Recent Price: 32.41 Smart Investing & Trading Score: 10 | |
| Day Percent Change: -0.15% Day Change: -0.05 | |
| Week Change: 2.05% Year-to-date Change: -10.9% | |
| PARR Links: Profile News Message Board | |
| Charts:- Daily , Weekly | |
| Add PARR to Watchlist: View: Get Complete PARR Trend Analysis ➞ | |
 | STHO Star Holdings |
| Sector: Financials | |
| SubSector: Financials Services | |
| MarketCap: 195 Millions | |
| Recent Price: 11.72 Smart Investing & Trading Score: 53 | |
| Day Percent Change: -0.17% Day Change: -0.02 | |
| Week Change: -1.1% Year-to-date Change: -21.8% | |
| STHO Links: Profile News Message Board | |
| Charts:- Daily , Weekly | |
| Add STHO to Watchlist: View: Get Complete STHO Trend Analysis ➞ | |
 | MHO M/I Homes, Inc. |
| Sector: Industrials | |
| SubSector: Residential Construction | |
| MarketCap: 437.106 Millions | |
| Recent Price: 120.07 Smart Investing & Trading Score: 49 | |
| Day Percent Change: -0.18% Day Change: -0.22 | |
| Week Change: 8.08% Year-to-date Change: -12.8% | |
| MHO Links: Profile News Message Board | |
| Charts:- Daily , Weekly | |
| Add MHO to Watchlist: View: Get Complete MHO Trend Analysis ➞ | |
 | RMNI Rimini Street, Inc. |
| Sector: Technology | |
| SubSector: Application Software | |
| MarketCap: 288.762 Millions | |
| Recent Price: 2.80 Smart Investing & Trading Score: 25 | |
| Day Percent Change: -0.18% Day Change: -0.01 | |
| Week Change: -1.93% Year-to-date Change: -14.4% | |
| RMNI Links: Profile News Message Board | |
| Charts:- Daily , Weekly | |
| Add RMNI to Watchlist: View: Get Complete RMNI Trend Analysis ➞ | |
 | DCO Ducommun Incorporated |
| Sector: Industrials | |
| SubSector: Aerospace/Defense Products & Services | |
| MarketCap: 261.101 Millions | |
| Recent Price: 53.94 Smart Investing & Trading Score: 93 | |
| Day Percent Change: -0.20% Day Change: -0.11 | |
| Week Change: 3.69% Year-to-date Change: 3.6% | |
| DCO Links: Profile News Message Board | |
| Charts:- Daily , Weekly | |
| Add DCO to Watchlist: View: Get Complete DCO Trend Analysis ➞ | |
 | THFF First Financial Corporation |
| Sector: Financials | |
| SubSector: Regional - Midwest Banks | |
| MarketCap: 433.07 Millions | |
| Recent Price: 36.86 Smart Investing & Trading Score: 67 | |
| Day Percent Change: -0.22% Day Change: -0.08 | |
| Week Change: 0.68% Year-to-date Change: -14.3% | |
| THFF Links: Profile News Message Board | |
| Charts:- Daily , Weekly | |
| Add THFF to Watchlist: View: Get Complete THFF Trend Analysis ➞ | |
 | LE Lands End, Inc. |
| Sector: Services & Goods | |
| SubSector: Catalog & Mail Order Houses | |
| MarketCap: 268.692 Millions | |
| Recent Price: 13.01 Smart Investing & Trading Score: 75 | |
| Day Percent Change: -0.23% Day Change: -0.03 | |
| Week Change: 1.88% Year-to-date Change: 36.1% | |
| LE Links: Profile News Message Board | |
| Charts:- Daily , Weekly | |
| Add LE to Watchlist: View: Get Complete LE Trend Analysis ➞ | |
 | IIIV i3 Verticals, Inc. |
| Sector: Technology | |
| SubSector: Business Software & Services | |
| MarketCap: 448.458 Millions | |
| Recent Price: 23.10 Smart Investing & Trading Score: 88 | |
| Day Percent Change: -0.24% Day Change: -0.05 | |
| Week Change: 3.49% Year-to-date Change: 9.1% | |
| IIIV Links: Profile News Message Board | |
| Charts:- Daily , Weekly | |
| Add IIIV to Watchlist: View: Get Complete IIIV Trend Analysis ➞ | |
 | MIRM Mirum Pharmaceuticals, Inc. |
| Sector: Health Care | |
| SubSector: Biotechnology | |
| MarketCap: 309.585 Millions | |
| Recent Price: 24.46 Smart Investing & Trading Score: 42 | |
| Day Percent Change: -0.24% Day Change: -0.06 | |
| Week Change: 2.64% Year-to-date Change: -17.1% | |
| MIRM Links: Profile News Message Board | |
| Charts:- Daily , Weekly | |
| Add MIRM to Watchlist: View: Get Complete MIRM Trend Analysis ➞ | |
 | GIII G-III Apparel Group, Ltd. |
| Sector: Consumer Staples | |
| SubSector: Textile - Apparel Clothing | |
| MarketCap: 354.365 Millions | |
| Recent Price: 28.42 Smart Investing & Trading Score: 47 | |
| Day Percent Change: -0.28% Day Change: -0.08 | |
| Week Change: 2.82% Year-to-date Change: -16.4% | |
| GIII Links: Profile News Message Board | |
| Charts:- Daily , Weekly | |
| Add GIII to Watchlist: View: Get Complete GIII Trend Analysis ➞ | |
 | ATEN A10 Networks, Inc. |
| Sector: Technology | |
| SubSector: Communication Equipment | |
| MarketCap: 363.739 Millions | |
| Recent Price: 13.54 Smart Investing & Trading Score: 93 | |
| Day Percent Change: -0.29% Day Change: -0.04 | |
| Week Change: 4.64% Year-to-date Change: 2.8% | |
| ATEN Links: Profile News Message Board | |
| Charts:- Daily , Weekly | |
| Add ATEN to Watchlist: View: Get Complete ATEN Trend Analysis ➞ | |
 | FNKO Funko, Inc. |
| Sector: Consumer Staples | |
| SubSector: Toys & Games | |
| MarketCap: 246.38 Millions | |
| Recent Price: 6.20 Smart Investing & Trading Score: 62 | |
| Day Percent Change: -0.32% Day Change: -0.02 | |
| Week Change: 3.16% Year-to-date Change: -19.8% | |
| FNKO Links: Profile News Message Board | |
| Charts:- Daily , Weekly | |
| Add FNKO to Watchlist: View: Get Complete FNKO Trend Analysis ➞ | |
 | QTRX Quanterix Corporation |
| Sector: Health Care | |
| SubSector: Biotechnology | |
| MarketCap: 448.685 Millions | |
| Recent Price: 15.56 Smart Investing & Trading Score: 10 | |
| Day Percent Change: -0.32% Day Change: -0.05 | |
| Week Change: -1.77% Year-to-date Change: -43.1% | |
| QTRX Links: Profile News Message Board | |
| Charts:- Daily , Weekly | |
| Add QTRX to Watchlist: View: Get Complete QTRX Trend Analysis ➞ | |
 | IPI Intrepid Potash, Inc. |
| Sector: Materials | |
| SubSector: Agricultural Chemicals | |
| MarketCap: 160.329 Millions | |
| Recent Price: 19.53 Smart Investing & Trading Score: 53 | |
| Day Percent Change: -0.36% Day Change: -0.07 | |
| Week Change: -0.66% Year-to-date Change: -18.3% | |
| IPI Links: Profile News Message Board | |
| Charts:- Daily , Weekly | |
| Add IPI to Watchlist: View: Get Complete IPI Trend Analysis ➞ | |
 | NDLS Noodles & Company |
| Sector: Services & Goods | |
| SubSector: Restaurants | |
| MarketCap: 188.77 Millions | |
| Recent Price: 1.40 Smart Investing & Trading Score: 35 | |
| Day Percent Change: -0.36% Day Change: -0.01 | |
| Week Change: 17.65% Year-to-date Change: -55.6% | |
| NDLS Links: Profile News Message Board | |
| Charts:- Daily , Weekly | |
| Add NDLS to Watchlist: View: Get Complete NDLS Trend Analysis ➞ | |
 | PDLB PDL Community Bancorp |
| Sector: Financials | |
| SubSector: REIT - Retail | |
| MarketCap: 206.114 Millions | |
| Recent Price: 8.15 Smart Investing & Trading Score: 17 | |
| Day Percent Change: -0.37% Day Change: -0.03 | |
| Week Change: -2.4% Year-to-date Change: -16.5% | |
| PDLB Links: Profile News Message Board | |
| Charts:- Daily , Weekly | |
| Add PDLB to Watchlist: View: Get Complete PDLB Trend Analysis ➞ | |
 | SFST Southern First Bancshares, Inc. |
| Sector: Financials | |
| SubSector: Money Center Banks | |
| MarketCap: 189.099 Millions | |
| Recent Price: 27.18 Smart Investing & Trading Score: 17 | |
| Day Percent Change: -0.38% Day Change: -0.11 | |
| Week Change: -6.28% Year-to-date Change: -26.7% | |
| SFST Links: Profile News Message Board | |
| Charts:- Daily , Weekly | |
| Add SFST to Watchlist: View: Get Complete SFST Trend Analysis ➞ | |
 | CRNX Crinetics Pharmaceuticals, Inc. |
| Sector: Health Care | |
| SubSector: Biotechnology | |
| MarketCap: 381.085 Millions | |
| Recent Price: 42.12 Smart Investing & Trading Score: 31 | |
| Day Percent Change: -0.38% Day Change: -0.16 | |
| Week Change: -2% Year-to-date Change: 18.4% | |
| CRNX Links: Profile News Message Board | |
| Charts:- Daily , Weekly | |
| Add CRNX to Watchlist: View: Get Complete CRNX Trend Analysis ➞ | |
 | ACCO ACCO Brands Corporation |
| Sector: Consumer Staples | |
| SubSector: Office Supplies | |
| MarketCap: 448.2 Millions | |
| Recent Price: 4.83 Smart Investing & Trading Score: 17 | |
| Day Percent Change: -0.41% Day Change: -0.02 | |
| Week Change: -1.83% Year-to-date Change: -20.6% | |
| ACCO Links: Profile News Message Board | |
| Charts:- Daily , Weekly | |
| Add ACCO to Watchlist: View: Get Complete ACCO Trend Analysis ➞ | |
 | VLGEA Village Super Market, Inc. |
| Sector: Services & Goods | |
| SubSector: Grocery Stores | |
| MarketCap: 222.375 Millions | |
| Recent Price: 27.40 Smart Investing & Trading Score: 56 | |
| Day Percent Change: -0.44% Day Change: -0.12 | |
| Week Change: -0.54% Year-to-date Change: 4.5% | |
| VLGEA Links: Profile News Message Board | |
| Charts:- Daily , Weekly | |
| Add VLGEA to Watchlist: View: Get Complete VLGEA Trend Analysis ➞ | |
 | FSBC Five Star Bancorp |
| Sector: Financials | |
| SubSector: Banks - Regional | |
| MarketCap: 377 Millions | |
| Recent Price: 21.75 Smart Investing & Trading Score: 17 | |
| Day Percent Change: -0.46% Day Change: -0.10 | |
| Week Change: -0.87% Year-to-date Change: -16.9% | |
| FSBC Links: Profile News Message Board | |
| Charts:- Daily , Weekly | |
| Add FSBC to Watchlist: View: Get Complete FSBC Trend Analysis ➞ | |
 | BHB Bar Harbor Bankshares |
| Sector: Financials | |
| SubSector: Regional - Northeast Banks | |
| MarketCap: 298.099 Millions | |
| Recent Price: 25.51 Smart Investing & Trading Score: 74 | |
| Day Percent Change: -0.47% Day Change: -0.12 | |
| Week Change: 0.12% Year-to-date Change: -13.1% | |
| BHB Links: Profile News Message Board | |
| Charts:- Daily , Weekly | |
| Add BHB to Watchlist: View: Get Complete BHB Trend Analysis ➞ | |
| For tabular summary view of above stock list: Summary View ➞ 0 - 25 , 25 - 50 , 50 - 75 , 75 - 100 , 100 - 125 , 125 - 150 , 150 - 175 , 175 - 200 , 200 - 225 , 225 - 250 , 250 - 275 , 275 - 300 , 300 - 325 , 325 - 350 , 350 - 375 , 375 - 400 , 400 - 425 , 425 - 450 , 450 - 475 , 475 - 500 , 500 - 525 | ||
| Click To Change The Sort Order: By Market Cap or Company Size Performance: Year-to-date, Week and Day | |
| Select Chart Type: | ||
| Too many stocks? View smallcap stocks filtered by marketcap & sector |
| Marketcap: All SmallCap Stocks (default-no microcap), Large, Mid-Range, Small & MicroCap |
| Sector: Tech, Finance, Energy, Staples, Retail, Industrial, Materials, Utilities & Medical |
|
Best Stocks Today 12Stocks.com |
© 2024 12Stocks.com Terms & Conditions Privacy Contact Us
All Information Provided Only For Education And Not To Be Used For Investing or Trading. See Terms & Conditions


One More Thing ... Get Best Stocks Delivered Daily!
Never Ever Miss A Move With Our Top Ten Stocks Lists
Find Best Stocks In Any Market - Bull or Bear Market
Take A Peek At Our Top Ten Stocks Lists: Daily, Weekly, Year-to-Date & Top Trends
Find Best Stocks In Any Market - Bull or Bear Market
Take A Peek At Our Top Ten Stocks Lists: Daily, Weekly, Year-to-Date & Top Trends
Smallcap Stocks With Best Up Trends [0-bearish to 100-bullish]: Universal Logistics[100], Cullinan Oncology[100], Tutor Perini[100], Zura Bio[100], U.S. Silica[100], Exponent [100], NextNav [100], Solaris Oilfield[100], PTC [100], Rogers [100], Sonic Automotive[100]
Best Smallcap Stocks Year-to-Date:
CareMax [543.3%], Janux [341.65%], Viking [299.3%], Alpine Immune[239.08%], Longboard [222.75%], Super Micro[201.64%], Avidity Biosciences[169.47%], Arcutis Bio[162.23%], Vera [156.27%], Cullinan Oncology[148.16%], Hippo [139.52%] Best Smallcap Stocks This Week:
Matterport [170.98%], B. Riley[84.19%], Cullinan Oncology[61.56%], Seres [47.35%], Universal Logistics[36.84%], Tutor Perini[33.89%], Zura Bio[33.23%], Riot Blockchain[30.67%], IGM Biosciences[30.56%], Impinj [29.74%], Sonic Automotive[28.14%] Best Smallcap Stocks Daily:
Universal Logistics[39.37%], Cullinan Oncology[31.43%], Tutor Perini[28.01%], Zura Bio[26.72%], IGM Biosciences[23.36%], U.S. Silica[21.67%], Maxeon Solar[20.46%], Exponent [19.49%], TPI Composites[16.32%], OptimizeRx [15.07%], NextNav [13.97%]