
 Login Sign Up


| |||||
 |  | ||||

| 12Stocks.com Market Intelligence |
Best SmallCap Stocks
|
| In a hurry? Small Cap Stock Lists: Performance Trends Table, Stock Charts
Sort Small Cap stocks: Daily, Weekly, Year-to-Date, Market Cap & Trends. Filter Small Cap stocks list by sector: Show all, Tech, Finance, Energy, Staples, Retail, Industrial, Materials, Utilities and HealthCare Filter Small Cap stocks list by size: All Large Medium Small and MicroCap |
| 12Stocks.com Small Cap Stocks Performances & Trends Daily | |||||||||
|
|  The overall Smart Investing & Trading Score is 56 (0-bearish to 100-bullish) which puts Small Cap index in short term neutral trend. The Smart Investing & Trading Score from previous trading session is 44 and hence an improvement of trend.
| ||||||||
Here are the Smart Investing & Trading Scores of the most requested small cap stocks at 12Stocks.com (click stock name for detailed review):
|


| 12Stocks.com: Investing in Smallcap Index with Stocks | |
|
The following table helps investors and traders sort through current performance and trends (as measured by Smart Investing & Trading Score) of various
stocks in the Smallcap Index. Quick View: Move mouse or cursor over stock symbol (ticker) to view short-term technical chart and over stock name to view long term chart. Click on  to add stock symbol to your watchlist and to add stock symbol to your watchlist and  to view watchlist. Click on any ticker or stock name for detailed market intelligence report for that stock. to view watchlist. Click on any ticker or stock name for detailed market intelligence report for that stock. |
12Stocks.com Performance of Stocks in Smallcap Index
| Ticker | Stock Name | Watchlist | Category | Recent Price | Smart Investing & Trading Score | Change % | YTD Change% |
| UMH | UMH Properties |   | Financials | 15.66 | 83 | 0.19 | 2.22% |
| FLIC | First of Long Island | | Financials | 10.50 | 35 | 0.19 | -20.69% |
| ORRF | Orrstown Financial | | Financials | 26.48 | 69 | 0.19 | -10.24% |
| FLNG | Flex LNG | | Energy | 26.15 | 74 | 0.19 | -10.01% |
| COGT | Cogint | | Technology | 6.02 | 5 | 0.17 | 2.38% |
| MLR | Miller Industries | | Consumer Staples | 49.08 | 31 | 0.16 | 16.06% |
| EBF | Ennis | | Consumer Staples | 19.70 | 49 | 0.15 | -10.09% |
| SMMF | Summit Financial | | Financials | 27.45 | 74 | 0.15 | -10.56% |
| VPG | Vishay Precision | | Technology | 33.41 | 68 | 0.15 | -1.94% |
| HEES | H&E Equipment | | Transports | 58.65 | 58 | 0.14 | 12.10% |
| CTO | Consolidated-Tomoka Land | | Financials | 17.13 | 83 | 0.12 | -1.15% |
| PCYO | Pure Cycle | | Utilities | 9.50 | 27 | 0.11 | -9.26% |
| KE | Kimball Electronics | | Technology | 20.82 | 24 | 0.10 | -22.75% |
| MCFT | MasterCraft Boat | | Consumer Staples | 20.55 | 46 | 0.10 | -9.23% |
| ERII | Energy Recovery | | Industrials | 14.20 | 52 | 0.07 | -24.63% |
| FCBC | First Community | | Financials | 33.51 | 69 | 0.06 | -9.68% |
| HIBB | Hibbett Sports | | Services & Goods | 86.15 | 93 | 0.06 | 19.62% |
| BMRC | Bank of Marin Bancorp | | Financials | 15.44 | 57 | 0.06 | -29.88% |
| MYE | Myers Industries | | Consumer Staples | 22.04 | 75 | 0.05 | 12.74% |
| HAYN | Haynes | | Industrials | 60.31 | 68 | 0.05 | 5.71% |
| MTDR | Matador Resources | | Energy | 65.61 | 61 | 0.05 | 15.39% |
| BLBD | Blue Bird | | Consumer Staples | 33.97 | 31 | 0.01 | 26.00% |
| GCI | Gannett Co | | Services & Goods | 2.58 | 68 | 0.00 | 12.17% |
| PRST | Presto Automation | | Technology | 0.17 | 27 | 0.00 | -68.04% |
| CCO | Clear Channel | | Services & Goods | 1.44 | 17 | 0.00 | -20.88% |
| For chart view version of above stock list: Chart View ➞ 0 - 25 , 25 - 50 , 50 - 75 , 75 - 100 , 100 - 125 , 125 - 150 , 150 - 175 , 175 - 200 , 200 - 225 , 225 - 250 , 250 - 275 , 275 - 300 , 300 - 325 , 325 - 350 , 350 - 375 , 375 - 400 , 400 - 425 , 425 - 450 , 450 - 475 , 475 - 500 , 500 - 525 | ||
 | Click To Change The Sort Order: By Market Cap or Company Size Performance: Year-to-date, Week and Day |  |
| Too many stocks? View smallcap stocks filtered by marketcap & sector |
| Marketcap: All SmallCap Stocks (default-no microcap), Large, Mid-Range, Small |
| Smallcap Sector: Tech, Finance, Energy, Staples, Retail, Industrial, Materials, & Medical |
|
Get the most comprehensive stock market coverage daily at 12Stocks.com ➞ Best Stocks Today ➞ Best Stocks Weekly ➞ Best Stocks Year-to-Date ➞ Best Stocks Trends ➞  Best Stocks Today 12Stocks.com Best Nasdaq Stocks ➞ Best S&P 500 Stocks ➞ Best Tech Stocks ➞ Best Biotech Stocks ➞ |
| Detailed Overview of SmallCap Stocks |
| SmallCap Technical Overview, Leaders & Laggards, Top SmallCap ETF Funds & Detailed SmallCap Stocks List, Charts, Trends & More |
| Smallcap: Technical Analysis, Trends & YTD Performance | |
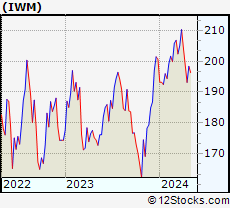
| SmallCap segment as represented by
IWM, an exchange-traded fund [ETF], holds basket of thousands of smallcap stocks from across all major sectors of the US stock market. The smallcap index (contains stocks like Riverbed & Sotheby's) is down by -1.16% and is currently underperforming the overall market by -7.3% year-to-date. Below is a quick view of technical charts and trends: | |
 IWM Weekly Chart |
|
| Long Term Trend: Good | |
| Medium Term Trend: Not Good | |
 IWM Daily Chart |
|
| Short Term Trend: Very Good | |
| Overall Trend Score: 56 | |
| YTD Performance: -1.16% | |
| **Trend Scores & Views Are Only For Educational Purposes And Not For Investing | |
| 12Stocks.com: Top Performing Small Cap Index Stocks | ||||||||||||||||||||||||||||||||||||||||||||||||
 The top performing Small Cap Index stocks year to date are
Now, more recently, over last week, the top performing Small Cap Index stocks on the move are


|
||||||||||||||||||||||||||||||||||||||||||||||||
| 12Stocks.com: Investing in Smallcap Index using Exchange Traded Funds | |
|
The following table shows list of key exchange traded funds (ETF) that
help investors track Smallcap index. The following list also includes leveraged ETF funds that track twice or thrice the daily returns of Smallcap indices. Short or inverse ETF funds move in the opposite direction to the index they track and are useful during market pullbacks or during bear markets. Quick View: Move mouse or cursor over ETF symbol (ticker) to view short-term technical chart and over ETF name to view long term chart. Click on ticker or stock name for detailed view. Click on to add stock symbol to your watchlist and to view watchlist. |
12Stocks.com List of ETFs that track Smallcap Index
| Ticker | ETF Name | Watchlist | Recent Price | Smart Investing & Trading Score | Change % | Week % | Year-to-date % |
| IWM | iShares Russell 2000 | | 198.39 | 56 | 0.97 | 2.72 | -1.16% |
| IJR | iShares Core S&P Small-Cap | | 105.65 | 75 | 0.75 | 2.35 | -2.4% |
| VTWO | Vanguard Russell 2000 ETF | | 80.22 | 63 | 0.97 | 2.74 | -1.09% |
| IWN | iShares Russell 2000 Value | | 151.14 | 68 | 0.64 | 2.27 | -2.7% |
| IWO | iShares Russell 2000 Growth | | 253.09 | 58 | 1.29 | 3.18 | 0.34% |
| IJS | iShares S&P Small-Cap 600 Value | | 97.19 | 60 | 0.52 | 1.65 | -5.7% |
| IJT | iShares S&P Small-Cap 600 Growth | | 126.09 | 70 | 0.82 | 3.17 | 0.76% |
| XSLV | PowerShares S&P SmallCap Low Volatil ETF | | 42.72 | 72 | 0.42 | 1.28 | -3.24% |
| SAA | ProShares Ultra SmallCap600 | | 23.04 | 80 | 1.68 | 5.69 | -7.66% |
| SBB | ProShares Short SmallCap600 | | 16.39 | 20 | -0.70 | -2.7 | 2.86% |
| SDD | ProShares UltraShort SmallCap600 | | 19.35 | 38 | -1.17 | -4.87 | 5.01% |
| SMLV | SPDR SSGA US Small Cap Low Volatil ETF | | 107.52 | 60 | 0.18 | 1.35 | -4.44% |
| 12Stocks.com: Charts, Trends, Fundamental Data and Performances of SmallCap Stocks | |
|
We now take in-depth look at all SmallCap stocks including charts, multi-period performances and overall trends (as measured by Smart Investing & Trading Score). One can sort SmallCap stocks (click link to choose) by Daily, Weekly and by Year-to-Date performances. Also, one can sort by size of the company or by market capitalization. |
| Select Your Default Chart Type: | |||||
| |||||
| Click on stock symbol or name for detailed view. Click on to add stock symbol to your watchlist and to view watchlist. Quick View: Move mouse or cursor over "Daily" to quickly view daily technical stock chart and over "Weekly" to view weekly technical stock chart. | |||||

 | UMH UMH Properties, Inc. |
| Sector: Financials | |
| SubSector: REIT - Diversified | |
| MarketCap: 433.353 Millions | |
| Recent Price: 15.66 Smart Investing & Trading Score: 83 | |
| Day Percent Change: 0.19% Day Change: 0.03 | |
| Week Change: 1.89% Year-to-date Change: 2.2% | |
| UMH Links: Profile News Message Board | |
| Charts:- Daily , Weekly | |
| Add UMH to Watchlist: View: Get Complete UMH Trend Analysis ➞ | |
 | FLIC The First of Long Island Corporation |
| Sector: Financials | |
| SubSector: Regional - Northeast Banks | |
| MarketCap: 352.899 Millions | |
| Recent Price: 10.50 Smart Investing & Trading Score: 35 | |
| Day Percent Change: 0.19% Day Change: 0.02 | |
| Week Change: 0.57% Year-to-date Change: -20.7% | |
| FLIC Links: Profile News Message Board | |
| Charts:- Daily , Weekly | |
| Add FLIC to Watchlist: View: Get Complete FLIC Trend Analysis ➞ | |
 | ORRF Orrstown Financial Services, Inc. |
| Sector: Financials | |
| SubSector: Regional - Northeast Banks | |
| MarketCap: 159.999 Millions | |
| Recent Price: 26.48 Smart Investing & Trading Score: 69 | |
| Day Percent Change: 0.19% Day Change: 0.05 | |
| Week Change: 2% Year-to-date Change: -10.2% | |
| ORRF Links: Profile News Message Board | |
| Charts:- Daily , Weekly | |
| Add ORRF to Watchlist: View: Get Complete ORRF Trend Analysis ➞ | |
 | FLNG Flex LNG Ltd. |
| Sector: Energy | |
| SubSector: Oil & Gas Equipment & Services | |
| MarketCap: 220.261 Millions | |
| Recent Price: 26.15 Smart Investing & Trading Score: 74 | |
| Day Percent Change: 0.19% Day Change: 0.05 | |
| Week Change: 1.4% Year-to-date Change: -10.0% | |
| FLNG Links: Profile News Message Board | |
| Charts:- Daily , Weekly | |
| Add FLNG to Watchlist: View: Get Complete FLNG Trend Analysis ➞ | |
 | COGT Cogint, Inc. |
| Sector: Technology | |
| SubSector: Business Software & Services | |
| MarketCap: 214.55 Millions | |
| Recent Price: 6.02 Smart Investing & Trading Score: 5 | |
| Day Percent Change: 0.17% Day Change: 0.01 | |
| Week Change: -10.28% Year-to-date Change: 2.4% | |
| COGT Links: Profile News Message Board | |
| Charts:- Daily , Weekly | |
| Add COGT to Watchlist: View: Get Complete COGT Trend Analysis ➞ | |
 | MLR Miller Industries, Inc. |
| Sector: Consumer Staples | |
| SubSector: Auto Parts | |
| MarketCap: 335.239 Millions | |
| Recent Price: 49.08 Smart Investing & Trading Score: 31 | |
| Day Percent Change: 0.16% Day Change: 0.08 | |
| Week Change: -0.22% Year-to-date Change: 16.1% | |
| MLR Links: Profile News Message Board | |
| Charts:- Daily , Weekly | |
| Add MLR to Watchlist: View: Get Complete MLR Trend Analysis ➞ | |
 | EBF Ennis, Inc. |
| Sector: Consumer Staples | |
| SubSector: Office Supplies | |
| MarketCap: 464.5 Millions | |
| Recent Price: 19.70 Smart Investing & Trading Score: 49 | |
| Day Percent Change: 0.15% Day Change: 0.03 | |
| Week Change: 1.39% Year-to-date Change: -10.1% | |
| EBF Links: Profile News Message Board | |
| Charts:- Daily , Weekly | |
| Add EBF to Watchlist: View: Get Complete EBF Trend Analysis ➞ | |
 | SMMF Summit Financial Group, Inc. |
| Sector: Financials | |
| SubSector: Regional - Mid-Atlantic Banks | |
| MarketCap: 228.959 Millions | |
| Recent Price: 27.45 Smart Investing & Trading Score: 74 | |
| Day Percent Change: 0.15% Day Change: 0.04 | |
| Week Change: 0.92% Year-to-date Change: -10.6% | |
| SMMF Links: Profile News Message Board | |
| Charts:- Daily , Weekly | |
| Add SMMF to Watchlist: View: Get Complete SMMF Trend Analysis ➞ | |
 | VPG Vishay Precision Group, Inc. |
| Sector: Technology | |
| SubSector: Scientific & Technical Instruments | |
| MarketCap: 261.553 Millions | |
| Recent Price: 33.41 Smart Investing & Trading Score: 68 | |
| Day Percent Change: 0.15% Day Change: 0.05 | |
| Week Change: 0.42% Year-to-date Change: -1.9% | |
| VPG Links: Profile News Message Board | |
| Charts:- Daily , Weekly | |
| Add VPG to Watchlist: View: Get Complete VPG Trend Analysis ➞ | |
 | HEES H&E Equipment Services, Inc. |
| Sector: Transports | |
| SubSector: Rental & Leasing Services | |
| MarketCap: 451.944 Millions | |
| Recent Price: 58.65 Smart Investing & Trading Score: 58 | |
| Day Percent Change: 0.14% Day Change: 0.08 | |
| Week Change: 0.62% Year-to-date Change: 12.1% | |
| HEES Links: Profile News Message Board | |
| Charts:- Daily , Weekly | |
| Add HEES to Watchlist: View: Get Complete HEES Trend Analysis ➞ | |
 | CTO Consolidated-Tomoka Land Co. |
| Sector: Financials | |
| SubSector: Real Estate Development | |
| MarketCap: 205.119 Millions | |
| Recent Price: 17.13 Smart Investing & Trading Score: 83 | |
| Day Percent Change: 0.12% Day Change: 0.02 | |
| Week Change: 0.88% Year-to-date Change: -1.2% | |
| CTO Links: Profile News Message Board | |
| Charts:- Daily , Weekly | |
| Add CTO to Watchlist: View: Get Complete CTO Trend Analysis ➞ | |
 | PCYO Pure Cycle Corporation |
| Sector: Utilities | |
| SubSector: Water Utilities | |
| MarketCap: 247.102 Millions | |
| Recent Price: 9.50 Smart Investing & Trading Score: 27 | |
| Day Percent Change: 0.11% Day Change: 0.01 | |
| Week Change: -0.31% Year-to-date Change: -9.3% | |
| PCYO Links: Profile News Message Board | |
| Charts:- Daily , Weekly | |
| Add PCYO to Watchlist: View: Get Complete PCYO Trend Analysis ➞ | |
 | KE Kimball Electronics, Inc. |
| Sector: Technology | |
| SubSector: Diversified Electronics | |
| MarketCap: 308.896 Millions | |
| Recent Price: 20.82 Smart Investing & Trading Score: 24 | |
| Day Percent Change: 0.10% Day Change: 0.02 | |
| Week Change: 0.19% Year-to-date Change: -22.8% | |
| KE Links: Profile News Message Board | |
| Charts:- Daily , Weekly | |
| Add KE to Watchlist: View: Get Complete KE Trend Analysis ➞ | |
 | MCFT MasterCraft Boat Holdings, Inc. |
| Sector: Consumer Staples | |
| SubSector: Recreational Vehicles | |
| MarketCap: 152.059 Millions | |
| Recent Price: 20.55 Smart Investing & Trading Score: 46 | |
| Day Percent Change: 0.10% Day Change: 0.02 | |
| Week Change: -2.61% Year-to-date Change: -9.2% | |
| MCFT Links: Profile News Message Board | |
| Charts:- Daily , Weekly | |
| Add MCFT to Watchlist: View: Get Complete MCFT Trend Analysis ➞ | |
 | ERII Energy Recovery, Inc. |
| Sector: Industrials | |
| SubSector: Pollution & Treatment Controls | |
| MarketCap: 429.375 Millions | |
| Recent Price: 14.20 Smart Investing & Trading Score: 52 | |
| Day Percent Change: 0.07% Day Change: 0.01 | |
| Week Change: 3.57% Year-to-date Change: -24.6% | |
| ERII Links: Profile News Message Board | |
| Charts:- Daily , Weekly | |
| Add ERII to Watchlist: View: Get Complete ERII Trend Analysis ➞ | |
 | FCBC First Community Bankshares, Inc. |
| Sector: Financials | |
| SubSector: Regional - Mid-Atlantic Banks | |
| MarketCap: 393.459 Millions | |
| Recent Price: 33.51 Smart Investing & Trading Score: 69 | |
| Day Percent Change: 0.06% Day Change: 0.02 | |
| Week Change: 1.24% Year-to-date Change: -9.7% | |
| FCBC Links: Profile News Message Board | |
| Charts:- Daily , Weekly | |
| Add FCBC to Watchlist: View: Get Complete FCBC Trend Analysis ➞ | |
 | HIBB Hibbett Sports, Inc. |
| Sector: Services & Goods | |
| SubSector: Sporting Goods Stores | |
| MarketCap: 183 Millions | |
| Recent Price: 86.15 Smart Investing & Trading Score: 93 | |
| Day Percent Change: 0.06% Day Change: 0.05 | |
| Week Change: 21.1% Year-to-date Change: 19.6% | |
| HIBB Links: Profile News Message Board | |
| Charts:- Daily , Weekly | |
| Add HIBB to Watchlist: View: Get Complete HIBB Trend Analysis ➞ | |
 | BMRC Bank of Marin Bancorp |
| Sector: Financials | |
| SubSector: Regional - Pacific Banks | |
| MarketCap: 367.929 Millions | |
| Recent Price: 15.44 Smart Investing & Trading Score: 57 | |
| Day Percent Change: 0.06% Day Change: 0.01 | |
| Week Change: -0.52% Year-to-date Change: -29.9% | |
| BMRC Links: Profile News Message Board | |
| Charts:- Daily , Weekly | |
| Add BMRC to Watchlist: View: Get Complete BMRC Trend Analysis ➞ | |
 | MYE Myers Industries, Inc. |
| Sector: Consumer Staples | |
| SubSector: Rubber & Plastics | |
| MarketCap: 347.57 Millions | |
| Recent Price: 22.04 Smart Investing & Trading Score: 75 | |
| Day Percent Change: 0.05% Day Change: 0.01 | |
| Week Change: 2.18% Year-to-date Change: 12.7% | |
| MYE Links: Profile News Message Board | |
| Charts:- Daily , Weekly | |
| Add MYE to Watchlist: View: Get Complete MYE Trend Analysis ➞ | |
 | HAYN Haynes International, Inc. |
| Sector: Industrials | |
| SubSector: Metal Fabrication | |
| MarketCap: 245.75 Millions | |
| Recent Price: 60.31 Smart Investing & Trading Score: 68 | |
| Day Percent Change: 0.05% Day Change: 0.03 | |
| Week Change: 0.1% Year-to-date Change: 5.7% | |
| HAYN Links: Profile News Message Board | |
| Charts:- Daily , Weekly | |
| Add HAYN to Watchlist: View: Get Complete HAYN Trend Analysis ➞ | |
 | MTDR Matador Resources Company |
| Sector: Energy | |
| SubSector: Independent Oil & Gas | |
| MarketCap: 196.593 Millions | |
| Recent Price: 65.61 Smart Investing & Trading Score: 61 | |
| Day Percent Change: 0.05% Day Change: 0.03 | |
| Week Change: 1.55% Year-to-date Change: 15.4% | |
| MTDR Links: Profile News Message Board | |
| Charts:- Daily , Weekly | |
| Add MTDR to Watchlist: View: Get Complete MTDR Trend Analysis ➞ | |
 | BLBD Blue Bird Corporation |
| Sector: Consumer Staples | |
| SubSector: Auto Manufacturers - Major | |
| MarketCap: 345.371 Millions | |
| Recent Price: 33.97 Smart Investing & Trading Score: 31 | |
| Day Percent Change: 0.01% Day Change: 0.00 | |
| Week Change: 0.09% Year-to-date Change: 26.0% | |
| BLBD Links: Profile News Message Board | |
| Charts:- Daily , Weekly | |
| Add BLBD to Watchlist: View: Get Complete BLBD Trend Analysis ➞ | |
 | GCI Gannett Co., Inc. |
| Sector: Services & Goods | |
| SubSector: Publishing - Newspapers | |
| MarketCap: 222.322 Millions | |
| Recent Price: 2.58 Smart Investing & Trading Score: 68 | |
| Day Percent Change: 0.00% Day Change: 0.00 | |
| Week Change: -0.77% Year-to-date Change: 12.2% | |
| GCI Links: Profile News Message Board | |
| Charts:- Daily , Weekly | |
| Add GCI to Watchlist: View: Get Complete GCI Trend Analysis ➞ | |
 | PRST Presto Automation Inc. |
| Sector: Technology | |
| SubSector: Software - Application | |
| MarketCap: 238 Millions | |
| Recent Price: 0.17 Smart Investing & Trading Score: 27 | |
| Day Percent Change: 0.00% Day Change: 0.00 | |
| Week Change: 0.54% Year-to-date Change: -68.0% | |
| PRST Links: Profile News Message Board | |
| Charts:- Daily , Weekly | |
| Add PRST to Watchlist: View: Get Complete PRST Trend Analysis ➞ | |
 | CCO Clear Channel Outdoor Holdings, Inc. |
| Sector: Services & Goods | |
| SubSector: Marketing Services | |
| MarketCap: 312.715 Millions | |
| Recent Price: 1.44 Smart Investing & Trading Score: 17 | |
| Day Percent Change: 0.00% Day Change: 0.00 | |
| Week Change: -3.36% Year-to-date Change: -20.9% | |
| CCO Links: Profile News Message Board | |
| Charts:- Daily , Weekly | |
| Add CCO to Watchlist: View: Get Complete CCO Trend Analysis ➞ | |
| For tabular summary view of above stock list: Summary View ➞ 0 - 25 , 25 - 50 , 50 - 75 , 75 - 100 , 100 - 125 , 125 - 150 , 150 - 175 , 175 - 200 , 200 - 225 , 225 - 250 , 250 - 275 , 275 - 300 , 300 - 325 , 325 - 350 , 350 - 375 , 375 - 400 , 400 - 425 , 425 - 450 , 450 - 475 , 475 - 500 , 500 - 525 | ||
| Click To Change The Sort Order: By Market Cap or Company Size Performance: Year-to-date, Week and Day | |
| Select Chart Type: | ||
| Too many stocks? View smallcap stocks filtered by marketcap & sector |
| Marketcap: All SmallCap Stocks (default-no microcap), Large, Mid-Range, Small & MicroCap |
| Sector: Tech, Finance, Energy, Staples, Retail, Industrial, Materials, Utilities & Medical |
|
Best Stocks Today 12Stocks.com |
© 2024 12Stocks.com Terms & Conditions Privacy Contact Us
All Information Provided Only For Education And Not To Be Used For Investing or Trading. See Terms & Conditions


One More Thing ... Get Best Stocks Delivered Daily!
Never Ever Miss A Move With Our Top Ten Stocks Lists
Find Best Stocks In Any Market - Bull or Bear Market
Take A Peek At Our Top Ten Stocks Lists: Daily, Weekly, Year-to-Date & Top Trends
Find Best Stocks In Any Market - Bull or Bear Market
Take A Peek At Our Top Ten Stocks Lists: Daily, Weekly, Year-to-Date & Top Trends
Smallcap Stocks With Best Up Trends [0-bearish to 100-bullish]: Universal Logistics[100], Cullinan Oncology[100], Tutor Perini[100], Zura Bio[100], U.S. Silica[100], Exponent [100], NextNav [100], Solaris Oilfield[100], PTC [100], Rogers [100], Sonic Automotive[100]
Best Smallcap Stocks Year-to-Date:
CareMax [543.3%], Janux [341.65%], Viking [299.3%], Alpine Immune[239.08%], Longboard [222.75%], Super Micro[201.64%], Avidity Biosciences[169.47%], Arcutis Bio[162.23%], Vera [156.27%], Cullinan Oncology[148.16%], Hippo [139.52%] Best Smallcap Stocks This Week:
Matterport [170.98%], B. Riley[84.19%], Cullinan Oncology[61.56%], Seres [47.35%], Universal Logistics[36.84%], Tutor Perini[33.89%], Zura Bio[33.23%], Riot Blockchain[30.67%], IGM Biosciences[30.56%], Impinj [29.74%], Sonic Automotive[28.14%] Best Smallcap Stocks Daily:
Universal Logistics[39.37%], Cullinan Oncology[31.43%], Tutor Perini[28.01%], Zura Bio[26.72%], IGM Biosciences[23.36%], U.S. Silica[21.67%], Maxeon Solar[20.46%], Exponent [19.49%], TPI Composites[16.32%], OptimizeRx [15.07%], NextNav [13.97%]