
 Login Sign Up


| |||||
 |  | ||||

| 12Stocks.com Market Intelligence |
Best SmallCap Stocks
|
| In a hurry? Small Cap Stock Lists: Performance Trends Table, Stock Charts
Sort Small Cap stocks: Daily, Weekly, Year-to-Date, Market Cap & Trends. Filter Small Cap stocks list by sector: Show all, Tech, Finance, Energy, Staples, Retail, Industrial, Materials, Utilities and HealthCare Filter Small Cap stocks list by size: All Large Medium Small and MicroCap |
| 12Stocks.com Small Cap Stocks Performances & Trends Daily | |||||||||
|
|  The overall Smart Investing & Trading Score is 56 (0-bearish to 100-bullish) which puts Small Cap index in short term neutral trend. The Smart Investing & Trading Score from previous trading session is 44 and hence an improvement of trend.
| ||||||||
Here are the Smart Investing & Trading Scores of the most requested small cap stocks at 12Stocks.com (click stock name for detailed review):
|


| 12Stocks.com: Investing in Smallcap Index with Stocks | |
|
The following table helps investors and traders sort through current performance and trends (as measured by Smart Investing & Trading Score) of various
stocks in the Smallcap Index. Quick View: Move mouse or cursor over stock symbol (ticker) to view short-term technical chart and over stock name to view long term chart. Click on  to add stock symbol to your watchlist and to add stock symbol to your watchlist and  to view watchlist. Click on any ticker or stock name for detailed market intelligence report for that stock. to view watchlist. Click on any ticker or stock name for detailed market intelligence report for that stock. |
12Stocks.com Performance of Stocks in Smallcap Index
| Ticker | Stock Name | Watchlist | Category | Recent Price | Smart Investing & Trading Score | Change % | YTD Change% |
| TALO | Talos Energy |   | Energy | 13.94 | 73 | 1.16 | -2.04% |
| BLFY | Blue Foundry | | Financials | 8.78 | 67 | 1.15 | -8.83% |
| OSUR | OraSure | | Health Care | 5.32 | 20 | 1.14 | -35.12% |
| FORR | Forrester Research | | Services & Goods | 18.77 | 37 | 1.13 | -29.99% |
| GPRE | Green Plains | | Materials | 21.40 | 43 | 1.13 | -15.15% |
| EGAN | eGain | | Technology | 6.25 | 49 | 1.13 | -24.97% |
| EBTC | Enterprise Bancorp | | Financials | 24.90 | 64 | 1.12 | -22.81% |
| NSSC | Napco Security | | Services & Goods | 43.86 | 100 | 1.11 | 28.06% |
| NEWT | Newtek Business | | Services & Goods | 11.00 | 52 | 1.10 | -20.29% |
| HWKN | Hawkins | | Materials | 75.78 | 41 | 1.05 | 7.61% |
| CEIX | CONSOL Energy | | Materials | 85.73 | 57 | 1.05 | -14.72% |
| TGAN | Transphorm | | Technology | 4.86 | 45 | 1.04 | 32.61% |
| FISI | Financial Institutions | | Financials | 17.60 | 59 | 1.03 | -17.37% |
| NWPX | Northwest Pipe | | Materials | 31.81 | 53 | 1.02 | 5.12% |
| LEGH | Legacy Housing | | Industrials | 20.30 | 42 | 1.00 | -19.51% |
| AMSWA | American | | Technology | 10.22 | 17 | 0.99 | -9.56% |
| INN | Summit Hotel | | Financials | 6.13 | 10 | 0.99 | -8.78% |
| VRA | Vera Bradley | | Consumer Staples | 6.75 | 57 | 0.97 | -12.40% |
| SXC | SunCoke Energy | | Materials | 10.57 | 43 | 0.96 | -1.58% |
| EFC | Ellington Financial | | Financials | 11.71 | 74 | 0.95 | -7.87% |
| IRMD | IRadimed | | Health Care | 41.86 | 55 | 0.94 | -11.82% |
| KRT | Karat Packaging | | Services & Goods | 27.31 | 58 | 0.92 | 9.63% |
| PLPC | Preformed Line | | Industrials | 124.71 | 70 | 0.91 | -6.84% |
| BRY | Berry | | Energy | 8.74 | 88 | 0.87 | 24.32% |
| PFIS | Peoples Financial | | Financials | 38.28 | 27 | 0.87 | -21.40% |
| For chart view version of above stock list: Chart View ➞ 0 - 25 , 25 - 50 , 50 - 75 , 75 - 100 , 100 - 125 , 125 - 150 , 150 - 175 , 175 - 200 , 200 - 225 , 225 - 250 , 250 - 275 , 275 - 300 , 300 - 325 , 325 - 350 , 350 - 375 , 375 - 400 , 400 - 425 , 425 - 450 , 450 - 475 , 475 - 500 , 500 - 525 | ||
 | Click To Change The Sort Order: By Market Cap or Company Size Performance: Year-to-date, Week and Day |  |
| Too many stocks? View smallcap stocks filtered by marketcap & sector |
| Marketcap: All SmallCap Stocks (default-no microcap), Large, Mid-Range, Small |
| Smallcap Sector: Tech, Finance, Energy, Staples, Retail, Industrial, Materials, & Medical |
|
Get the most comprehensive stock market coverage daily at 12Stocks.com ➞ Best Stocks Today ➞ Best Stocks Weekly ➞ Best Stocks Year-to-Date ➞ Best Stocks Trends ➞  Best Stocks Today 12Stocks.com Best Nasdaq Stocks ➞ Best S&P 500 Stocks ➞ Best Tech Stocks ➞ Best Biotech Stocks ➞ |
| Detailed Overview of SmallCap Stocks |
| SmallCap Technical Overview, Leaders & Laggards, Top SmallCap ETF Funds & Detailed SmallCap Stocks List, Charts, Trends & More |
| Smallcap: Technical Analysis, Trends & YTD Performance | |
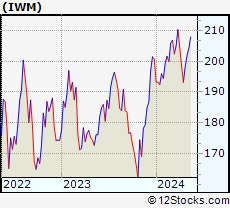
| SmallCap segment as represented by
IWM, an exchange-traded fund [ETF], holds basket of thousands of smallcap stocks from across all major sectors of the US stock market. The smallcap index (contains stocks like Riverbed & Sotheby's) is down by -1.16% and is currently underperforming the overall market by -7.3% year-to-date. Below is a quick view of technical charts and trends: | |
 IWM Weekly Chart |
|
| Long Term Trend: Good | |
| Medium Term Trend: Not Good | |
 IWM Daily Chart |
|
| Short Term Trend: Very Good | |
| Overall Trend Score: 56 | |
| YTD Performance: -1.16% | |
| **Trend Scores & Views Are Only For Educational Purposes And Not For Investing | |
| 12Stocks.com: Top Performing Small Cap Index Stocks | ||||||||||||||||||||||||||||||||||||||||||||||||
 The top performing Small Cap Index stocks year to date are
Now, more recently, over last week, the top performing Small Cap Index stocks on the move are


|
||||||||||||||||||||||||||||||||||||||||||||||||
| 12Stocks.com: Investing in Smallcap Index using Exchange Traded Funds | |
|
The following table shows list of key exchange traded funds (ETF) that
help investors track Smallcap index. The following list also includes leveraged ETF funds that track twice or thrice the daily returns of Smallcap indices. Short or inverse ETF funds move in the opposite direction to the index they track and are useful during market pullbacks or during bear markets. Quick View: Move mouse or cursor over ETF symbol (ticker) to view short-term technical chart and over ETF name to view long term chart. Click on ticker or stock name for detailed view. Click on to add stock symbol to your watchlist and to view watchlist. |
12Stocks.com List of ETFs that track Smallcap Index
| Ticker | ETF Name | Watchlist | Recent Price | Smart Investing & Trading Score | Change % | Week % | Year-to-date % |
| IWM | iShares Russell 2000 | | 198.39 | 56 | 0.97 | 2.72 | -1.16% |
| IJR | iShares Core S&P Small-Cap | | 105.65 | 75 | 0.75 | 2.35 | -2.4% |
| VTWO | Vanguard Russell 2000 ETF | | 80.22 | 63 | 0.97 | 2.74 | -1.09% |
| IWN | iShares Russell 2000 Value | | 151.14 | 68 | 0.64 | 2.27 | -2.7% |
| IWO | iShares Russell 2000 Growth | | 253.09 | 58 | 1.29 | 3.18 | 0.34% |
| IJS | iShares S&P Small-Cap 600 Value | | 97.19 | 60 | 0.52 | 1.65 | -5.7% |
| IJT | iShares S&P Small-Cap 600 Growth | | 126.09 | 70 | 0.82 | 3.17 | 0.76% |
| XSLV | PowerShares S&P SmallCap Low Volatil ETF | | 42.72 | 72 | 0.42 | 1.28 | -3.24% |
| SAA | ProShares Ultra SmallCap600 | | 23.04 | 80 | 1.68 | 5.69 | -7.66% |
| SBB | ProShares Short SmallCap600 | | 16.39 | 20 | -0.70 | -2.7 | 2.86% |
| SDD | ProShares UltraShort SmallCap600 | | 19.35 | 38 | -1.17 | -4.87 | 5.01% |
| SMLV | SPDR SSGA US Small Cap Low Volatil ETF | | 107.52 | 60 | 0.18 | 1.35 | -4.44% |
| 12Stocks.com: Charts, Trends, Fundamental Data and Performances of SmallCap Stocks | |
|
We now take in-depth look at all SmallCap stocks including charts, multi-period performances and overall trends (as measured by Smart Investing & Trading Score). One can sort SmallCap stocks (click link to choose) by Daily, Weekly and by Year-to-Date performances. Also, one can sort by size of the company or by market capitalization. |
| Select Your Default Chart Type: | |||||
| |||||
| Click on stock symbol or name for detailed view. Click on to add stock symbol to your watchlist and to view watchlist. Quick View: Move mouse or cursor over "Daily" to quickly view daily technical stock chart and over "Weekly" to view weekly technical stock chart. | |||||

 | TALO Talos Energy Inc. |
| Sector: Energy | |
| SubSector: Independent Oil & Gas | |
| MarketCap: 396.293 Millions | |
| Recent Price: 13.94 Smart Investing & Trading Score: 73 | |
| Day Percent Change: 1.16% Day Change: 0.16 | |
| Week Change: 2.95% Year-to-date Change: -2.0% | |
| TALO Links: Profile News Message Board | |
| Charts:- Daily , Weekly | |
| Add TALO to Watchlist: View: Get Complete TALO Trend Analysis ➞ | |
 | BLFY Blue Foundry Bancorp |
| Sector: Financials | |
| SubSector: Banks - Regional | |
| MarketCap: 264 Millions | |
| Recent Price: 8.78 Smart Investing & Trading Score: 67 | |
| Day Percent Change: 1.15% Day Change: 0.10 | |
| Week Change: 4.15% Year-to-date Change: -8.8% | |
| BLFY Links: Profile News Message Board | |
| Charts:- Daily , Weekly | |
| Add BLFY to Watchlist: View: Get Complete BLFY Trend Analysis ➞ | |
 | OSUR OraSure Technologies, Inc. |
| Sector: Health Care | |
| SubSector: Medical Instruments & Supplies | |
| MarketCap: 468.26 Millions | |
| Recent Price: 5.32 Smart Investing & Trading Score: 20 | |
| Day Percent Change: 1.14% Day Change: 0.06 | |
| Week Change: 0.76% Year-to-date Change: -35.1% | |
| OSUR Links: Profile News Message Board | |
| Charts:- Daily , Weekly | |
| Add OSUR to Watchlist: View: Get Complete OSUR Trend Analysis ➞ | |
 | FORR Forrester Research, Inc. |
| Sector: Services & Goods | |
| SubSector: Research Services | |
| MarketCap: 473.394 Millions | |
| Recent Price: 18.77 Smart Investing & Trading Score: 37 | |
| Day Percent Change: 1.13% Day Change: 0.21 | |
| Week Change: 0.11% Year-to-date Change: -30.0% | |
| FORR Links: Profile News Message Board | |
| Charts:- Daily , Weekly | |
| Add FORR to Watchlist: View: Get Complete FORR Trend Analysis ➞ | |
 | GPRE Green Plains Inc. |
| Sector: Materials | |
| SubSector: Specialty Chemicals | |
| MarketCap: 196.357 Millions | |
| Recent Price: 21.40 Smart Investing & Trading Score: 43 | |
| Day Percent Change: 1.13% Day Change: 0.24 | |
| Week Change: -3.73% Year-to-date Change: -15.2% | |
| GPRE Links: Profile News Message Board | |
| Charts:- Daily , Weekly | |
| Add GPRE to Watchlist: View: Get Complete GPRE Trend Analysis ➞ | |
 | EGAN eGain Corporation |
| Sector: Technology | |
| SubSector: Business Software & Services | |
| MarketCap: 201.458 Millions | |
| Recent Price: 6.25 Smart Investing & Trading Score: 49 | |
| Day Percent Change: 1.13% Day Change: 0.07 | |
| Week Change: 2.29% Year-to-date Change: -25.0% | |
| EGAN Links: Profile News Message Board | |
| Charts:- Daily , Weekly | |
| Add EGAN to Watchlist: View: Get Complete EGAN Trend Analysis ➞ | |
 | EBTC Enterprise Bancorp, Inc. |
| Sector: Financials | |
| SubSector: Savings & Loans | |
| MarketCap: 304.53 Millions | |
| Recent Price: 24.90 Smart Investing & Trading Score: 64 | |
| Day Percent Change: 1.12% Day Change: 0.27 | |
| Week Change: 3.88% Year-to-date Change: -22.8% | |
| EBTC Links: Profile News Message Board | |
| Charts:- Daily , Weekly | |
| Add EBTC to Watchlist: View: Get Complete EBTC Trend Analysis ➞ | |
 | NSSC Napco Security Technologies, Inc. |
| Sector: Services & Goods | |
| SubSector: Security & Protection Services | |
| MarketCap: 339.103 Millions | |
| Recent Price: 43.86 Smart Investing & Trading Score: 100 | |
| Day Percent Change: 1.11% Day Change: 0.48 | |
| Week Change: 9.6% Year-to-date Change: 28.1% | |
| NSSC Links: Profile News Message Board | |
| Charts:- Daily , Weekly | |
| Add NSSC to Watchlist: View: Get Complete NSSC Trend Analysis ➞ | |
 | NEWT Newtek Business Services Corp. |
| Sector: Services & Goods | |
| SubSector: Business Services | |
| MarketCap: 243.982 Millions | |
| Recent Price: 11.00 Smart Investing & Trading Score: 52 | |
| Day Percent Change: 1.10% Day Change: 0.12 | |
| Week Change: 0.92% Year-to-date Change: -20.3% | |
| NEWT Links: Profile News Message Board | |
| Charts:- Daily , Weekly | |
| Add NEWT to Watchlist: View: Get Complete NEWT Trend Analysis ➞ | |
 | HWKN Hawkins, Inc. |
| Sector: Materials | |
| SubSector: Specialty Chemicals | |
| MarketCap: 398.957 Millions | |
| Recent Price: 75.78 Smart Investing & Trading Score: 41 | |
| Day Percent Change: 1.05% Day Change: 0.79 | |
| Week Change: 1.54% Year-to-date Change: 7.6% | |
| HWKN Links: Profile News Message Board | |
| Charts:- Daily , Weekly | |
| Add HWKN to Watchlist: View: Get Complete HWKN Trend Analysis ➞ | |
 | CEIX CONSOL Energy Inc. |
| Sector: Materials | |
| SubSector: Industrial Metals & Minerals | |
| MarketCap: 196.81 Millions | |
| Recent Price: 85.73 Smart Investing & Trading Score: 57 | |
| Day Percent Change: 1.05% Day Change: 0.90 | |
| Week Change: 1.96% Year-to-date Change: -14.7% | |
| CEIX Links: Profile News Message Board | |
| Charts:- Daily , Weekly | |
| Add CEIX to Watchlist: View: Get Complete CEIX Trend Analysis ➞ | |
 | TGAN Transphorm, Inc. |
| Sector: Technology | |
| SubSector: Semiconductor Equipment & Materials | |
| MarketCap: 194 Millions | |
| Recent Price: 4.86 Smart Investing & Trading Score: 45 | |
| Day Percent Change: 1.04% Day Change: 0.05 | |
| Week Change: 1.46% Year-to-date Change: 32.6% | |
| TGAN Links: Profile News Message Board | |
| Charts:- Daily , Weekly | |
| Add TGAN to Watchlist: View: Get Complete TGAN Trend Analysis ➞ | |
 | FISI Financial Institutions, Inc. |
| Sector: Financials | |
| SubSector: Regional - Mid-Atlantic Banks | |
| MarketCap: 253.459 Millions | |
| Recent Price: 17.60 Smart Investing & Trading Score: 59 | |
| Day Percent Change: 1.03% Day Change: 0.18 | |
| Week Change: 1.38% Year-to-date Change: -17.4% | |
| FISI Links: Profile News Message Board | |
| Charts:- Daily , Weekly | |
| Add FISI to Watchlist: View: Get Complete FISI Trend Analysis ➞ | |
 | NWPX Northwest Pipe Company |
| Sector: Materials | |
| SubSector: Steel & Iron | |
| MarketCap: 245.788 Millions | |
| Recent Price: 31.81 Smart Investing & Trading Score: 53 | |
| Day Percent Change: 1.02% Day Change: 0.32 | |
| Week Change: -0.13% Year-to-date Change: 5.1% | |
| NWPX Links: Profile News Message Board | |
| Charts:- Daily , Weekly | |
| Add NWPX to Watchlist: View: Get Complete NWPX Trend Analysis ➞ | |
 | LEGH Legacy Housing Corporation |
| Sector: Industrials | |
| SubSector: Residential Construction | |
| MarketCap: 298.006 Millions | |
| Recent Price: 20.30 Smart Investing & Trading Score: 42 | |
| Day Percent Change: 1.00% Day Change: 0.20 | |
| Week Change: 1.81% Year-to-date Change: -19.5% | |
| LEGH Links: Profile News Message Board | |
| Charts:- Daily , Weekly | |
| Add LEGH to Watchlist: View: Get Complete LEGH Trend Analysis ➞ | |
 | AMSWA American Software, Inc. |
| Sector: Technology | |
| SubSector: Application Software | |
| MarketCap: 389.862 Millions | |
| Recent Price: 10.22 Smart Investing & Trading Score: 17 | |
| Day Percent Change: 0.99% Day Change: 0.10 | |
| Week Change: -3.77% Year-to-date Change: -9.6% | |
| AMSWA Links: Profile News Message Board | |
| Charts:- Daily , Weekly | |
| Add AMSWA to Watchlist: View: Get Complete AMSWA Trend Analysis ➞ | |
 | INN Summit Hotel Properties, Inc. |
| Sector: Financials | |
| SubSector: Real Estate Development | |
| MarketCap: 402.019 Millions | |
| Recent Price: 6.13 Smart Investing & Trading Score: 10 | |
| Day Percent Change: 0.99% Day Change: 0.06 | |
| Week Change: -0.33% Year-to-date Change: -8.8% | |
| INN Links: Profile News Message Board | |
| Charts:- Daily , Weekly | |
| Add INN to Watchlist: View: Get Complete INN Trend Analysis ➞ | |
 | VRA Vera Bradley, Inc. |
| Sector: Consumer Staples | |
| SubSector: Textile - Apparel Footwear & Accessories | |
| MarketCap: 151.17 Millions | |
| Recent Price: 6.75 Smart Investing & Trading Score: 57 | |
| Day Percent Change: 0.97% Day Change: 0.07 | |
| Week Change: 4.74% Year-to-date Change: -12.4% | |
| VRA Links: Profile News Message Board | |
| Charts:- Daily , Weekly | |
| Add VRA to Watchlist: View: Get Complete VRA Trend Analysis ➞ | |
 | SXC SunCoke Energy, Inc. |
| Sector: Materials | |
| SubSector: Nonmetallic Mineral Mining | |
| MarketCap: 306.5 Millions | |
| Recent Price: 10.57 Smart Investing & Trading Score: 43 | |
| Day Percent Change: 0.96% Day Change: 0.10 | |
| Week Change: -1.49% Year-to-date Change: -1.6% | |
| SXC Links: Profile News Message Board | |
| Charts:- Daily , Weekly | |
| Add SXC to Watchlist: View: Get Complete SXC Trend Analysis ➞ | |
 | EFC Ellington Financial Inc. |
| Sector: Financials | |
| SubSector: Mortgage Investment | |
| MarketCap: 380.239 Millions | |
| Recent Price: 11.71 Smart Investing & Trading Score: 74 | |
| Day Percent Change: 0.95% Day Change: 0.11 | |
| Week Change: 2.54% Year-to-date Change: -7.9% | |
| EFC Links: Profile News Message Board | |
| Charts:- Daily , Weekly | |
| Add EFC to Watchlist: View: Get Complete EFC Trend Analysis ➞ | |
 | IRMD IRadimed Corporation |
| Sector: Health Care | |
| SubSector: Medical Appliances & Equipment | |
| MarketCap: 207.78 Millions | |
| Recent Price: 41.86 Smart Investing & Trading Score: 55 | |
| Day Percent Change: 0.94% Day Change: 0.39 | |
| Week Change: 2.1% Year-to-date Change: -11.8% | |
| IRMD Links: Profile News Message Board | |
| Charts:- Daily , Weekly | |
| Add IRMD to Watchlist: View: Get Complete IRMD Trend Analysis ➞ | |
 | KRT Karat Packaging Inc. |
| Sector: Services & Goods | |
| SubSector: Packaging & Containers | |
| MarketCap: 357 Millions | |
| Recent Price: 27.31 Smart Investing & Trading Score: 58 | |
| Day Percent Change: 0.92% Day Change: 0.25 | |
| Week Change: 1.79% Year-to-date Change: 9.6% | |
| KRT Links: Profile News Message Board | |
| Charts:- Daily , Weekly | |
| Add KRT to Watchlist: View: Get Complete KRT Trend Analysis ➞ | |
 | PLPC Preformed Line Products Company |
| Sector: Industrials | |
| SubSector: Industrial Electrical Equipment | |
| MarketCap: 221.779 Millions | |
| Recent Price: 124.71 Smart Investing & Trading Score: 70 | |
| Day Percent Change: 0.91% Day Change: 1.12 | |
| Week Change: 0.04% Year-to-date Change: -6.8% | |
| PLPC Links: Profile News Message Board | |
| Charts:- Daily , Weekly | |
| Add PLPC to Watchlist: View: Get Complete PLPC Trend Analysis ➞ | |
 | BRY Berry Corporation |
| Sector: Energy | |
| SubSector: Independent Oil & Gas | |
| MarketCap: 254.793 Millions | |
| Recent Price: 8.74 Smart Investing & Trading Score: 88 | |
| Day Percent Change: 0.87% Day Change: 0.08 | |
| Week Change: 3.86% Year-to-date Change: 24.3% | |
| BRY Links: Profile News Message Board | |
| Charts:- Daily , Weekly | |
| Add BRY to Watchlist: View: Get Complete BRY Trend Analysis ➞ | |
 | PFIS Peoples Financial Services Corp. |
| Sector: Financials | |
| SubSector: Regional - Northeast Banks | |
| MarketCap: 305.499 Millions | |
| Recent Price: 38.28 Smart Investing & Trading Score: 27 | |
| Day Percent Change: 0.87% Day Change: 0.33 | |
| Week Change: 0.5% Year-to-date Change: -21.4% | |
| PFIS Links: Profile News Message Board | |
| Charts:- Daily , Weekly | |
| Add PFIS to Watchlist: View: Get Complete PFIS Trend Analysis ➞ | |
| For tabular summary view of above stock list: Summary View ➞ 0 - 25 , 25 - 50 , 50 - 75 , 75 - 100 , 100 - 125 , 125 - 150 , 150 - 175 , 175 - 200 , 200 - 225 , 225 - 250 , 250 - 275 , 275 - 300 , 300 - 325 , 325 - 350 , 350 - 375 , 375 - 400 , 400 - 425 , 425 - 450 , 450 - 475 , 475 - 500 , 500 - 525 | ||
| Click To Change The Sort Order: By Market Cap or Company Size Performance: Year-to-date, Week and Day | |
| Select Chart Type: | ||
| Too many stocks? View smallcap stocks filtered by marketcap & sector |
| Marketcap: All SmallCap Stocks (default-no microcap), Large, Mid-Range, Small & MicroCap |
| Sector: Tech, Finance, Energy, Staples, Retail, Industrial, Materials, Utilities & Medical |
|
Best Stocks Today 12Stocks.com |
© 2024 12Stocks.com Terms & Conditions Privacy Contact Us
All Information Provided Only For Education And Not To Be Used For Investing or Trading. See Terms & Conditions


One More Thing ... Get Best Stocks Delivered Daily!
Never Ever Miss A Move With Our Top Ten Stocks Lists
Find Best Stocks In Any Market - Bull or Bear Market
Take A Peek At Our Top Ten Stocks Lists: Daily, Weekly, Year-to-Date & Top Trends
Find Best Stocks In Any Market - Bull or Bear Market
Take A Peek At Our Top Ten Stocks Lists: Daily, Weekly, Year-to-Date & Top Trends
Smallcap Stocks With Best Up Trends [0-bearish to 100-bullish]: Universal Logistics[100], Cullinan Oncology[100], Tutor Perini[100], Zura Bio[100], U.S. Silica[100], Exponent [100], NextNav [100], Solaris Oilfield[100], PTC [100], Rogers [100], Sonic Automotive[100]
Best Smallcap Stocks Year-to-Date:
CareMax [543.3%], Janux [341.65%], Viking [299.3%], Alpine Immune[239.08%], Longboard [222.75%], Super Micro[201.64%], Avidity Biosciences[169.47%], Arcutis Bio[162.23%], Vera [156.27%], Cullinan Oncology[148.16%], Hippo [139.52%] Best Smallcap Stocks This Week:
Matterport [170.98%], B. Riley[84.19%], Cullinan Oncology[61.56%], Seres [47.35%], Universal Logistics[36.84%], Tutor Perini[33.89%], Zura Bio[33.23%], Riot Blockchain[30.67%], IGM Biosciences[30.56%], Impinj [29.74%], Sonic Automotive[28.14%] Best Smallcap Stocks Daily:
Universal Logistics[39.37%], Cullinan Oncology[31.43%], Tutor Perini[28.01%], Zura Bio[26.72%], IGM Biosciences[23.36%], U.S. Silica[21.67%], Maxeon Solar[20.46%], Exponent [19.49%], TPI Composites[16.32%], OptimizeRx [15.07%], NextNav [13.97%]