
 Login Sign Up


| |||||
 |  | ||||

| 12Stocks.com Market Intelligence |
Best SmallCap Stocks
|
| In a hurry? Small Cap Stock Lists: Performance Trends Table, Stock Charts
Sort Small Cap stocks: Daily, Weekly, Year-to-Date, Market Cap & Trends. Filter Small Cap stocks list by sector: Show all, Tech, Finance, Energy, Staples, Retail, Industrial, Materials, Utilities and HealthCare Filter Small Cap stocks list by size: All Large Medium Small and MicroCap |
| 12Stocks.com Small Cap Stocks Performances & Trends Daily | |||||||||
|
|  The overall Smart Investing & Trading Score is 80 (0-bearish to 100-bullish) which puts Small Cap index in short term neutral to bullish trend. The Smart Investing & Trading Score from previous trading session is 50 and an improvement of trend continues.
| ||||||||
Here are the Smart Investing & Trading Scores of the most requested small cap stocks at 12Stocks.com (click stock name for detailed review):
|


| 12Stocks.com: Investing in Smallcap Index with Stocks | |
|
The following table helps investors and traders sort through current performance and trends (as measured by Smart Investing & Trading Score) of various
stocks in the Smallcap Index. Quick View: Move mouse or cursor over stock symbol (ticker) to view short-term technical chart and over stock name to view long term chart. Click on  to add stock symbol to your watchlist and to add stock symbol to your watchlist and  to view watchlist. Click on any ticker or stock name for detailed market intelligence report for that stock. to view watchlist. Click on any ticker or stock name for detailed market intelligence report for that stock. |
12Stocks.com Performance of Stocks in Smallcap Index
| Ticker | Stock Name | Watchlist | Category | Recent Price | Smart Investing & Trading Score | Change % | YTD Change% |
| SFM | Sprouts Farmers |   | Consumer Staples | 123.36 | 0 | -1.72% | -7.22% |
| COKE | Coca-Cola Consolidated | | Consumer Staples | 118.53 | 30 | 0.62% | -5.31% |
| ELF | e.l.f. Beauty | | Consumer Staples | 146.11 | 100 | 1.98% | 18.80% |
| LRN | Stride | | Consumer Staples | 138.54 | 10 | -0.55% | 30.28% |
| CALM | Cal-Maine Foods | | Consumer Staples | 103.52 | 10 | 0.50% | 5.31% |
| BRBR | Bellring Brands | | Consumer Staples | 36.63 | 20 | -0.33% | -50.89% |
| GHC | Graham | | Consumer Staples | 1143.31 | 50 | 0.33% | 32.88% |
| ATGE | Adtalem Global | | Consumer Staples | 136.11 | 80 | 0.38% | 46.73% |
| LAUR | Laureate Education | | Consumer Staples | 29.72 | 90 | 0.37% | 63.75% |
| LANC | Lancaster Colony | | Consumer Staples | 172.77 | 60 | 0.56% | 1.20% |
| FIZZ | National Beverage | | Consumer Staples | 38.39 | 10 | -0.39% | -9.46% |
| IPAR | Interparfums | | Consumer Staples | 103.49 | 0 | -1.44% | -18.61% |
| PSMT | Pricesmart | | Consumer Staples | 116.79 | 90 | -0.22% | 26.58% |
| SMPL | Simply Good | | Consumer Staples | 26.53 | 0 | -1.74% | -31.99% |
| CHEF | Chefs' Warehouse | | Consumer Staples | 67.44 | 80 | 2.74% | 35.72% |
| VITL | Vital Farms | | Consumer Staples | 44.80 | 30 | -4.78% | 15.35% |
| COCO | Vita Coco | | Consumer Staples | 42.30 | 100 | 5.80% | 20.38% |
| CENT | Central Garden | | Consumer Staples | 35.51 | 10 | -0.20% | -6.90% |
| CENTA | Central Garden | | Consumer Staples | 32.13 | 10 | -0.31% | -1.11% |
| PRDO | Perdoceo Education | | Consumer Staples | 35.32 | 100 | 0.54% | 36.41% |
| JJSF | J&J Snack | | Consumer Staples | 101.70 | 0 | -1.77% | -33.02% |
| STRA | Strategic Education | | Consumer Staples | 81.94 | 50 | 0.63% | -10.02% |
| COUR | Coursera | | Consumer Staples | 11.32 | 60 | 2.35% | 33.49% |
| TPB | Turning Point | | Consumer Staples | 101.96 | 70 | -0.49% | 68.50% |
| WMK | Weis Markets | | Consumer Staples | 72.02 | 60 | 0.28% | 6.55% |
| For chart view version of above stock list: Chart View ➞ 0 - 25 , 25 - 50 , 50 - 75 | ||
 | Click To Change The Sort Order: By Market Cap or Company Size Performance: Year-to-date, Week and Day |  |
| Too many stocks? View smallcap stocks filtered by marketcap & sector |
| Marketcap: All SmallCap Stocks (default-no microcap), Large, Mid-Range, Small |
| Smallcap Sector: Tech, Finance, Energy, Staples, Retail, Industrial, Materials, & Medical |
|
Get the most comprehensive stock market coverage daily at 12Stocks.com ➞ Best Stocks Today ➞ Best Stocks Weekly ➞ Best Stocks Year-to-Date ➞ Best Stocks Trends ➞  Best Stocks Today 12Stocks.com Best Nasdaq Stocks ➞ Best S&P 500 Stocks ➞ Best Tech Stocks ➞ Best Biotech Stocks ➞ |
| Detailed Overview of SmallCap Stocks |
| SmallCap Technical Overview, Leaders & Laggards, Top SmallCap ETF Funds & Detailed SmallCap Stocks List, Charts, Trends & More |
| Smallcap: Technical Analysis, Trends & YTD Performance | |
| SmallCap segment as represented by
IWM, an exchange-traded fund [ETF], holds basket of thousands of smallcap stocks from across all major sectors of the US stock market. The smallcap index (contains stocks like Riverbed & Sotheby's) is up by 8.58223% and is currently underperforming the overall market by -4.56457% year-to-date. Below is a quick view of technical charts and trends: | |
 IWM Weekly Chart |
|
| Long Term Trend: Very Good | |
| Medium Term Trend: Good | |
 IWM Daily Chart |
|
| Short Term Trend: Good | |
| Overall Trend Score: 80 | |
| YTD Performance: 8.58223% | |
| **Trend Scores & Views Are Only For Educational Purposes And Not For Investing | |
| 12Stocks.com: Top Performing Small Cap Index Stocks | ||||||||||||||||||||||||||||||||||||||||||||||||
 The top performing Small Cap Index stocks year to date are
Now, more recently, over last week, the top performing Small Cap Index stocks on the move are


|
||||||||||||||||||||||||||||||||||||||||||||||||
| 12Stocks.com: Investing in Smallcap Index using Exchange Traded Funds | |
|
The following table shows list of key exchange traded funds (ETF) that
help investors track Smallcap index. The following list also includes leveraged ETF funds that track twice or thrice the daily returns of Smallcap indices. Short or inverse ETF funds move in the opposite direction to the index they track and are useful during market pullbacks or during bear markets. Quick View: Move mouse or cursor over ETF symbol (ticker) to view short-term technical chart and over ETF name to view long term chart. Click on ticker or stock name for detailed view. Click on to add stock symbol to your watchlist and to view watchlist. |
12Stocks.com List of ETFs that track Smallcap Index
| Ticker | ETF Name | Watchlist | Recent Price | Smart Investing & Trading Score | Change % | Week % | Year-to-date % |
| IWM | iShares Russell 2000 ETF | | 238.92 | 80 | 0.268592 | 0.873971 | 8.58223% |
| IJR | iShares Core S&P Small-Cap ETF | | 117.95 | 30 | -0.025428 | 0.0339242 | 3.2819% |
| VTWO | Vanguard Russell 2000 Index ETF | | 96.93 | 80 | 0.248216 | 1.16898 | 9.0639% |
| IWN | iShares Russell 2000 Value ETF | | 175.07 | 50 | 0.0457169 | 0.206056 | 7.63206% |
| IWO | iShares Russell 2000 Growth ETF | | 315.01 | 80 | 0.283331 | 1.34805 | 9.36063% |
| IJS | iShares S&P Small-Cap 600 Value ETF | | 109.96 | 50 | 0.0728067 | 0.10925 | 2.50291% |
| IJT | iShares S&P Small-Cap 600 Growth ETF | | 140.39 | 30 | -0.0356024 | 0.0641483 | 3.99182% |
| XSLV | Invesco S&P SmallCap Low Volatility ETF | | 46.84 | 30 | 0.0168688 | -1.11885 | 0.602455% |
| SAA | ProShares Ultra SmallCap600 2x Shares | | 25.41 | 50 | -0.0220337 | 0.913423 | -1.51659% |
| SBB | ProShares Short SmallCap600 -1x Shares | | 14.05 | 50 | 0.0698006 | -0.473202 | -2.76282% |
| SMLV | SPDR SSGA US Small Cap Low Volatility Index ETF | | 132.22 | 70 | 0.731373 | 0.254769 | 6.04408% |
| SDD | ProShares UltraShort SmallCap600 -2x Shares | | 13.45 | 50 | 0.114649 | 0.694122 | -11.0908% |
| 12Stocks.com: Charts, Trends, Fundamental Data and Performances of SmallCap Stocks | |
|
We now take in-depth look at all SmallCap stocks including charts, multi-period performances and overall trends (as measured by Smart Investing & Trading Score). One can sort SmallCap stocks (click link to choose) by Daily, Weekly and by Year-to-Date performances. Also, one can sort by size of the company or by market capitalization. |
| Select Your Default Chart Type: | |||||
| |||||
| Click on stock symbol or name for detailed view. Click on to add stock symbol to your watchlist and to view watchlist. Quick View: Move mouse or cursor over "Daily" to quickly view daily technical stock chart and over "Weekly" to view weekly technical stock chart. | |||||

 | SFM Sprouts Farmers Market Inc |
| Sector: Consumer Staples | |
| SubSector: Grocery Stores | |
| MarketCap: 13567.3 Millions | |
| Recent Price: 123.36 Smart Investing & Trading Score: 0 | |
| Day Percent Change: -1.72084% Day Change: -2.65 | |
| Week Change: -9.30412% Year-to-date Change: -7.2% | |
| SFM Links: Profile News Message Board | |
| Charts:- Daily , Weekly | |
| Add SFM to Watchlist: View: Get Complete SFM Trend Analysis ➞ | |
 | COKE Coca-Cola Consolidated Inc |
| Sector: Consumer Staples | |
| SubSector: Beverages - Non-Alcoholic | |
| MarketCap: 10496.7 Millions | |
| Recent Price: 118.53 Smart Investing & Trading Score: 30 | |
| Day Percent Change: 0.619694% Day Change: -0.61 | |
| Week Change: -3.31974% Year-to-date Change: -5.3% | |
| COKE Links: Profile News Message Board | |
| Charts:- Daily , Weekly | |
| Add COKE to Watchlist: View: Get Complete COKE Trend Analysis ➞ | |
 | ELF e.l.f. Beauty Inc |
| Sector: Consumer Staples | |
| SubSector: Household & Personal Products | |
| MarketCap: 7600.77 Millions | |
| Recent Price: 146.11 Smart Investing & Trading Score: 100 | |
| Day Percent Change: 1.97515% Day Change: -4.13 | |
| Week Change: 5.24382% Year-to-date Change: 18.8% | |
| ELF Links: Profile News Message Board | |
| Charts:- Daily , Weekly | |
| Add ELF to Watchlist: View: Get Complete ELF Trend Analysis ➞ | |
 | LRN Stride Inc |
| Sector: Consumer Staples | |
| SubSector: Education & Training Services | |
| MarketCap: 7012.16 Millions | |
| Recent Price: 138.54 Smart Investing & Trading Score: 10 | |
| Day Percent Change: -0.552724% Day Change: 4.44 | |
| Week Change: -16.5974% Year-to-date Change: 30.3% | |
| LRN Links: Profile News Message Board | |
| Charts:- Daily , Weekly | |
| Add LRN to Watchlist: View: Get Complete LRN Trend Analysis ➞ | |
 | CALM Cal-Maine Foods, Inc |
| Sector: Consumer Staples | |
| SubSector: Farm Products | |
| MarketCap: 5520.47 Millions | |
| Recent Price: 103.52 Smart Investing & Trading Score: 10 | |
| Day Percent Change: 0.495098% Day Change: -0.95 | |
| Week Change: -4.74788% Year-to-date Change: 5.3% | |
| CALM Links: Profile News Message Board | |
| Charts:- Daily , Weekly | |
| Add CALM to Watchlist: View: Get Complete CALM Trend Analysis ➞ | |
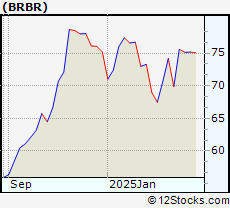 | BRBR Bellring Brands Inc |
| Sector: Consumer Staples | |
| SubSector: Packaged Foods | |
| MarketCap: 4971.14 Millions | |
| Recent Price: 36.63 Smart Investing & Trading Score: 20 | |
| Day Percent Change: -0.326531% Day Change: -0.91 | |
| Week Change: -2.86396% Year-to-date Change: -50.9% | |
| BRBR Links: Profile News Message Board | |
| Charts:- Daily , Weekly | |
| Add BRBR to Watchlist: View: Get Complete BRBR Trend Analysis ➞ | |
 | GHC Graham Holdings Co |
| Sector: Consumer Staples | |
| SubSector: Education & Training Services | |
| MarketCap: 4932.93 Millions | |
| Recent Price: 1143.31 Smart Investing & Trading Score: 50 | |
| Day Percent Change: 0.333477% Day Change: -5.34 | |
| Week Change: 0.685143% Year-to-date Change: 32.9% | |
| GHC Links: Profile News Message Board | |
| Charts:- Daily , Weekly | |
| Add GHC to Watchlist: View: Get Complete GHC Trend Analysis ➞ | |
 | ATGE Adtalem Global Education Inc |
| Sector: Consumer Staples | |
| SubSector: Education & Training Services | |
| MarketCap: 4834.25 Millions | |
| Recent Price: 136.11 Smart Investing & Trading Score: 80 | |
| Day Percent Change: 0.376106% Day Change: 2.42 | |
| Week Change: -0.0660793% Year-to-date Change: 46.7% | |
| ATGE Links: Profile News Message Board | |
| Charts:- Daily , Weekly | |
| Add ATGE to Watchlist: View: Get Complete ATGE Trend Analysis ➞ | |
 | LAUR Laureate Education Inc |
| Sector: Consumer Staples | |
| SubSector: Education & Training Services | |
| MarketCap: 4104.06 Millions | |
| Recent Price: 29.72 Smart Investing & Trading Score: 90 | |
| Day Percent Change: 0.371496% Day Change: 0.29 | |
| Week Change: 7.87659% Year-to-date Change: 63.7% | |
| LAUR Links: Profile News Message Board | |
| Charts:- Daily , Weekly | |
| Add LAUR to Watchlist: View: Get Complete LAUR Trend Analysis ➞ | |
 | LANC Lancaster Colony Corporation |
| Sector: Consumer Staples | |
| SubSector: Food - Major Diversified | |
| MarketCap: 4060.83 Millions | |
| Recent Price: 172.77 Smart Investing & Trading Score: 60 | |
| Day Percent Change: 0.56461% Day Change: -9999 | |
| Week Change: 2.24287% Year-to-date Change: 1.2% | |
| LANC Links: Profile News Message Board | |
| Charts:- Daily , Weekly | |
| Add LANC to Watchlist: View: Get Complete LANC Trend Analysis ➞ | |
 | FIZZ National Beverage Corp |
| Sector: Consumer Staples | |
| SubSector: Beverages - Non-Alcoholic | |
| MarketCap: 3745.75 Millions | |
| Recent Price: 38.39 Smart Investing & Trading Score: 10 | |
| Day Percent Change: -0.389206% Day Change: 0.5 | |
| Week Change: -2.31552% Year-to-date Change: -9.5% | |
| FIZZ Links: Profile News Message Board | |
| Charts:- Daily , Weekly | |
| Add FIZZ to Watchlist: View: Get Complete FIZZ Trend Analysis ➞ | |
 | IPAR Interparfums Inc |
| Sector: Consumer Staples | |
| SubSector: Household & Personal Products | |
| MarketCap: 3632.5 Millions | |
| Recent Price: 103.49 Smart Investing & Trading Score: 0 | |
| Day Percent Change: -1.4381% Day Change: -1.61 | |
| Week Change: -10.7537% Year-to-date Change: -18.6% | |
| IPAR Links: Profile News Message Board | |
| Charts:- Daily , Weekly | |
| Add IPAR to Watchlist: View: Get Complete IPAR Trend Analysis ➞ | |
 | PSMT Pricesmart Inc |
| Sector: Consumer Staples | |
| SubSector: Discount Stores | |
| MarketCap: 3382.01 Millions | |
| Recent Price: 116.79 Smart Investing & Trading Score: 90 | |
| Day Percent Change: -0.222127% Day Change: -1.24 | |
| Week Change: 5.41565% Year-to-date Change: 26.6% | |
| PSMT Links: Profile News Message Board | |
| Charts:- Daily , Weekly | |
| Add PSMT to Watchlist: View: Get Complete PSMT Trend Analysis ➞ | |
 | SMPL Simply Good Foods Co |
| Sector: Consumer Staples | |
| SubSector: Packaged Foods | |
| MarketCap: 2860.41 Millions | |
| Recent Price: 26.53 Smart Investing & Trading Score: 0 | |
| Day Percent Change: -1.74074% Day Change: 0.53 | |
| Week Change: -5.75488% Year-to-date Change: -32.0% | |
| SMPL Links: Profile News Message Board | |
| Charts:- Daily , Weekly | |
| Add SMPL to Watchlist: View: Get Complete SMPL Trend Analysis ➞ | |
 | CHEF Chefs' Warehouse Inc |
| Sector: Consumer Staples | |
| SubSector: Food Distribution | |
| MarketCap: 2607.59 Millions | |
| Recent Price: 67.44 Smart Investing & Trading Score: 80 | |
| Day Percent Change: 2.74223% Day Change: -0.13 | |
| Week Change: 4.34783% Year-to-date Change: 35.7% | |
| CHEF Links: Profile News Message Board | |
| Charts:- Daily , Weekly | |
| Add CHEF to Watchlist: View: Get Complete CHEF Trend Analysis ➞ | |
 | VITL Vital Farms Inc |
| Sector: Consumer Staples | |
| SubSector: Farm Products | |
| MarketCap: 2284.35 Millions | |
| Recent Price: 44.80 Smart Investing & Trading Score: 30 | |
| Day Percent Change: -4.78215% Day Change: 0.4 | |
| Week Change: -5.50517% Year-to-date Change: 15.3% | |
| VITL Links: Profile News Message Board | |
| Charts:- Daily , Weekly | |
| Add VITL to Watchlist: View: Get Complete VITL Trend Analysis ➞ | |
 | COCO Vita Coco Company Inc |
| Sector: Consumer Staples | |
| SubSector: Beverages - Non-Alcoholic | |
| MarketCap: 2189.96 Millions | |
| Recent Price: 42.30 Smart Investing & Trading Score: 100 | |
| Day Percent Change: 5.8029% Day Change: 0.1 | |
| Week Change: 9.61389% Year-to-date Change: 20.4% | |
| COCO Links: Profile News Message Board | |
| Charts:- Daily , Weekly | |
| Add COCO to Watchlist: View: Get Complete COCO Trend Analysis ➞ | |
 | CENT Central Garden & Pet Co |
| Sector: Consumer Staples | |
| SubSector: Packaged Foods | |
| MarketCap: 2186.21 Millions | |
| Recent Price: 35.51 Smart Investing & Trading Score: 10 | |
| Day Percent Change: -0.19674% Day Change: 0.46 | |
| Week Change: -5.28141% Year-to-date Change: -6.9% | |
| CENT Links: Profile News Message Board | |
| Charts:- Daily , Weekly | |
| Add CENT to Watchlist: View: Get Complete CENT Trend Analysis ➞ | |
 | CENTA Central Garden & Pet Co |
| Sector: Consumer Staples | |
| SubSector: Packaged Foods | |
| MarketCap: 2186.21 Millions | |
| Recent Price: 32.13 Smart Investing & Trading Score: 10 | |
| Day Percent Change: -0.31027% Day Change: 0.39 | |
| Week Change: -5.58331% Year-to-date Change: -1.1% | |
| CENTA Links: Profile News Message Board | |
| Charts:- Daily , Weekly | |
| Add CENTA to Watchlist: View: Get Complete CENTA Trend Analysis ➞ | |
 | PRDO Perdoceo Education Corporation |
| Sector: Consumer Staples | |
| SubSector: Education & Training Services | |
| MarketCap: 2138.27 Millions | |
| Recent Price: 35.32 Smart Investing & Trading Score: 100 | |
| Day Percent Change: 0.540848% Day Change: 0.45 | |
| Week Change: 5.90705% Year-to-date Change: 36.4% | |
| PRDO Links: Profile News Message Board | |
| Charts:- Daily , Weekly | |
| Add PRDO to Watchlist: View: Get Complete PRDO Trend Analysis ➞ | |
 | JJSF J&J Snack Foods Corp |
| Sector: Consumer Staples | |
| SubSector: Packaged Foods | |
| MarketCap: 2121.98 Millions | |
| Recent Price: 101.70 Smart Investing & Trading Score: 0 | |
| Day Percent Change: -1.7676% Day Change: 0.09 | |
| Week Change: -4.68604% Year-to-date Change: -33.0% | |
| JJSF Links: Profile News Message Board | |
| Charts:- Daily , Weekly | |
| Add JJSF to Watchlist: View: Get Complete JJSF Trend Analysis ➞ | |
 | STRA Strategic Education Inc |
| Sector: Consumer Staples | |
| SubSector: Education & Training Services | |
| MarketCap: 1958.88 Millions | |
| Recent Price: 81.94 Smart Investing & Trading Score: 50 | |
| Day Percent Change: 0.626305% Day Change: 1.15 | |
| Week Change: -0.714892% Year-to-date Change: -10.0% | |
| STRA Links: Profile News Message Board | |
| Charts:- Daily , Weekly | |
| Add STRA to Watchlist: View: Get Complete STRA Trend Analysis ➞ | |
 | COUR Coursera Inc |
| Sector: Consumer Staples | |
| SubSector: Education & Training Services | |
| MarketCap: 1843.26 Millions | |
| Recent Price: 11.32 Smart Investing & Trading Score: 60 | |
| Day Percent Change: 2.35081% Day Change: -0.08 | |
| Week Change: -5.27197% Year-to-date Change: 33.5% | |
| COUR Links: Profile News Message Board | |
| Charts:- Daily , Weekly | |
| Add COUR to Watchlist: View: Get Complete COUR Trend Analysis ➞ | |
 | TPB Turning Point Brands Inc |
| Sector: Consumer Staples | |
| SubSector: Tobacco | |
| MarketCap: 1818.7 Millions | |
| Recent Price: 101.96 Smart Investing & Trading Score: 70 | |
| Day Percent Change: -0.487995% Day Change: 1.77 | |
| Week Change: 2.46206% Year-to-date Change: 68.5% | |
| TPB Links: Profile News Message Board | |
| Charts:- Daily , Weekly | |
| Add TPB to Watchlist: View: Get Complete TPB Trend Analysis ➞ | |
 | WMK Weis Markets, Inc |
| Sector: Consumer Staples | |
| SubSector: Grocery Stores | |
| MarketCap: 1807.84 Millions | |
| Recent Price: 72.02 Smart Investing & Trading Score: 60 | |
| Day Percent Change: 0.278474% Day Change: 0.14 | |
| Week Change: 1.16589% Year-to-date Change: 6.5% | |
| WMK Links: Profile News Message Board | |
| Charts:- Daily , Weekly | |
| Add WMK to Watchlist: View: Get Complete WMK Trend Analysis ➞ | |
| For tabular summary view of above stock list: Summary View ➞ 0 - 25 , 25 - 50 , 50 - 75 | ||
| Click To Change The Sort Order: By Market Cap or Company Size Performance: Year-to-date, Week and Day | |
| Select Chart Type: | ||
| Too many stocks? View smallcap stocks filtered by marketcap & sector |
| Marketcap: All SmallCap Stocks (default-no microcap), Large, Mid-Range, Small & MicroCap |
| Sector: Tech, Finance, Energy, Staples, Retail, Industrial, Materials, Utilities & Medical |
|
Best Stocks Today 12Stocks.com |
© 2025 12Stocks.com Terms & Conditions Privacy Contact Us
All Information Provided Only For Education And Not To Be Used For Investing or Trading. See Terms & Conditions


One More Thing ... Get Best Stocks Delivered Daily!
Never Ever Miss A Move With Our Top Ten Stocks Lists
Find Best Stocks In Any Market - Bull or Bear Market
Take A Peek At Our Top Ten Stocks Lists: Daily, Weekly, Year-to-Date & Top Trends
Find Best Stocks In Any Market - Bull or Bear Market
Take A Peek At Our Top Ten Stocks Lists: Daily, Weekly, Year-to-Date & Top Trends
Smallcap Stocks With Best Up Trends [0-bearish to 100-bullish]: AlloVir [100], Cara [100], Assertio [100], Fuelcell Energy[100], B. Riley[100], Bandwidth [100], P.A.M. Transportation[100], Veritone [100], Parsons Corp[100], ACM Research[100], Bloom Energy[100]
Best Smallcap Stocks Year-to-Date:
FiscalNote [323.077%], Celcuity [315.842%], Immuneering Corp[265.158%], Precigen [253.704%], OptimizeRx Corp[241.267%], Bloom Energy[240.907%], CommScope Holding[215.891%], EchoStar Corp[215.648%], Centrus Energy[210.804%], 908 Devices[198.174%], Digital Turbine[194.886%] Best Smallcap Stocks This Week:
Textainer Group[258.475%], United Community[163.439%], Lakeland Bancorp[147.684%], Office Properties[146.649%], Dominion Midstream[118.502%], PDL BioPharma[112.645%], GTx [108.706%], Overseas Shipholding[77.0318%], PGT Innovations[65.2536%], Vimeo [60.9148%], Babcock & Wilcox Enterprises[53.2338%] Best Smallcap Stocks Daily:
AlloVir [16.9215%], Cara [14.3396%], Tyra Biosciences[14.26%], Zura Bio[13.71%], Assertio [12.692%], Fuelcell Energy[12.6657%], B. Riley[11.5556%], Bandwidth [10.7143%], Waldencast [10.6742%], Scilex Holding[10.6383%], P.A.M. Transportation[10.5477%]