
 Login Sign Up


| |||||
 |  | ||||

| 12Stocks.com Market Intelligence |
Best SmallCap Stocks
|
| In a hurry? Small Cap Stock Lists: Performance Trends Table, Stock Charts
Sort Small Cap stocks: Daily, Weekly, Year-to-Date, Market Cap & Trends. Filter Small Cap stocks list by sector: Show all, Tech, Finance, Energy, Staples, Retail, Industrial, Materials, Utilities and HealthCare Filter Small Cap stocks list by size: All Large Medium Small and MicroCap |
| 12Stocks.com Small Cap Stocks Performances & Trends Daily | |||||||||
|
|  The overall Smart Investing & Trading Score is 42 (0-bearish to 100-bullish) which puts Small Cap index in short term neutral trend. The Smart Investing & Trading Score from previous trading session is 42 and hence an improvement of trend.
| ||||||||
Here are the Smart Investing & Trading Scores of the most requested small cap stocks at 12Stocks.com (click stock name for detailed review):
|


| 12Stocks.com: Investing in Smallcap Index with Stocks | |
|
The following table helps investors and traders sort through current performance and trends (as measured by Smart Investing & Trading Score) of various
stocks in the Smallcap Index. Quick View: Move mouse or cursor over stock symbol (ticker) to view short-term technical chart and over stock name to view long term chart. Click on  to add stock symbol to your watchlist and to add stock symbol to your watchlist and  to view watchlist. Click on any ticker or stock name for detailed market intelligence report for that stock. to view watchlist. Click on any ticker or stock name for detailed market intelligence report for that stock. |
12Stocks.com Performance of Stocks in Smallcap Index
| Ticker | Stock Name | Watchlist | Category | Recent Price | Smart Investing & Trading Score | Change % | YTD Change% |
| GPRO | GoPro |   | Consumer Staples | 1.31 | 20 | -2.96% | -62.25% |
| GRTS | Gritstone Oncology | | Health Care | 0.72 | 32 | -3.96% | -64.54% |
| CMTL | Comtech Tele | | Technology | 2.94 | 42 | -12.39% | -65.18% |
| ZVIA | Zevia PBC | | Consumer Staples | 0.69 | 10 | -0.79% | -65.84% |
| CVRX | CVRx | | Health Care | 10.43 | 25 | -2.34% | -66.85% |
| CABA | Cabaletta Bio | | Health Care | 7.23 | 10 | -13.41% | -68.15% |
| CRBU | Caribou Biosciences | | Health Care | 1.76 | 49 | -5.88% | -69.18% |
| BBSI | Barrett Business | | Services & Goods | 33.31 | 0 | -0.48% | -71.23% |
| APPS | Digital Turbine | | Technology | 1.43 | 47 | -5.30% | -79.15% |
| IMRX | Immuneering | | Health Care | 1.43 | 50 | -4.03% | -81.16% |
| PRST | Presto Automation | | Technology | 0.09 | 62 | 8.75% | -83.54% |
| AKTS | Akoustis | | Technology | 0.13 | 27 | 1.15% | -84.23% |
| PACB | Pacific Biosciences | | Health Care | 1.40 | 20 | -3.45% | -85.73% |
| MRNS | Marinus | | Health Care | 1.36 | 25 | -0.73% | -87.49% |
| RAPT | RAPT | | Health Care | 3.08 | 15 | -4.94% | -87.61% |
| AVTE | Aerovate | | Health Care | 1.45 | 10 | -3.33% | -93.58% |
| For chart view version of above stock list: Chart View ➞ 0 - 25 , 25 - 50 , 50 - 75 , 75 - 100 , 100 - 125 , 125 - 150 , 150 - 175 , 175 - 200 , 200 - 225 , 225 - 250 , 250 - 275 , 275 - 300 , 300 - 325 , 325 - 350 , 350 - 375 , 375 - 400 , 400 - 425 , 425 - 450 , 450 - 475 , 475 - 500 , 500 - 525 | ||
 | Click To Change The Sort Order: By Market Cap or Company Size Performance: Year-to-date, Week and Day |  |
| Too many stocks? View smallcap stocks filtered by marketcap & sector |
| Marketcap: All SmallCap Stocks (default-no microcap), Large, Mid-Range, Small |
| Smallcap Sector: Tech, Finance, Energy, Staples, Retail, Industrial, Materials, & Medical |
|
Get the most comprehensive stock market coverage daily at 12Stocks.com ➞ Best Stocks Today ➞ Best Stocks Weekly ➞ Best Stocks Year-to-Date ➞ Best Stocks Trends ➞  Best Stocks Today 12Stocks.com Best Nasdaq Stocks ➞ Best S&P 500 Stocks ➞ Best Tech Stocks ➞ Best Biotech Stocks ➞ |
| Detailed Overview of SmallCap Stocks |
| SmallCap Technical Overview, Leaders & Laggards, Top SmallCap ETF Funds & Detailed SmallCap Stocks List, Charts, Trends & More |
| Smallcap: Technical Analysis, Trends & YTD Performance | |
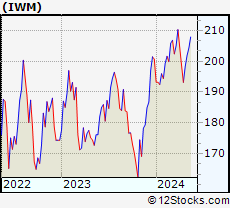
| SmallCap segment as represented by
IWM, an exchange-traded fund [ETF], holds basket of thousands of smallcap stocks from across all major sectors of the US stock market. The smallcap index (contains stocks like Riverbed & Sotheby's) is down by -0.07% and is currently underperforming the overall market by -13.36% year-to-date. Below is a quick view of technical charts and trends: | |
 IWM Weekly Chart |
|
| Long Term Trend: Not Good | |
| Medium Term Trend: Not Good | |
 IWM Daily Chart |
|
| Short Term Trend: Very Good | |
| Overall Trend Score: 42 | |
| YTD Performance: -0.07% | |
| **Trend Scores & Views Are Only For Educational Purposes And Not For Investing | |
| 12Stocks.com: Top Performing Small Cap Index Stocks | ||||||||||||||||||||||||||||||||||||||||||||||||
 The top performing Small Cap Index stocks year to date are
Now, more recently, over last week, the top performing Small Cap Index stocks on the move are


|
||||||||||||||||||||||||||||||||||||||||||||||||
| 12Stocks.com: Investing in Smallcap Index using Exchange Traded Funds | |
|
The following table shows list of key exchange traded funds (ETF) that
help investors track Smallcap index. The following list also includes leveraged ETF funds that track twice or thrice the daily returns of Smallcap indices. Short or inverse ETF funds move in the opposite direction to the index they track and are useful during market pullbacks or during bear markets. Quick View: Move mouse or cursor over ETF symbol (ticker) to view short-term technical chart and over ETF name to view long term chart. Click on ticker or stock name for detailed view. Click on to add stock symbol to your watchlist and to view watchlist. |
12Stocks.com List of ETFs that track Smallcap Index
| Ticker | ETF Name | Watchlist | Recent Price | Smart Investing & Trading Score | Change % | Week % | Year-to-date % |
| IWM | iShares Russell 2000 | | 200.56 | 42 | -0.31 | 0.1 | -0.07% |
| IJR | iShares Core S&P Small-Cap | | 105.25 | 25 | -0.86 | 0.02 | -2.77% |
| IWN | iShares Russell 2000 Value | | 150.09 | 25 | -0.68 | 0.25 | -3.37% |
| VTWO | Vanguard Russell 2000 ETF | | 81.33 | 42 | -0.31 | 0.12 | 0.28% |
| IWO | iShares Russell 2000 Growth | | 260.34 | 35 | 0.06 | 0.33 | 3.22% |
| IJS | iShares S&P Small-Cap 600 Value | | 95.88 | 25 | -1.19 | -0.31 | -6.98% |
| IJT | iShares S&P Small-Cap 600 Growth | | 126.91 | 25 | -0.45 | 0.06 | 1.41% |
| XSLV | PowerShares S&P SmallCap Low Volatil ETF | | 43.08 | 27 | -0.58 | -0.21 | -2.42% |
| SBB | ProShares Short SmallCap600 | | 16.61 | 81 | 1.34 | 0.44 | 4.27% |
| SMLV | SPDR SSGA US Small Cap Low Volatil ETF | | 107.14 | 15 | -0.92 | 0.15 | -4.78% |
| SAA | ProShares Ultra SmallCap600 | | 22.63 | 32 | -1.66 | -0.37 | -9.31% |
| SDD | ProShares UltraShort SmallCap600 | | 19.57 | 76 | 1.82 | 0.1 | 6.21% |
| 12Stocks.com: Charts, Trends, Fundamental Data and Performances of SmallCap Stocks | |
|
We now take in-depth look at all SmallCap stocks including charts, multi-period performances and overall trends (as measured by Smart Investing & Trading Score). One can sort SmallCap stocks (click link to choose) by Daily, Weekly and by Year-to-Date performances. Also, one can sort by size of the company or by market capitalization. |
| Select Your Default Chart Type: | |||||
| |||||
| Click on stock symbol or name for detailed view. Click on to add stock symbol to your watchlist and to view watchlist. Quick View: Move mouse or cursor over "Daily" to quickly view daily technical stock chart and over "Weekly" to view weekly technical stock chart. | |||||

 | GPRO GoPro, Inc. |
| Sector: Consumer Staples | |
| SubSector: Photographic Equipment & Supplies | |
| MarketCap: 475.925 Millions | |
| Recent Price: 1.31 Smart Investing & Trading Score: 20 | |
| Day Percent Change: -2.96% Day Change: -0.04 | |
| Week Change: -4.38% Year-to-date Change: -62.3% | |
| GPRO Links: Profile News Message Board | |
| Charts:- Daily , Weekly | |
| Add GPRO to Watchlist: View: Get Complete GPRO Trend Analysis ➞ | |
 | GRTS Gritstone Oncology, Inc. |
| Sector: Health Care | |
| SubSector: Biotechnology | |
| MarketCap: 240.085 Millions | |
| Recent Price: 0.72 Smart Investing & Trading Score: 32 | |
| Day Percent Change: -3.96% Day Change: -0.03 | |
| Week Change: 0.61% Year-to-date Change: -64.5% | |
| GRTS Links: Profile News Message Board | |
| Charts:- Daily , Weekly | |
| Add GRTS to Watchlist: View: Get Complete GRTS Trend Analysis ➞ | |
 | CMTL Comtech Telecommunications Corp. |
| Sector: Technology | |
| SubSector: Communication Equipment | |
| MarketCap: 399.539 Millions | |
| Recent Price: 2.94 Smart Investing & Trading Score: 42 | |
| Day Percent Change: -12.39% Day Change: -0.42 | |
| Week Change: -19.37% Year-to-date Change: -65.2% | |
| CMTL Links: Profile News Message Board | |
| Charts:- Daily , Weekly | |
| Add CMTL to Watchlist: View: Get Complete CMTL Trend Analysis ➞ | |
 | ZVIA Zevia PBC |
| Sector: Consumer Staples | |
| SubSector: Beverages - Non-Alcoholic | |
| MarketCap: 303 Millions | |
| Recent Price: 0.69 Smart Investing & Trading Score: 10 | |
| Day Percent Change: -0.79% Day Change: -0.01 | |
| Week Change: -4.78% Year-to-date Change: -65.8% | |
| ZVIA Links: Profile News Message Board | |
| Charts:- Daily , Weekly | |
| Add ZVIA to Watchlist: View: Get Complete ZVIA Trend Analysis ➞ | |
 | CVRX CVRx, Inc. |
| Sector: Health Care | |
| SubSector: Medical Devices | |
| MarketCap: 327 Millions | |
| Recent Price: 10.43 Smart Investing & Trading Score: 25 | |
| Day Percent Change: -2.34% Day Change: -0.25 | |
| Week Change: -3.6% Year-to-date Change: -66.9% | |
| CVRX Links: Profile News Message Board | |
| Charts:- Daily , Weekly | |
| Add CVRX to Watchlist: View: Get Complete CVRX Trend Analysis ➞ | |
 | CABA Cabaletta Bio, Inc. |
| Sector: Health Care | |
| SubSector: Biotechnology | |
| MarketCap: 222.085 Millions | |
| Recent Price: 7.23 Smart Investing & Trading Score: 10 | |
| Day Percent Change: -13.41% Day Change: -1.12 | |
| Week Change: -14.74% Year-to-date Change: -68.2% | |
| CABA Links: Profile News Message Board | |
| Charts:- Daily , Weekly | |
| Add CABA to Watchlist: View: Get Complete CABA Trend Analysis ➞ | |
 | CRBU Caribou Biosciences, Inc. |
| Sector: Health Care | |
| SubSector: Biotechnology | |
| MarketCap: 258 Millions | |
| Recent Price: 1.76 Smart Investing & Trading Score: 49 | |
| Day Percent Change: -5.88% Day Change: -0.11 | |
| Week Change: 2.33% Year-to-date Change: -69.2% | |
| CRBU Links: Profile News Message Board | |
| Charts:- Daily , Weekly | |
| Add CRBU to Watchlist: View: Get Complete CRBU Trend Analysis ➞ | |
 | BBSI Barrett Business Services, Inc. |
| Sector: Services & Goods | |
| SubSector: Staffing & Outsourcing Services | |
| MarketCap: 262.028 Millions | |
| Recent Price: 33.31 Smart Investing & Trading Score: 0 | |
| Day Percent Change: -0.48% Day Change: -0.16 | |
| Week Change: -75.38% Year-to-date Change: -71.2% | |
| BBSI Links: Profile News Message Board | |
| Charts:- Daily , Weekly | |
| Add BBSI to Watchlist: View: Get Complete BBSI Trend Analysis ➞ | |
 | APPS Digital Turbine, Inc. |
| Sector: Technology | |
| SubSector: Application Software | |
| MarketCap: 437.262 Millions | |
| Recent Price: 1.43 Smart Investing & Trading Score: 47 | |
| Day Percent Change: -5.30% Day Change: -0.08 | |
| Week Change: -2.39% Year-to-date Change: -79.2% | |
| APPS Links: Profile News Message Board | |
| Charts:- Daily , Weekly | |
| Add APPS to Watchlist: View: Get Complete APPS Trend Analysis ➞ | |
 | IMRX Immuneering Corporation |
| Sector: Health Care | |
| SubSector: Biotechnology | |
| MarketCap: 303 Millions | |
| Recent Price: 1.43 Smart Investing & Trading Score: 50 | |
| Day Percent Change: -4.03% Day Change: -0.06 | |
| Week Change: 0% Year-to-date Change: -81.2% | |
| IMRX Links: Profile News Message Board | |
| Charts:- Daily , Weekly | |
| Add IMRX to Watchlist: View: Get Complete IMRX Trend Analysis ➞ | |
 | PRST Presto Automation Inc. |
| Sector: Technology | |
| SubSector: Software - Application | |
| MarketCap: 238 Millions | |
| Recent Price: 0.09 Smart Investing & Trading Score: 62 | |
| Day Percent Change: 8.75% Day Change: 0.01 | |
| Week Change: 12.55% Year-to-date Change: -83.5% | |
| PRST Links: Profile News Message Board | |
| Charts:- Daily , Weekly | |
| Add PRST to Watchlist: View: Get Complete PRST Trend Analysis ➞ | |
 | AKTS Akoustis Technologies, Inc. |
| Sector: Technology | |
| SubSector: Communication Equipment | |
| MarketCap: 197.039 Millions | |
| Recent Price: 0.13 Smart Investing & Trading Score: 27 | |
| Day Percent Change: 1.15% Day Change: 0.00 | |
| Week Change: 4.61% Year-to-date Change: -84.2% | |
| AKTS Links: Profile News Message Board | |
| Charts:- Daily , Weekly | |
| Add AKTS to Watchlist: View: Get Complete AKTS Trend Analysis ➞ | |
 | PACB Pacific Biosciences of California, Inc. |
| Sector: Health Care | |
| SubSector: Biotechnology | |
| MarketCap: 470.685 Millions | |
| Recent Price: 1.40 Smart Investing & Trading Score: 20 | |
| Day Percent Change: -3.45% Day Change: -0.05 | |
| Week Change: -4.76% Year-to-date Change: -85.7% | |
| PACB Links: Profile News Message Board | |
| Charts:- Daily , Weekly | |
| Add PACB to Watchlist: View: Get Complete PACB Trend Analysis ➞ | |
 | MRNS Marinus Pharmaceuticals, Inc. |
| Sector: Health Care | |
| SubSector: Biotechnology | |
| MarketCap: 222.885 Millions | |
| Recent Price: 1.36 Smart Investing & Trading Score: 25 | |
| Day Percent Change: -0.73% Day Change: -0.01 | |
| Week Change: 1.87% Year-to-date Change: -87.5% | |
| MRNS Links: Profile News Message Board | |
| Charts:- Daily , Weekly | |
| Add MRNS to Watchlist: View: Get Complete MRNS Trend Analysis ➞ | |
 | RAPT RAPT Therapeutics, Inc. |
| Sector: Health Care | |
| SubSector: Biotechnology | |
| MarketCap: 368.785 Millions | |
| Recent Price: 3.08 Smart Investing & Trading Score: 15 | |
| Day Percent Change: -4.94% Day Change: -0.16 | |
| Week Change: -1.91% Year-to-date Change: -87.6% | |
| RAPT Links: Profile News Message Board | |
| Charts:- Daily , Weekly | |
| Add RAPT to Watchlist: View: Get Complete RAPT Trend Analysis ➞ | |
 | AVTE Aerovate Therapeutics, Inc. |
| Sector: Health Care | |
| SubSector: Biotechnology | |
| MarketCap: 478 Millions | |
| Recent Price: 1.45 Smart Investing & Trading Score: 10 | |
| Day Percent Change: -3.33% Day Change: -0.05 | |
| Week Change: -7.05% Year-to-date Change: -93.6% | |
| AVTE Links: Profile News Message Board | |
| Charts:- Daily , Weekly | |
| Add AVTE to Watchlist: View: Get Complete AVTE Trend Analysis ➞ | |
| For tabular summary view of above stock list: Summary View ➞ 0 - 25 , 25 - 50 , 50 - 75 , 75 - 100 , 100 - 125 , 125 - 150 , 150 - 175 , 175 - 200 , 200 - 225 , 225 - 250 , 250 - 275 , 275 - 300 , 300 - 325 , 325 - 350 , 350 - 375 , 375 - 400 , 400 - 425 , 425 - 450 , 450 - 475 , 475 - 500 , 500 - 525 | ||
| Click To Change The Sort Order: By Market Cap or Company Size Performance: Year-to-date, Week and Day | |
| Select Chart Type: | ||
| Too many stocks? View smallcap stocks filtered by marketcap & sector |
| Marketcap: All SmallCap Stocks (default-no microcap), Large, Mid-Range, Small & MicroCap |
| Sector: Tech, Finance, Energy, Staples, Retail, Industrial, Materials, Utilities & Medical |
|
Best Stocks Today 12Stocks.com |
© 2024 12Stocks.com Terms & Conditions Privacy Contact Us
All Information Provided Only For Education And Not To Be Used For Investing or Trading. See Terms & Conditions


One More Thing ... Get Best Stocks Delivered Daily!
Never Ever Miss A Move With Our Top Ten Stocks Lists
Find Best Stocks In Any Market - Bull or Bear Market
Take A Peek At Our Top Ten Stocks Lists: Daily, Weekly, Year-to-Date & Top Trends
Find Best Stocks In Any Market - Bull or Bear Market
Take A Peek At Our Top Ten Stocks Lists: Daily, Weekly, Year-to-Date & Top Trends
Smallcap Stocks With Best Up Trends [0-bearish to 100-bullish]: Enovix [100], Tellurian [100], Brightcove [100], NuScale Power[100], Fortress Transportation[100], Carvana Co[100], Repro Med[100], Eos Energy[100], Torrid [100], BRC [100], Ispire [100]
Best Smallcap Stocks Year-to-Date:
Dominion Midstream[461.92%], Workhorse Group[377.78%], 2U [352.85%], Avidity Biosciences[349.23%], CareMax [291.75%], Janux [285.95%], Virgin Galactic[255.51%], NuScale Power[240.16%], Longboard [232.9%], Summit [206.9%], Arcutis Bio[196.75%] Best Smallcap Stocks This Week:
Enovix [35.5%], Eos Energy[28.52%], Tellurian [27.2%], RXO [22.76%], Cara [19.57%], Brightcove [18.32%], Morphic Holding[17.81%], PDS [17.8%], ZimVie [17.17%], BARK [16.08%], Lindblad Expeditions[15.98%] Best Smallcap Stocks Daily:
Enovix [35.05%], ZimVie [22.72%], BARK [13.70%], KVH Industries[13.02%], Tellurian [10.75%], Brightcove [10.65%], DHI Group[9.81%], NuScale Power[9.48%], MicroStrategy [9.01%], Fortress Transportation[8.95%], Lindblad Expeditions[8.80%]