
 Login Sign Up


| |||||
 |  | ||||

| 12Stocks.com Market Intelligence |
Best SmallCap Stocks
|
| In a hurry? Small Cap Stock Lists: Performance Trends Table, Stock Charts
Sort Small Cap stocks: Daily, Weekly, Year-to-Date, Market Cap & Trends. Filter Small Cap stocks list by sector: Show all, Tech, Finance, Energy, Staples, Retail, Industrial, Materials, Utilities and HealthCare Filter Small Cap stocks list by size: All Large Medium Small and MicroCap |
| 12Stocks.com Small Cap Stocks Performances & Trends Daily | |||||||||
|
|  The overall Smart Investing & Trading Score is 42 (0-bearish to 100-bullish) which puts Small Cap index in short term neutral trend. The Smart Investing & Trading Score from previous trading session is 42 and hence an improvement of trend.
| ||||||||
Here are the Smart Investing & Trading Scores of the most requested small cap stocks at 12Stocks.com (click stock name for detailed review):
|


| 12Stocks.com: Investing in Smallcap Index with Stocks | |
|
The following table helps investors and traders sort through current performance and trends (as measured by Smart Investing & Trading Score) of various
stocks in the Smallcap Index. Quick View: Move mouse or cursor over stock symbol (ticker) to view short-term technical chart and over stock name to view long term chart. Click on  to add stock symbol to your watchlist and to add stock symbol to your watchlist and  to view watchlist. Click on any ticker or stock name for detailed market intelligence report for that stock. to view watchlist. Click on any ticker or stock name for detailed market intelligence report for that stock. |
12Stocks.com Performance of Stocks in Smallcap Index
| Ticker | Stock Name | Watchlist | Category | Recent Price | Smart Investing & Trading Score | Change % | YTD Change% |
| FFWM | First Foundation |   | Financials | 5.29 | 10 | -8.16% | -45.35% |
| GSAT | Globalstar | | Technology | 1.05 | 27 | -0.94% | -45.88% |
| LUNA | Luna Innovations | | Technology | 3.58 | 93 | -0.83% | -46.17% |
| HOFT | Hooker Furniture | | Consumer Staples | 14.02 | 49 | 2.94% | -46.24% |
| MCRB | Seres | | Health Care | 0.75 | 50 | -1.11% | -46.39% |
| AIRS | AirSculpt | | Health Care | 3.93 | 10 | 0.51% | -47.53% |
| OSUR | OraSure | | Health Care | 4.22 | 10 | -1.40% | -48.54% |
| GNE | Genie Energy | | Energy | 14.36 | 27 | 0.42% | -48.95% |
| GPMT | Granite Point | | Financials | 2.88 | 10 | -5.57% | -51.52% |
| AKYA | Akoya Biosciences | | Health Care | 2.36 | 59 | -2.07% | -51.74% |
| BIRD | Allbirds | | Services & Goods | 0.59 | 64 | -0.07% | -52.17% |
| EVC | Entravision | | Services & Goods | 1.98 | 78 | 0.51% | -52.52% |
| QTRX | Quanterix | | Health Care | 12.69 | 20 | -0.86% | -53.58% |
| MASS | 908 Devices | | Health Care | 5.14 | 10 | -1.72% | -54.11% |
| MGNX | MacroGenics | | Health Care | 4.29 | 32 | -4.67% | -55.41% |
| FRPH | FRP | | Financials | 27.88 | 10 | 0.14% | -55.66% |
| SSTI | ShotSpotter | | Technology | 11.16 | 0 | -6.84% | -56.30% |
| AVXL | Anavex Life | | Health Care | 4.05 | 62 | -3.80% | -56.50% |
| SRRK | Scholar Rock | | Health Care | 8.05 | 10 | -4.28% | -57.18% |
| FCEL | FuelCell Energy | | Industrials | 0.65 | 0 | -4.22% | -59.28% |
| BTAI | BioXcel | | Health Care | 1.20 | 42 | 0.84% | -59.32% |
| NRGV | Energy Vault | | Utilities | 0.94 | 15 | -0.66% | -59.61% |
| DOUG | Douglas Elliman | | Financials | 1.16 | 42 | 4.50% | -60.41% |
| FRGE | Forge Global | | Technology | 1.37 | 25 | -2.14% | -61.62% |
| PLCE | Children s | | Services & Goods | 8.77 | 59 | 1.74% | -62.23% |
| For chart view version of above stock list: Chart View ➞ 0 - 25 , 25 - 50 , 50 - 75 , 75 - 100 , 100 - 125 , 125 - 150 , 150 - 175 , 175 - 200 , 200 - 225 , 225 - 250 , 250 - 275 , 275 - 300 , 300 - 325 , 325 - 350 , 350 - 375 , 375 - 400 , 400 - 425 , 425 - 450 , 450 - 475 , 475 - 500 , 500 - 525 | ||
 | Click To Change The Sort Order: By Market Cap or Company Size Performance: Year-to-date, Week and Day |  |
| Too many stocks? View smallcap stocks filtered by marketcap & sector |
| Marketcap: All SmallCap Stocks (default-no microcap), Large, Mid-Range, Small |
| Smallcap Sector: Tech, Finance, Energy, Staples, Retail, Industrial, Materials, & Medical |
|
Get the most comprehensive stock market coverage daily at 12Stocks.com ➞ Best Stocks Today ➞ Best Stocks Weekly ➞ Best Stocks Year-to-Date ➞ Best Stocks Trends ➞  Best Stocks Today 12Stocks.com Best Nasdaq Stocks ➞ Best S&P 500 Stocks ➞ Best Tech Stocks ➞ Best Biotech Stocks ➞ |
| Detailed Overview of SmallCap Stocks |
| SmallCap Technical Overview, Leaders & Laggards, Top SmallCap ETF Funds & Detailed SmallCap Stocks List, Charts, Trends & More |
| Smallcap: Technical Analysis, Trends & YTD Performance | |
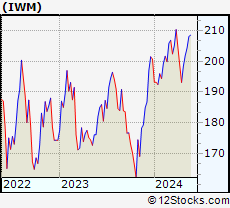
| SmallCap segment as represented by
IWM, an exchange-traded fund [ETF], holds basket of thousands of smallcap stocks from across all major sectors of the US stock market. The smallcap index (contains stocks like Riverbed & Sotheby's) is down by -0.07% and is currently underperforming the overall market by -13.36% year-to-date. Below is a quick view of technical charts and trends: | |
 IWM Weekly Chart |
|
| Long Term Trend: Not Good | |
| Medium Term Trend: Not Good | |
 IWM Daily Chart |
|
| Short Term Trend: Very Good | |
| Overall Trend Score: 42 | |
| YTD Performance: -0.07% | |
| **Trend Scores & Views Are Only For Educational Purposes And Not For Investing | |
| 12Stocks.com: Top Performing Small Cap Index Stocks | ||||||||||||||||||||||||||||||||||||||||||||||||
 The top performing Small Cap Index stocks year to date are
Now, more recently, over last week, the top performing Small Cap Index stocks on the move are


|
||||||||||||||||||||||||||||||||||||||||||||||||
| 12Stocks.com: Investing in Smallcap Index using Exchange Traded Funds | |
|
The following table shows list of key exchange traded funds (ETF) that
help investors track Smallcap index. The following list also includes leveraged ETF funds that track twice or thrice the daily returns of Smallcap indices. Short or inverse ETF funds move in the opposite direction to the index they track and are useful during market pullbacks or during bear markets. Quick View: Move mouse or cursor over ETF symbol (ticker) to view short-term technical chart and over ETF name to view long term chart. Click on ticker or stock name for detailed view. Click on to add stock symbol to your watchlist and to view watchlist. |
12Stocks.com List of ETFs that track Smallcap Index
| Ticker | ETF Name | Watchlist | Recent Price | Smart Investing & Trading Score | Change % | Week % | Year-to-date % |
| IWM | iShares Russell 2000 | | 200.56 | 42 | -0.31 | 0.1 | -0.07% |
| IJR | iShares Core S&P Small-Cap | | 105.25 | 25 | -0.86 | 0.02 | -2.77% |
| IWN | iShares Russell 2000 Value | | 150.09 | 25 | -0.68 | 0.25 | -3.37% |
| VTWO | Vanguard Russell 2000 ETF | | 81.33 | 42 | -0.31 | 0.12 | 0.28% |
| IWO | iShares Russell 2000 Growth | | 260.34 | 35 | 0.06 | 0.33 | 3.22% |
| IJS | iShares S&P Small-Cap 600 Value | | 95.88 | 25 | -1.19 | -0.31 | -6.98% |
| IJT | iShares S&P Small-Cap 600 Growth | | 126.91 | 25 | -0.45 | 0.06 | 1.41% |
| XSLV | PowerShares S&P SmallCap Low Volatil ETF | | 43.08 | 27 | -0.58 | -0.21 | -2.42% |
| SBB | ProShares Short SmallCap600 | | 16.61 | 81 | 1.34 | 0.44 | 4.27% |
| SMLV | SPDR SSGA US Small Cap Low Volatil ETF | | 107.14 | 15 | -0.92 | 0.15 | -4.78% |
| SAA | ProShares Ultra SmallCap600 | | 22.63 | 32 | -1.66 | -0.37 | -9.31% |
| SDD | ProShares UltraShort SmallCap600 | | 19.57 | 76 | 1.82 | 0.1 | 6.21% |
| 12Stocks.com: Charts, Trends, Fundamental Data and Performances of SmallCap Stocks | |
|
We now take in-depth look at all SmallCap stocks including charts, multi-period performances and overall trends (as measured by Smart Investing & Trading Score). One can sort SmallCap stocks (click link to choose) by Daily, Weekly and by Year-to-Date performances. Also, one can sort by size of the company or by market capitalization. |
| Select Your Default Chart Type: | |||||
| |||||
| Click on stock symbol or name for detailed view. Click on to add stock symbol to your watchlist and to view watchlist. Quick View: Move mouse or cursor over "Daily" to quickly view daily technical stock chart and over "Weekly" to view weekly technical stock chart. | |||||

 | FFWM First Foundation Inc. |
| Sector: Financials | |
| SubSector: Regional - Midwest Banks | |
| MarketCap: 457.17 Millions | |
| Recent Price: 5.29 Smart Investing & Trading Score: 10 | |
| Day Percent Change: -8.16% Day Change: -0.47 | |
| Week Change: -4.86% Year-to-date Change: -45.4% | |
| FFWM Links: Profile News Message Board | |
| Charts:- Daily , Weekly | |
| Add FFWM to Watchlist: View: Get Complete FFWM Trend Analysis ➞ | |
 | GSAT Globalstar, Inc. |
| Sector: Technology | |
| SubSector: Wireless Communications | |
| MarketCap: 485.127 Millions | |
| Recent Price: 1.05 Smart Investing & Trading Score: 27 | |
| Day Percent Change: -0.94% Day Change: -0.01 | |
| Week Change: 0.96% Year-to-date Change: -45.9% | |
| GSAT Links: Profile News Message Board | |
| Charts:- Daily , Weekly | |
| Add GSAT to Watchlist: View: Get Complete GSAT Trend Analysis ➞ | |
 | LUNA Luna Innovations Incorporated |
| Sector: Technology | |
| SubSector: Scientific & Technical Instruments | |
| MarketCap: 166.353 Millions | |
| Recent Price: 3.58 Smart Investing & Trading Score: 93 | |
| Day Percent Change: -0.83% Day Change: -0.03 | |
| Week Change: 4.37% Year-to-date Change: -46.2% | |
| LUNA Links: Profile News Message Board | |
| Charts:- Daily , Weekly | |
| Add LUNA to Watchlist: View: Get Complete LUNA Trend Analysis ➞ | |
 | HOFT Hooker Furniture Corporation |
| Sector: Consumer Staples | |
| SubSector: Home Furnishings & Fixtures | |
| MarketCap: 173.235 Millions | |
| Recent Price: 14.02 Smart Investing & Trading Score: 49 | |
| Day Percent Change: 2.94% Day Change: 0.40 | |
| Week Change: 3.77% Year-to-date Change: -46.2% | |
| HOFT Links: Profile News Message Board | |
| Charts:- Daily , Weekly | |
| Add HOFT to Watchlist: View: Get Complete HOFT Trend Analysis ➞ | |
 | MCRB Seres Therapeutics, Inc. |
| Sector: Health Care | |
| SubSector: Biotechnology | |
| MarketCap: 217.585 Millions | |
| Recent Price: 0.75 Smart Investing & Trading Score: 50 | |
| Day Percent Change: -1.11% Day Change: -0.01 | |
| Week Change: -3.27% Year-to-date Change: -46.4% | |
| MCRB Links: Profile News Message Board | |
| Charts:- Daily , Weekly | |
| Add MCRB to Watchlist: View: Get Complete MCRB Trend Analysis ➞ | |
 | AIRS AirSculpt Technologies, Inc. |
| Sector: Health Care | |
| SubSector: Medical Care Facilities | |
| MarketCap: 497 Millions | |
| Recent Price: 3.93 Smart Investing & Trading Score: 10 | |
| Day Percent Change: 0.51% Day Change: 0.02 | |
| Week Change: -0.25% Year-to-date Change: -47.5% | |
| AIRS Links: Profile News Message Board | |
| Charts:- Daily , Weekly | |
| Add AIRS to Watchlist: View: Get Complete AIRS Trend Analysis ➞ | |
 | OSUR OraSure Technologies, Inc. |
| Sector: Health Care | |
| SubSector: Medical Instruments & Supplies | |
| MarketCap: 468.26 Millions | |
| Recent Price: 4.22 Smart Investing & Trading Score: 10 | |
| Day Percent Change: -1.40% Day Change: -0.06 | |
| Week Change: -4.09% Year-to-date Change: -48.5% | |
| OSUR Links: Profile News Message Board | |
| Charts:- Daily , Weekly | |
| Add OSUR to Watchlist: View: Get Complete OSUR Trend Analysis ➞ | |
 | GNE Genie Energy Ltd. |
| Sector: Energy | |
| SubSector: Independent Oil & Gas | |
| MarketCap: 177.293 Millions | |
| Recent Price: 14.36 Smart Investing & Trading Score: 27 | |
| Day Percent Change: 0.42% Day Change: 0.06 | |
| Week Change: 0.98% Year-to-date Change: -49.0% | |
| GNE Links: Profile News Message Board | |
| Charts:- Daily , Weekly | |
| Add GNE to Watchlist: View: Get Complete GNE Trend Analysis ➞ | |
 | GPMT Granite Point Mortgage Trust Inc. |
| Sector: Financials | |
| SubSector: Mortgage Investment | |
| MarketCap: 289.739 Millions | |
| Recent Price: 2.88 Smart Investing & Trading Score: 10 | |
| Day Percent Change: -5.57% Day Change: -0.17 | |
| Week Change: -5.57% Year-to-date Change: -51.5% | |
| GPMT Links: Profile News Message Board | |
| Charts:- Daily , Weekly | |
| Add GPMT to Watchlist: View: Get Complete GPMT Trend Analysis ➞ | |
 | AKYA Akoya Biosciences, Inc. |
| Sector: Health Care | |
| SubSector: Medical Instruments & Supplies | |
| MarketCap: 340 Millions | |
| Recent Price: 2.36 Smart Investing & Trading Score: 59 | |
| Day Percent Change: -2.07% Day Change: -0.05 | |
| Week Change: 0% Year-to-date Change: -51.7% | |
| AKYA Links: Profile News Message Board | |
| Charts:- Daily , Weekly | |
| Add AKYA to Watchlist: View: Get Complete AKYA Trend Analysis ➞ | |
 | BIRD Allbirds, Inc. |
| Sector: Services & Goods | |
| SubSector: Apparel Retail | |
| MarketCap: 184 Millions | |
| Recent Price: 0.59 Smart Investing & Trading Score: 64 | |
| Day Percent Change: -0.07% Day Change: 0.00 | |
| Week Change: 5.56% Year-to-date Change: -52.2% | |
| BIRD Links: Profile News Message Board | |
| Charts:- Daily , Weekly | |
| Add BIRD to Watchlist: View: Get Complete BIRD Trend Analysis ➞ | |
 | EVC Entravision Communications Corporation |
| Sector: Services & Goods | |
| SubSector: Broadcasting - TV | |
| MarketCap: 171.763 Millions | |
| Recent Price: 1.98 Smart Investing & Trading Score: 78 | |
| Day Percent Change: 0.51% Day Change: 0.01 | |
| Week Change: 3.13% Year-to-date Change: -52.5% | |
| EVC Links: Profile News Message Board | |
| Charts:- Daily , Weekly | |
| Add EVC to Watchlist: View: Get Complete EVC Trend Analysis ➞ | |
 | QTRX Quanterix Corporation |
| Sector: Health Care | |
| SubSector: Biotechnology | |
| MarketCap: 448.685 Millions | |
| Recent Price: 12.69 Smart Investing & Trading Score: 20 | |
| Day Percent Change: -0.86% Day Change: -0.11 | |
| Week Change: -1.09% Year-to-date Change: -53.6% | |
| QTRX Links: Profile News Message Board | |
| Charts:- Daily , Weekly | |
| Add QTRX to Watchlist: View: Get Complete QTRX Trend Analysis ➞ | |
 | MASS 908 Devices Inc. |
| Sector: Health Care | |
| SubSector: Medical Devices | |
| MarketCap: 225 Millions | |
| Recent Price: 5.14 Smart Investing & Trading Score: 10 | |
| Day Percent Change: -1.72% Day Change: -0.09 | |
| Week Change: -3.75% Year-to-date Change: -54.1% | |
| MASS Links: Profile News Message Board | |
| Charts:- Daily , Weekly | |
| Add MASS to Watchlist: View: Get Complete MASS Trend Analysis ➞ | |
 | MGNX MacroGenics, Inc. |
| Sector: Health Care | |
| SubSector: Biotechnology | |
| MarketCap: 262.785 Millions | |
| Recent Price: 4.29 Smart Investing & Trading Score: 32 | |
| Day Percent Change: -4.67% Day Change: -0.21 | |
| Week Change: -1.83% Year-to-date Change: -55.4% | |
| MGNX Links: Profile News Message Board | |
| Charts:- Daily , Weekly | |
| Add MGNX to Watchlist: View: Get Complete MGNX Trend Analysis ➞ | |
 | FRPH FRP Holdings, Inc. |
| Sector: Financials | |
| SubSector: Property Management | |
| MarketCap: 374.442 Millions | |
| Recent Price: 27.88 Smart Investing & Trading Score: 10 | |
| Day Percent Change: 0.14% Day Change: 0.04 | |
| Week Change: 0.14% Year-to-date Change: -55.7% | |
| FRPH Links: Profile News Message Board | |
| Charts:- Daily , Weekly | |
| Add FRPH to Watchlist: View: Get Complete FRPH Trend Analysis ➞ | |
 | SSTI ShotSpotter, Inc. |
| Sector: Technology | |
| SubSector: Application Software | |
| MarketCap: 353.062 Millions | |
| Recent Price: 11.16 Smart Investing & Trading Score: 0 | |
| Day Percent Change: -6.84% Day Change: -0.82 | |
| Week Change: -12.61% Year-to-date Change: -56.3% | |
| SSTI Links: Profile News Message Board | |
| Charts:- Daily , Weekly | |
| Add SSTI to Watchlist: View: Get Complete SSTI Trend Analysis ➞ | |
 | AVXL Anavex Life Sciences Corp. |
| Sector: Health Care | |
| SubSector: Biotechnology | |
| MarketCap: 175.985 Millions | |
| Recent Price: 4.05 Smart Investing & Trading Score: 62 | |
| Day Percent Change: -3.80% Day Change: -0.16 | |
| Week Change: -0.74% Year-to-date Change: -56.5% | |
| AVXL Links: Profile News Message Board | |
| Charts:- Daily , Weekly | |
| Add AVXL to Watchlist: View: Get Complete AVXL Trend Analysis ➞ | |
 | SRRK Scholar Rock Holding Corporation |
| Sector: Health Care | |
| SubSector: Biotechnology | |
| MarketCap: 441.385 Millions | |
| Recent Price: 8.05 Smart Investing & Trading Score: 10 | |
| Day Percent Change: -4.28% Day Change: -0.36 | |
| Week Change: -4.73% Year-to-date Change: -57.2% | |
| SRRK Links: Profile News Message Board | |
| Charts:- Daily , Weekly | |
| Add SRRK to Watchlist: View: Get Complete SRRK Trend Analysis ➞ | |
 | FCEL FuelCell Energy, Inc. |
| Sector: Industrials | |
| SubSector: Industrial Electrical Equipment | |
| MarketCap: 347.079 Millions | |
| Recent Price: 0.65 Smart Investing & Trading Score: 0 | |
| Day Percent Change: -4.22% Day Change: -0.03 | |
| Week Change: -3.95% Year-to-date Change: -59.3% | |
| FCEL Links: Profile News Message Board | |
| Charts:- Daily , Weekly | |
| Add FCEL to Watchlist: View: Get Complete FCEL Trend Analysis ➞ | |
 | BTAI BioXcel Therapeutics, Inc. |
| Sector: Health Care | |
| SubSector: Biotechnology | |
| MarketCap: 487.485 Millions | |
| Recent Price: 1.20 Smart Investing & Trading Score: 42 | |
| Day Percent Change: 0.84% Day Change: 0.01 | |
| Week Change: 5.26% Year-to-date Change: -59.3% | |
| BTAI Links: Profile News Message Board | |
| Charts:- Daily , Weekly | |
| Add BTAI to Watchlist: View: Get Complete BTAI Trend Analysis ➞ | |
 | NRGV Energy Vault Holdings, Inc. |
| Sector: Utilities | |
| SubSector: Utilities - Renewable | |
| MarketCap: 364 Millions | |
| Recent Price: 0.94 Smart Investing & Trading Score: 15 | |
| Day Percent Change: -0.66% Day Change: -0.01 | |
| Week Change: -2.72% Year-to-date Change: -59.6% | |
| NRGV Links: Profile News Message Board | |
| Charts:- Daily , Weekly | |
| Add NRGV to Watchlist: View: Get Complete NRGV Trend Analysis ➞ | |
 | DOUG Douglas Elliman Inc. |
| Sector: Financials | |
| SubSector: Financials Services | |
| MarketCap: 197 Millions | |
| Recent Price: 1.16 Smart Investing & Trading Score: 42 | |
| Day Percent Change: 4.50% Day Change: 0.05 | |
| Week Change: 5.45% Year-to-date Change: -60.4% | |
| DOUG Links: Profile News Message Board | |
| Charts:- Daily , Weekly | |
| Add DOUG to Watchlist: View: Get Complete DOUG Trend Analysis ➞ | |
 | FRGE Forge Global Holdings, Inc. |
| Sector: Technology | |
| SubSector: Software - Application | |
| MarketCap: 426 Millions | |
| Recent Price: 1.37 Smart Investing & Trading Score: 25 | |
| Day Percent Change: -2.14% Day Change: -0.03 | |
| Week Change: 1.48% Year-to-date Change: -61.6% | |
| FRGE Links: Profile News Message Board | |
| Charts:- Daily , Weekly | |
| Add FRGE to Watchlist: View: Get Complete FRGE Trend Analysis ➞ | |
 | PLCE The Children s Place, Inc. |
| Sector: Services & Goods | |
| SubSector: Apparel Stores | |
| MarketCap: 303.608 Millions | |
| Recent Price: 8.77 Smart Investing & Trading Score: 59 | |
| Day Percent Change: 1.74% Day Change: 0.15 | |
| Week Change: 10.18% Year-to-date Change: -62.2% | |
| PLCE Links: Profile News Message Board | |
| Charts:- Daily , Weekly | |
| Add PLCE to Watchlist: View: Get Complete PLCE Trend Analysis ➞ | |
| For tabular summary view of above stock list: Summary View ➞ 0 - 25 , 25 - 50 , 50 - 75 , 75 - 100 , 100 - 125 , 125 - 150 , 150 - 175 , 175 - 200 , 200 - 225 , 225 - 250 , 250 - 275 , 275 - 300 , 300 - 325 , 325 - 350 , 350 - 375 , 375 - 400 , 400 - 425 , 425 - 450 , 450 - 475 , 475 - 500 , 500 - 525 | ||
| Click To Change The Sort Order: By Market Cap or Company Size Performance: Year-to-date, Week and Day | |
| Select Chart Type: | ||
| Too many stocks? View smallcap stocks filtered by marketcap & sector |
| Marketcap: All SmallCap Stocks (default-no microcap), Large, Mid-Range, Small & MicroCap |
| Sector: Tech, Finance, Energy, Staples, Retail, Industrial, Materials, Utilities & Medical |
|
Best Stocks Today 12Stocks.com |
© 2024 12Stocks.com Terms & Conditions Privacy Contact Us
All Information Provided Only For Education And Not To Be Used For Investing or Trading. See Terms & Conditions


One More Thing ... Get Best Stocks Delivered Daily!
Never Ever Miss A Move With Our Top Ten Stocks Lists
Find Best Stocks In Any Market - Bull or Bear Market
Take A Peek At Our Top Ten Stocks Lists: Daily, Weekly, Year-to-Date & Top Trends
Find Best Stocks In Any Market - Bull or Bear Market
Take A Peek At Our Top Ten Stocks Lists: Daily, Weekly, Year-to-Date & Top Trends
Smallcap Stocks With Best Up Trends [0-bearish to 100-bullish]: Enovix [100], Tellurian [100], Brightcove [100], NuScale Power[100], Fortress Transportation[100], Carvana Co[100], Repro Med[100], Eos Energy[100], Torrid [100], BRC [100], Ispire [100]
Best Smallcap Stocks Year-to-Date:
Dominion Midstream[461.92%], Workhorse Group[377.78%], 2U [352.85%], Avidity Biosciences[349.23%], CareMax [291.75%], Janux [285.95%], Virgin Galactic[255.51%], NuScale Power[240.16%], Longboard [232.9%], Summit [206.9%], Arcutis Bio[196.75%] Best Smallcap Stocks This Week:
Enovix [35.5%], Eos Energy[28.52%], Tellurian [27.2%], RXO [22.76%], Cara [19.57%], Brightcove [18.32%], Morphic Holding[17.81%], PDS [17.8%], ZimVie [17.17%], BARK [16.08%], Lindblad Expeditions[15.98%] Best Smallcap Stocks Daily:
Enovix [35.05%], ZimVie [22.72%], BARK [13.70%], KVH Industries[13.02%], Tellurian [10.75%], Brightcove [10.65%], DHI Group[9.81%], NuScale Power[9.48%], MicroStrategy [9.01%], Fortress Transportation[8.95%], Lindblad Expeditions[8.80%]