
 Login Sign Up


| |||||
 |  | ||||

| 12Stocks.com Market Intelligence |
Best SmallCap Stocks
|
| In a hurry? Small Cap Stock Lists: Performance Trends Table, Stock Charts
Sort Small Cap stocks: Daily, Weekly, Year-to-Date, Market Cap & Trends. Filter Small Cap stocks list by sector: Show all, Tech, Finance, Energy, Staples, Retail, Industrial, Materials, Utilities and HealthCare Filter Small Cap stocks list by size: All Large Medium Small and MicroCap |
| 12Stocks.com Small Cap Stocks Performances & Trends Daily | |||||||||
|
|  The overall Smart Investing & Trading Score is 42 (0-bearish to 100-bullish) which puts Small Cap index in short term neutral trend. The Smart Investing & Trading Score from previous trading session is 42 and hence an improvement of trend.
| ||||||||
Here are the Smart Investing & Trading Scores of the most requested small cap stocks at 12Stocks.com (click stock name for detailed review):
|


| 12Stocks.com: Investing in Smallcap Index with Stocks | |
|
The following table helps investors and traders sort through current performance and trends (as measured by Smart Investing & Trading Score) of various
stocks in the Smallcap Index. Quick View: Move mouse or cursor over stock symbol (ticker) to view short-term technical chart and over stock name to view long term chart. Click on  to add stock symbol to your watchlist and to add stock symbol to your watchlist and  to view watchlist. Click on any ticker or stock name for detailed market intelligence report for that stock. to view watchlist. Click on any ticker or stock name for detailed market intelligence report for that stock. |
12Stocks.com Performance of Stocks in Smallcap Index
| Ticker | Stock Name | Watchlist | Category | Recent Price | Smart Investing & Trading Score | Change % | YTD Change% |
| ONTF | ON24 |   | Technology | 5.72 | 42 | -0.52% | -27.46% |
| CCO | Clear Channel | | Services & Goods | 1.32 | 20 | -0.75% | -27.47% |
| EXTR | Extreme s | | Technology | 12.79 | 88 | -0.31% | -27.49% |
| ANGO | AngioDynamics | | Health Care | 5.68 | 20 | 0.35% | -27.55% |
| FLIC | First of Long Island | | Financials | 9.59 | 42 | -2.04% | -27.57% |
| SFST | Southern First | | Financials | 26.83 | 64 | 0.37% | -27.68% |
| FFIC | Flushing Financial | | Financials | 11.90 | 35 | -1.08% | -27.79% |
| ZURA | Zura Bio | | Health Care | 3.38 | 46 | 0.00% | -27.85% |
| TDUP | ThredUp | | Services & Goods | 1.63 | 17 | 1.88% | -27.88% |
| SGRY | Surgery Partners | | Health Care | 23.04 | 0 | -2.95% | -27.98% |
| GWH | ESS Tech | | Industrials | 0.82 | 95 | 3.26% | -28.16% |
| DOMO | Domo | | Technology | 7.38 | 67 | -0.67% | -28.28% |
| HLLY | Holley | | Services & Goods | 3.56 | 27 | -2.20% | -28.30% |
| GCO | Genesco | | Services & Goods | 25.16 | 35 | -0.20% | -28.54% |
| PLAY | Dave & Buster s Entertainment | | Services & Goods | 38.45 | 0 | -5.76% | -28.60% |
| MCB | Metropolitan Bank | | Financials | 39.52 | 68 | -1.86% | -28.64% |
| DLTH | Duluth | | Services & Goods | 3.83 | 57 | -1.03% | -28.81% |
| CWCO | Consolidated Water | | Utilities | 25.15 | 35 | -0.51% | -29.35% |
| FLGT | Fulgent Genetics | | Health Care | 20.39 | 67 | -1.31% | -29.47% |
| PGC | Peapack-Gladstone Financial | | Financials | 21.00 | 28 | 0.57% | -29.58% |
| EBTC | Enterprise Bancorp | | Financials | 22.67 | 10 | -0.44% | -29.73% |
| EVRI | Everi | | Services & Goods | 7.91 | 42 | -1.74% | -29.81% |
| MYE | Myers Industries | | Consumer Staples | 13.70 | 10 | -2.63% | -29.92% |
| DCOM | Dime Community | | Financials | 18.87 | 74 | 0.64% | -29.93% |
| STRO | Sutro Biopharma | | Health Care | 3.00 | 10 | -2.44% | -30.19% |
| For chart view version of above stock list: Chart View ➞ 0 - 25 , 25 - 50 , 50 - 75 , 75 - 100 , 100 - 125 , 125 - 150 , 150 - 175 , 175 - 200 , 200 - 225 , 225 - 250 , 250 - 275 , 275 - 300 , 300 - 325 , 325 - 350 , 350 - 375 , 375 - 400 , 400 - 425 , 425 - 450 , 450 - 475 , 475 - 500 , 500 - 525 | ||
 | Click To Change The Sort Order: By Market Cap or Company Size Performance: Year-to-date, Week and Day |  |
| Too many stocks? View smallcap stocks filtered by marketcap & sector |
| Marketcap: All SmallCap Stocks (default-no microcap), Large, Mid-Range, Small |
| Smallcap Sector: Tech, Finance, Energy, Staples, Retail, Industrial, Materials, & Medical |
|
Get the most comprehensive stock market coverage daily at 12Stocks.com ➞ Best Stocks Today ➞ Best Stocks Weekly ➞ Best Stocks Year-to-Date ➞ Best Stocks Trends ➞  Best Stocks Today 12Stocks.com Best Nasdaq Stocks ➞ Best S&P 500 Stocks ➞ Best Tech Stocks ➞ Best Biotech Stocks ➞ |
| Detailed Overview of SmallCap Stocks |
| SmallCap Technical Overview, Leaders & Laggards, Top SmallCap ETF Funds & Detailed SmallCap Stocks List, Charts, Trends & More |
| Smallcap: Technical Analysis, Trends & YTD Performance | |
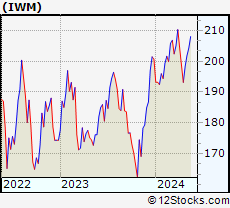
| SmallCap segment as represented by
IWM, an exchange-traded fund [ETF], holds basket of thousands of smallcap stocks from across all major sectors of the US stock market. The smallcap index (contains stocks like Riverbed & Sotheby's) is down by -0.07% and is currently underperforming the overall market by -13.36% year-to-date. Below is a quick view of technical charts and trends: | |
 IWM Weekly Chart |
|
| Long Term Trend: Not Good | |
| Medium Term Trend: Not Good | |
 IWM Daily Chart |
|
| Short Term Trend: Very Good | |
| Overall Trend Score: 42 | |
| YTD Performance: -0.07% | |
| **Trend Scores & Views Are Only For Educational Purposes And Not For Investing | |
| 12Stocks.com: Top Performing Small Cap Index Stocks | ||||||||||||||||||||||||||||||||||||||||||||||||
 The top performing Small Cap Index stocks year to date are
Now, more recently, over last week, the top performing Small Cap Index stocks on the move are


|
||||||||||||||||||||||||||||||||||||||||||||||||
| 12Stocks.com: Investing in Smallcap Index using Exchange Traded Funds | |
|
The following table shows list of key exchange traded funds (ETF) that
help investors track Smallcap index. The following list also includes leveraged ETF funds that track twice or thrice the daily returns of Smallcap indices. Short or inverse ETF funds move in the opposite direction to the index they track and are useful during market pullbacks or during bear markets. Quick View: Move mouse or cursor over ETF symbol (ticker) to view short-term technical chart and over ETF name to view long term chart. Click on ticker or stock name for detailed view. Click on to add stock symbol to your watchlist and to view watchlist. |
12Stocks.com List of ETFs that track Smallcap Index
| Ticker | ETF Name | Watchlist | Recent Price | Smart Investing & Trading Score | Change % | Week % | Year-to-date % |
| IWM | iShares Russell 2000 | | 200.56 | 42 | -0.31 | 0.1 | -0.07% |
| IJR | iShares Core S&P Small-Cap | | 105.25 | 25 | -0.86 | 0.02 | -2.77% |
| IWN | iShares Russell 2000 Value | | 150.09 | 25 | -0.68 | 0.25 | -3.37% |
| VTWO | Vanguard Russell 2000 ETF | | 81.33 | 42 | -0.31 | 0.12 | 0.28% |
| IWO | iShares Russell 2000 Growth | | 260.34 | 35 | 0.06 | 0.33 | 3.22% |
| IJS | iShares S&P Small-Cap 600 Value | | 95.88 | 25 | -1.19 | -0.31 | -6.98% |
| IJT | iShares S&P Small-Cap 600 Growth | | 126.91 | 25 | -0.45 | 0.06 | 1.41% |
| XSLV | PowerShares S&P SmallCap Low Volatil ETF | | 43.08 | 27 | -0.58 | -0.21 | -2.42% |
| SBB | ProShares Short SmallCap600 | | 16.61 | 81 | 1.34 | 0.44 | 4.27% |
| SMLV | SPDR SSGA US Small Cap Low Volatil ETF | | 107.14 | 15 | -0.92 | 0.15 | -4.78% |
| SAA | ProShares Ultra SmallCap600 | | 22.63 | 32 | -1.66 | -0.37 | -9.31% |
| SDD | ProShares UltraShort SmallCap600 | | 19.57 | 76 | 1.82 | 0.1 | 6.21% |
| 12Stocks.com: Charts, Trends, Fundamental Data and Performances of SmallCap Stocks | |
|
We now take in-depth look at all SmallCap stocks including charts, multi-period performances and overall trends (as measured by Smart Investing & Trading Score). One can sort SmallCap stocks (click link to choose) by Daily, Weekly and by Year-to-Date performances. Also, one can sort by size of the company or by market capitalization. |
| Select Your Default Chart Type: | |||||
| |||||
| Click on stock symbol or name for detailed view. Click on to add stock symbol to your watchlist and to view watchlist. Quick View: Move mouse or cursor over "Daily" to quickly view daily technical stock chart and over "Weekly" to view weekly technical stock chart. | |||||

 | ONTF ON24, Inc. |
| Sector: Technology | |
| SubSector: Software - Application | |
| MarketCap: 386 Millions | |
| Recent Price: 5.72 Smart Investing & Trading Score: 42 | |
| Day Percent Change: -0.52% Day Change: -0.03 | |
| Week Change: -2.22% Year-to-date Change: -27.5% | |
| ONTF Links: Profile News Message Board | |
| Charts:- Daily , Weekly | |
| Add ONTF to Watchlist: View: Get Complete ONTF Trend Analysis ➞ | |
 | CCO Clear Channel Outdoor Holdings, Inc. |
| Sector: Services & Goods | |
| SubSector: Marketing Services | |
| MarketCap: 312.715 Millions | |
| Recent Price: 1.32 Smart Investing & Trading Score: 20 | |
| Day Percent Change: -0.75% Day Change: -0.01 | |
| Week Change: -0.75% Year-to-date Change: -27.5% | |
| CCO Links: Profile News Message Board | |
| Charts:- Daily , Weekly | |
| Add CCO to Watchlist: View: Get Complete CCO Trend Analysis ➞ | |
 | EXTR Extreme Networks, Inc. |
| Sector: Technology | |
| SubSector: Communication Equipment | |
| MarketCap: 339.939 Millions | |
| Recent Price: 12.79 Smart Investing & Trading Score: 88 | |
| Day Percent Change: -0.31% Day Change: -0.04 | |
| Week Change: 1.11% Year-to-date Change: -27.5% | |
| EXTR Links: Profile News Message Board | |
| Charts:- Daily , Weekly | |
| Add EXTR to Watchlist: View: Get Complete EXTR Trend Analysis ➞ | |
 | ANGO AngioDynamics, Inc. |
| Sector: Health Care | |
| SubSector: Medical Instruments & Supplies | |
| MarketCap: 370.86 Millions | |
| Recent Price: 5.68 Smart Investing & Trading Score: 20 | |
| Day Percent Change: 0.35% Day Change: 0.02 | |
| Week Change: -3.4% Year-to-date Change: -27.6% | |
| ANGO Links: Profile News Message Board | |
| Charts:- Daily , Weekly | |
| Add ANGO to Watchlist: View: Get Complete ANGO Trend Analysis ➞ | |
 | FLIC The First of Long Island Corporation |
| Sector: Financials | |
| SubSector: Regional - Northeast Banks | |
| MarketCap: 352.899 Millions | |
| Recent Price: 9.59 Smart Investing & Trading Score: 42 | |
| Day Percent Change: -2.04% Day Change: -0.20 | |
| Week Change: -1.34% Year-to-date Change: -27.6% | |
| FLIC Links: Profile News Message Board | |
| Charts:- Daily , Weekly | |
| Add FLIC to Watchlist: View: Get Complete FLIC Trend Analysis ➞ | |
 | SFST Southern First Bancshares, Inc. |
| Sector: Financials | |
| SubSector: Money Center Banks | |
| MarketCap: 189.099 Millions | |
| Recent Price: 26.83 Smart Investing & Trading Score: 64 | |
| Day Percent Change: 0.37% Day Change: 0.10 | |
| Week Change: 1.25% Year-to-date Change: -27.7% | |
| SFST Links: Profile News Message Board | |
| Charts:- Daily , Weekly | |
| Add SFST to Watchlist: View: Get Complete SFST Trend Analysis ➞ | |
 | FFIC Flushing Financial Corporation |
| Sector: Financials | |
| SubSector: Savings & Loans | |
| MarketCap: 336.43 Millions | |
| Recent Price: 11.90 Smart Investing & Trading Score: 35 | |
| Day Percent Change: -1.08% Day Change: -0.13 | |
| Week Change: 0% Year-to-date Change: -27.8% | |
| FFIC Links: Profile News Message Board | |
| Charts:- Daily , Weekly | |
| Add FFIC to Watchlist: View: Get Complete FFIC Trend Analysis ➞ | |
 | ZURA Zura Bio Limited |
| Sector: Health Care | |
| SubSector: Biotechnology | |
| MarketCap: 242 Millions | |
| Recent Price: 3.38 Smart Investing & Trading Score: 46 | |
| Day Percent Change: 0.00% Day Change: 0.00 | |
| Week Change: -1.17% Year-to-date Change: -27.9% | |
| ZURA Links: Profile News Message Board | |
| Charts:- Daily , Weekly | |
| Add ZURA to Watchlist: View: Get Complete ZURA Trend Analysis ➞ | |
 | TDUP ThredUp Inc. |
| Sector: Services & Goods | |
| SubSector: Internet Retail | |
| MarketCap: 258 Millions | |
| Recent Price: 1.63 Smart Investing & Trading Score: 17 | |
| Day Percent Change: 1.88% Day Change: 0.03 | |
| Week Change: 0.62% Year-to-date Change: -27.9% | |
| TDUP Links: Profile News Message Board | |
| Charts:- Daily , Weekly | |
| Add TDUP to Watchlist: View: Get Complete TDUP Trend Analysis ➞ | |
 | SGRY Surgery Partners, Inc. |
| Sector: Health Care | |
| SubSector: Hospitals | |
| MarketCap: 328.446 Millions | |
| Recent Price: 23.04 Smart Investing & Trading Score: 0 | |
| Day Percent Change: -2.95% Day Change: -0.70 | |
| Week Change: -5.92% Year-to-date Change: -28.0% | |
| SGRY Links: Profile News Message Board | |
| Charts:- Daily , Weekly | |
| Add SGRY to Watchlist: View: Get Complete SGRY Trend Analysis ➞ | |
 | GWH ESS Tech, Inc. |
| Sector: Industrials | |
| SubSector: Electrical Equipment & Parts | |
| MarketCap: 239 Millions | |
| Recent Price: 0.82 Smart Investing & Trading Score: 95 | |
| Day Percent Change: 3.26% Day Change: 0.03 | |
| Week Change: 10.4% Year-to-date Change: -28.2% | |
| GWH Links: Profile News Message Board | |
| Charts:- Daily , Weekly | |
| Add GWH to Watchlist: View: Get Complete GWH Trend Analysis ➞ | |
 | DOMO Domo, Inc. |
| Sector: Technology | |
| SubSector: Application Software | |
| MarketCap: 247.062 Millions | |
| Recent Price: 7.38 Smart Investing & Trading Score: 67 | |
| Day Percent Change: -0.67% Day Change: -0.05 | |
| Week Change: 9.01% Year-to-date Change: -28.3% | |
| DOMO Links: Profile News Message Board | |
| Charts:- Daily , Weekly | |
| Add DOMO to Watchlist: View: Get Complete DOMO Trend Analysis ➞ | |
 | HLLY Holley Inc. |
| Sector: Services & Goods | |
| SubSector: Auto Parts | |
| MarketCap: 469 Millions | |
| Recent Price: 3.56 Smart Investing & Trading Score: 27 | |
| Day Percent Change: -2.20% Day Change: -0.08 | |
| Week Change: -0.28% Year-to-date Change: -28.3% | |
| HLLY Links: Profile News Message Board | |
| Charts:- Daily , Weekly | |
| Add HLLY to Watchlist: View: Get Complete HLLY Trend Analysis ➞ | |
 | GCO Genesco Inc. |
| Sector: Services & Goods | |
| SubSector: Apparel Stores | |
| MarketCap: 187.508 Millions | |
| Recent Price: 25.16 Smart Investing & Trading Score: 35 | |
| Day Percent Change: -0.20% Day Change: -0.05 | |
| Week Change: 1.74% Year-to-date Change: -28.5% | |
| GCO Links: Profile News Message Board | |
| Charts:- Daily , Weekly | |
| Add GCO to Watchlist: View: Get Complete GCO Trend Analysis ➞ | |
 | PLAY Dave & Buster s Entertainment, Inc. |
| Sector: Services & Goods | |
| SubSector: Restaurants | |
| MarketCap: 283.07 Millions | |
| Recent Price: 38.45 Smart Investing & Trading Score: 0 | |
| Day Percent Change: -5.76% Day Change: -2.35 | |
| Week Change: -6.2% Year-to-date Change: -28.6% | |
| PLAY Links: Profile News Message Board | |
| Charts:- Daily , Weekly | |
| Add PLAY to Watchlist: View: Get Complete PLAY Trend Analysis ➞ | |
 | MCB Metropolitan Bank Holding Corp. |
| Sector: Financials | |
| SubSector: Regional - Northeast Banks | |
| MarketCap: 212.999 Millions | |
| Recent Price: 39.52 Smart Investing & Trading Score: 68 | |
| Day Percent Change: -1.86% Day Change: -0.75 | |
| Week Change: 1.36% Year-to-date Change: -28.6% | |
| MCB Links: Profile News Message Board | |
| Charts:- Daily , Weekly | |
| Add MCB to Watchlist: View: Get Complete MCB Trend Analysis ➞ | |
 | DLTH Duluth Holdings Inc. |
| Sector: Services & Goods | |
| SubSector: Apparel Stores | |
| MarketCap: 180.008 Millions | |
| Recent Price: 3.83 Smart Investing & Trading Score: 57 | |
| Day Percent Change: -1.03% Day Change: -0.04 | |
| Week Change: -0.26% Year-to-date Change: -28.8% | |
| DLTH Links: Profile News Message Board | |
| Charts:- Daily , Weekly | |
| Add DLTH to Watchlist: View: Get Complete DLTH Trend Analysis ➞ | |
 | CWCO Consolidated Water Co. Ltd. |
| Sector: Utilities | |
| SubSector: Water Utilities | |
| MarketCap: 223.302 Millions | |
| Recent Price: 25.15 Smart Investing & Trading Score: 35 | |
| Day Percent Change: -0.51% Day Change: -0.13 | |
| Week Change: 0.34% Year-to-date Change: -29.4% | |
| CWCO Links: Profile News Message Board | |
| Charts:- Daily , Weekly | |
| Add CWCO to Watchlist: View: Get Complete CWCO Trend Analysis ➞ | |
 | FLGT Fulgent Genetics, Inc. |
| Sector: Health Care | |
| SubSector: Medical Laboratories & Research | |
| MarketCap: 222.2 Millions | |
| Recent Price: 20.39 Smart Investing & Trading Score: 67 | |
| Day Percent Change: -1.31% Day Change: -0.27 | |
| Week Change: 0.59% Year-to-date Change: -29.5% | |
| FLGT Links: Profile News Message Board | |
| Charts:- Daily , Weekly | |
| Add FLGT to Watchlist: View: Get Complete FLGT Trend Analysis ➞ | |
 | PGC Peapack-Gladstone Financial Corporation |
| Sector: Financials | |
| SubSector: Regional - Northeast Banks | |
| MarketCap: 284.399 Millions | |
| Recent Price: 21.00 Smart Investing & Trading Score: 28 | |
| Day Percent Change: 0.57% Day Change: 0.12 | |
| Week Change: -0.8% Year-to-date Change: -29.6% | |
| PGC Links: Profile News Message Board | |
| Charts:- Daily , Weekly | |
| Add PGC to Watchlist: View: Get Complete PGC Trend Analysis ➞ | |
 | EBTC Enterprise Bancorp, Inc. |
| Sector: Financials | |
| SubSector: Savings & Loans | |
| MarketCap: 304.53 Millions | |
| Recent Price: 22.67 Smart Investing & Trading Score: 10 | |
| Day Percent Change: -0.44% Day Change: -0.10 | |
| Week Change: -1.69% Year-to-date Change: -29.7% | |
| EBTC Links: Profile News Message Board | |
| Charts:- Daily , Weekly | |
| Add EBTC to Watchlist: View: Get Complete EBTC Trend Analysis ➞ | |
 | EVRI Everi Holdings Inc. |
| Sector: Services & Goods | |
| SubSector: Gaming Activities | |
| MarketCap: 273.389 Millions | |
| Recent Price: 7.91 Smart Investing & Trading Score: 42 | |
| Day Percent Change: -1.74% Day Change: -0.14 | |
| Week Change: -1.62% Year-to-date Change: -29.8% | |
| EVRI Links: Profile News Message Board | |
| Charts:- Daily , Weekly | |
| Add EVRI to Watchlist: View: Get Complete EVRI Trend Analysis ➞ | |
 | MYE Myers Industries, Inc. |
| Sector: Consumer Staples | |
| SubSector: Rubber & Plastics | |
| MarketCap: 347.57 Millions | |
| Recent Price: 13.70 Smart Investing & Trading Score: 10 | |
| Day Percent Change: -2.63% Day Change: -0.37 | |
| Week Change: -2.42% Year-to-date Change: -29.9% | |
| MYE Links: Profile News Message Board | |
| Charts:- Daily , Weekly | |
| Add MYE to Watchlist: View: Get Complete MYE Trend Analysis ➞ | |
 | DCOM Dime Community Bancshares, Inc. |
| Sector: Financials | |
| SubSector: Savings & Loans | |
| MarketCap: 477.83 Millions | |
| Recent Price: 18.87 Smart Investing & Trading Score: 74 | |
| Day Percent Change: 0.64% Day Change: 0.12 | |
| Week Change: 2.55% Year-to-date Change: -29.9% | |
| DCOM Links: Profile News Message Board | |
| Charts:- Daily , Weekly | |
| Add DCOM to Watchlist: View: Get Complete DCOM Trend Analysis ➞ | |
 | STRO Sutro Biopharma, Inc. |
| Sector: Health Care | |
| SubSector: Biotechnology | |
| MarketCap: 196.485 Millions | |
| Recent Price: 3.00 Smart Investing & Trading Score: 10 | |
| Day Percent Change: -2.44% Day Change: -0.07 | |
| Week Change: -7.28% Year-to-date Change: -30.2% | |
| STRO Links: Profile News Message Board | |
| Charts:- Daily , Weekly | |
| Add STRO to Watchlist: View: Get Complete STRO Trend Analysis ➞ | |
| For tabular summary view of above stock list: Summary View ➞ 0 - 25 , 25 - 50 , 50 - 75 , 75 - 100 , 100 - 125 , 125 - 150 , 150 - 175 , 175 - 200 , 200 - 225 , 225 - 250 , 250 - 275 , 275 - 300 , 300 - 325 , 325 - 350 , 350 - 375 , 375 - 400 , 400 - 425 , 425 - 450 , 450 - 475 , 475 - 500 , 500 - 525 | ||
| Click To Change The Sort Order: By Market Cap or Company Size Performance: Year-to-date, Week and Day | |
| Select Chart Type: | ||
| Too many stocks? View smallcap stocks filtered by marketcap & sector |
| Marketcap: All SmallCap Stocks (default-no microcap), Large, Mid-Range, Small & MicroCap |
| Sector: Tech, Finance, Energy, Staples, Retail, Industrial, Materials, Utilities & Medical |
|
Best Stocks Today 12Stocks.com |
© 2024 12Stocks.com Terms & Conditions Privacy Contact Us
All Information Provided Only For Education And Not To Be Used For Investing or Trading. See Terms & Conditions


One More Thing ... Get Best Stocks Delivered Daily!
Never Ever Miss A Move With Our Top Ten Stocks Lists
Find Best Stocks In Any Market - Bull or Bear Market
Take A Peek At Our Top Ten Stocks Lists: Daily, Weekly, Year-to-Date & Top Trends
Find Best Stocks In Any Market - Bull or Bear Market
Take A Peek At Our Top Ten Stocks Lists: Daily, Weekly, Year-to-Date & Top Trends
Smallcap Stocks With Best Up Trends [0-bearish to 100-bullish]: Enovix [100], Tellurian [100], Brightcove [100], NuScale Power[100], Fortress Transportation[100], Carvana Co[100], Repro Med[100], Eos Energy[100], Torrid [100], BRC [100], Ispire [100]
Best Smallcap Stocks Year-to-Date:
Dominion Midstream[461.92%], Workhorse Group[377.78%], 2U [352.85%], Avidity Biosciences[349.23%], CareMax [291.75%], Janux [285.95%], Virgin Galactic[255.51%], NuScale Power[240.16%], Longboard [232.9%], Summit [206.9%], Arcutis Bio[196.75%] Best Smallcap Stocks This Week:
Enovix [35.5%], Eos Energy[28.52%], Tellurian [27.2%], RXO [22.76%], Cara [19.57%], Brightcove [18.32%], Morphic Holding[17.81%], PDS [17.8%], ZimVie [17.17%], BARK [16.08%], Lindblad Expeditions[15.98%] Best Smallcap Stocks Daily:
Enovix [35.05%], ZimVie [22.72%], BARK [13.70%], KVH Industries[13.02%], Tellurian [10.75%], Brightcove [10.65%], DHI Group[9.81%], NuScale Power[9.48%], MicroStrategy [9.01%], Fortress Transportation[8.95%], Lindblad Expeditions[8.80%]