
 Login Sign Up


| |||||
 |  | ||||

| 12Stocks.com Market Intelligence |
Best SmallCap Stocks
|
| In a hurry? Small Cap Stock Lists: Performance Trends Table, Stock Charts
Sort Small Cap stocks: Daily, Weekly, Year-to-Date, Market Cap & Trends. Filter Small Cap stocks list by sector: Show all, Tech, Finance, Energy, Staples, Retail, Industrial, Materials, Utilities and HealthCare Filter Small Cap stocks list by size: All Large Medium Small and MicroCap |
| 12Stocks.com Small Cap Stocks Performances & Trends Daily | |||||||||
|
|  The overall Smart Investing & Trading Score is 80 (0-bearish to 100-bullish) which puts Small Cap index in short term neutral to bullish trend. The Smart Investing & Trading Score from previous trading session is 100 and hence a deterioration of trend.
| ||||||||
Here are the Smart Investing & Trading Scores of the most requested small cap stocks at 12Stocks.com (click stock name for detailed review):
|


| 12Stocks.com: Investing in Smallcap Index with Stocks | |
|
The following table helps investors and traders sort through current performance and trends (as measured by Smart Investing & Trading Score) of various
stocks in the Smallcap Index. Quick View: Move mouse or cursor over stock symbol (ticker) to view short-term technical chart and over stock name to view long term chart. Click on  to add stock symbol to your watchlist and to add stock symbol to your watchlist and  to view watchlist. Click on any ticker or stock name for detailed market intelligence report for that stock. to view watchlist. Click on any ticker or stock name for detailed market intelligence report for that stock. |
12Stocks.com Performance of Stocks in Smallcap Index
| Ticker | Stock Name | Watchlist | Category | Recent Price | Smart Investing & Trading Score | Change % | YTD Change% |
| PGEN | Precigen |   | Health Care | 4.55 | 100 | 13.40% | 225.00% |
| AMPX | Amprius | | Industrials | 7.30 | 51 | 0.74% | 142.50% |
| CDE | Coeur Mining | | Materials | 12.47 | 100 | 1.92% | 104.02% |
| BE | Bloom Energy | | Utilities | 50.85 | 100 | 0.72% | 101.85% |
| EVLV | Evolv | | Industrials | 8.38 | 60 | -1.88% | 98.23% |
| COOP | Mr. Cooper | | Financials | 190.98 | 50 | -1.16% | 91.06% |
| RYTM | Rhythm | | Health Care | 102.30 | 90 | 3.02% | 81.64% |
| STOK | Stoke | | Health Care | 19.30 | 70 | 1.86% | 78.42% |
| AKRO | Akero | | Health Care | 48.19 | 0 | 0.71% | 73.58% |
| KNSA | Kiniksa | | Health Care | 33.70 | 70 | 1.11% | 69.77% |
| MKTW | MarketWise | | Technology | 17.83 | 40 | -2.92% | 68.41% |
| SPNS | Sapiens | | Technology | 42.93 | 90 | 0.00% | 63.15% |
| LRN | K12 | | Services & Goods | 169.81 | 60 | 2.72% | 61.43% |
| PL | Planet Labs | | Industrials | 7.08 | 90 | 0.78% | 60.40% |
| AGX | Argan | | Industrials | 226.87 | 50 | 1.11% | 60.37% |
| DHC | Diversified Healthcare | | Financials | 3.80 | 90 | 0.00% | 56.65% |
| BASE | Couchbase | | Technology | 24.40 | 60 | -0.04% | 56.19% |
| CECO | Career Education | | Services & Goods | 46.80 | 60 | 3.05% | 54.12% |
| TRS | TriMas | | Industrials | 38.67 | 80 | 0.86% | 53.92% |
| PAHC | Phibro Animal | | Health Care | 32.20 | 100 | 1.32% | 51.74% |
| CMPO | CompoSecure | | Industrials | 19.86 | 60 | 1.37% | 51.42% |
| DY | Dycom Industries | | Industrials | 255.63 | 20 | 1.92% | 50.63% |
| ENTA | Enanta | | Health Care | 8.53 | 60 | -2.61% | 49.39% |
| SPTN | SpartanNash | | Consumer Staples | 26.80 | 90 | 0.19% | 48.71% |
| IAUX | i-80 Gold | | Materials | 0.76 | 100 | 6.31% | 48.29% |
| For chart view version of above stock list: Chart View ➞ 0 - 25 , 25 - 50 , 50 - 75 , 75 - 100 , 100 - 125 , 125 - 150 , 150 - 175 , 175 - 200 , 200 - 225 , 225 - 250 , 250 - 275 , 275 - 300 , 300 - 325 | ||
 | Click To Change The Sort Order: By Market Cap or Company Size Performance: Year-to-date, Week and Day |  |
| Too many stocks? View smallcap stocks filtered by marketcap & sector |
| Marketcap: All SmallCap Stocks (default-no microcap), Large, Mid-Range, Small |
| Smallcap Sector: Tech, Finance, Energy, Staples, Retail, Industrial, Materials, & Medical |
|
Get the most comprehensive stock market coverage daily at 12Stocks.com ➞ Best Stocks Today ➞ Best Stocks Weekly ➞ Best Stocks Year-to-Date ➞ Best Stocks Trends ➞  Best Stocks Today 12Stocks.com Best Nasdaq Stocks ➞ Best S&P 500 Stocks ➞ Best Tech Stocks ➞ Best Biotech Stocks ➞ |
| Detailed Overview of SmallCap Stocks |
| SmallCap Technical Overview, Leaders & Laggards, Top SmallCap ETF Funds & Detailed SmallCap Stocks List, Charts, Trends & More |
| Smallcap: Technical Analysis, Trends & YTD Performance | |
| SmallCap segment as represented by
IWM, an exchange-traded fund [ETF], holds basket of thousands of smallcap stocks from across all major sectors of the US stock market. The smallcap index (contains stocks like Riverbed & Sotheby's) is up by 4.36% and is currently underperforming the overall market by -2.9% year-to-date. Below is a quick view of technical charts and trends: | |
 IWM Weekly Chart |
|
| Long Term Trend: Very Good | |
| Medium Term Trend: Very Good | |
 IWM Daily Chart |
|
| Short Term Trend: Very Good | |
| Overall Trend Score: 80 | |
| YTD Performance: 4.36% | |
| **Trend Scores & Views Are Only For Educational Purposes And Not For Investing | |
| 12Stocks.com: Top Performing Small Cap Index Stocks | ||||||||||||||||||||||||||||||||||||||||||||||||
 The top performing Small Cap Index stocks year to date are
Now, more recently, over last week, the top performing Small Cap Index stocks on the move are


|
||||||||||||||||||||||||||||||||||||||||||||||||
| 12Stocks.com: Investing in Smallcap Index using Exchange Traded Funds | |
|
The following table shows list of key exchange traded funds (ETF) that
help investors track Smallcap index. The following list also includes leveraged ETF funds that track twice or thrice the daily returns of Smallcap indices. Short or inverse ETF funds move in the opposite direction to the index they track and are useful during market pullbacks or during bear markets. Quick View: Move mouse or cursor over ETF symbol (ticker) to view short-term technical chart and over ETF name to view long term chart. Click on ticker or stock name for detailed view. Click on to add stock symbol to your watchlist and to view watchlist. |
12Stocks.com List of ETFs that track Smallcap Index
| Ticker | ETF Name | Watchlist | Recent Price | Smart Investing & Trading Score | Change % | Week % | Year-to-date % |
| IWM | iShares Russell 2000 | | 235.17 | 80 | -0.44 | 0.14 | 4.36% |
| IJR | iShares Core S&P Small-Cap | | 118.76 | 100 | -0.08 | -0.89 | -0.29% |
| VTWO | Vanguard Russell 2000 ETF | | 95.43 | 80 | 0.24 | -0.93 | 2.92% |
| IWN | iShares Russell 2000 Value | | 174.53 | 100 | -0.01 | -0.85 | 2.1% |
| IWO | iShares Russell 2000 Growth | | 308.59 | 80 | 0.51 | -1.11 | 3.5% |
| IJS | iShares S&P Small-Cap 600 Value | | 110.04 | 100 | -0.22 | -0.99 | -2.29% |
| IJT | iShares S&P Small-Cap 600 Growth | | 141.94 | 70 | 0.05 | -0.89 | 1.68% |
| XSLV | PowerShares S&P SmallCap Low Volatil ETF | | 47.68 | 100 | -0.3 | -0.13 | -1.1% |
| SAA | ProShares Ultra SmallCap600 | | 25.65 | 100 | -0.31 | -2.17 | -8.34% |
| SMLV | SPDR SSGA US Small Cap Low Volatil ETF | | 133.28 | 100 | -0.09 | 2.75 | 2.13% |
| SDD | ProShares UltraShort SmallCap600 | | 13.29 | 30 | -100 | -100 | -100% |
| SBB | ProShares Short SmallCap600 | | 13.98 | 20 | 0.15 | 0.97 | 0.93% |
| 12Stocks.com: Charts, Trends, Fundamental Data and Performances of SmallCap Stocks | |
|
We now take in-depth look at all SmallCap stocks including charts, multi-period performances and overall trends (as measured by Smart Investing & Trading Score). One can sort SmallCap stocks (click link to choose) by Daily, Weekly and by Year-to-Date performances. Also, one can sort by size of the company or by market capitalization. |
| Select Your Default Chart Type: | |||||
| |||||
| Click on stock symbol or name for detailed view. Click on to add stock symbol to your watchlist and to view watchlist. Quick View: Move mouse or cursor over "Daily" to quickly view daily technical stock chart and over "Weekly" to view weekly technical stock chart. | |||||

 | PGEN Precigen, Inc. |
| Sector: Health Care | |
| SubSector: Biotechnology | |
| MarketCap: 564.785 Millions | |
| Recent Price: 4.55 Smart Investing & Trading Score: 100 | |
| Day Percent Change: 13.4% Day Change: 0.43 | |
| Week Change: 96.76% Year-to-date Change: 225.0% | |
| PGEN Links: Profile News Message Board | |
| Charts:- Daily , Weekly | |
| Add PGEN to Watchlist: View: Get Complete PGEN Trend Analysis ➞ | |
 | AMPX Amprius Technologies, Inc. |
| Sector: Industrials | |
| SubSector: Electrical Equipment & Parts | |
| MarketCap: 608 Millions | |
| Recent Price: 7.30 Smart Investing & Trading Score: 51 | |
| Day Percent Change: 0.74% Day Change: 0.05 | |
| Week Change: -8.74% Year-to-date Change: 142.5% | |
| AMPX Links: Profile News Message Board | |
| Charts:- Daily , Weekly | |
| Add AMPX to Watchlist: View: Get Complete AMPX Trend Analysis ➞ | |
 | CDE Coeur Mining, Inc. |
| Sector: Materials | |
| SubSector: Gold | |
| MarketCap: 853.219 Millions | |
| Recent Price: 12.47 Smart Investing & Trading Score: 100 | |
| Day Percent Change: 1.92% Day Change: 0.22 | |
| Week Change: 0.69% Year-to-date Change: 104.0% | |
| CDE Links: Profile News Message Board | |
| Charts:- Daily , Weekly | |
| Add CDE to Watchlist: View: Get Complete CDE Trend Analysis ➞ | |
 | BE Bloom Energy Corporation |
| Sector: Utilities | |
| SubSector: Electric Utilities | |
| MarketCap: 567.514 Millions | |
| Recent Price: 50.85 Smart Investing & Trading Score: 100 | |
| Day Percent Change: 0.72% Day Change: 0.32 | |
| Week Change: -0.62% Year-to-date Change: 101.9% | |
| BE Links: Profile News Message Board | |
| Charts:- Daily , Weekly | |
| Add BE to Watchlist: View: Get Complete BE Trend Analysis ➞ | |
 | EVLV Evolv Technologies Holdings, Inc. |
| Sector: Industrials | |
| SubSector: Security & Protection Services | |
| MarketCap: 853 Millions | |
| Recent Price: 8.38 Smart Investing & Trading Score: 60 | |
| Day Percent Change: -1.88% Day Change: -0.15 | |
| Week Change: 6.24% Year-to-date Change: 98.2% | |
| EVLV Links: Profile News Message Board | |
| Charts:- Daily , Weekly | |
| Add EVLV to Watchlist: View: Get Complete EVLV Trend Analysis ➞ | |
 | COOP Mr. Cooper Group Inc. |
| Sector: Financials | |
| SubSector: Savings & Loans | |
| MarketCap: 648.33 Millions | |
| Recent Price: 190.98 Smart Investing & Trading Score: 50 | |
| Day Percent Change: -1.16% Day Change: -2.14 | |
| Week Change: -5.25% Year-to-date Change: 91.1% | |
| COOP Links: Profile News Message Board | |
| Charts:- Daily , Weekly | |
| Add COOP to Watchlist: View: Get Complete COOP Trend Analysis ➞ | |
 | RYTM Rhythm Pharmaceuticals, Inc. |
| Sector: Health Care | |
| SubSector: Biotechnology | |
| MarketCap: 643.685 Millions | |
| Recent Price: 102.30 Smart Investing & Trading Score: 90 | |
| Day Percent Change: 3.02% Day Change: 2.98 | |
| Week Change: 5.39% Year-to-date Change: 81.6% | |
| RYTM Links: Profile News Message Board | |
| Charts:- Daily , Weekly | |
| Add RYTM to Watchlist: View: Get Complete RYTM Trend Analysis ➞ | |
 | STOK Stoke Therapeutics, Inc. |
| Sector: Health Care | |
| SubSector: Biotechnology | |
| MarketCap: 772.485 Millions | |
| Recent Price: 19.30 Smart Investing & Trading Score: 70 | |
| Day Percent Change: 1.86% Day Change: 0.36 | |
| Week Change: 14.62% Year-to-date Change: 78.4% | |
| STOK Links: Profile News Message Board | |
| Charts:- Daily , Weekly | |
| Add STOK to Watchlist: View: Get Complete STOK Trend Analysis ➞ | |
 | AKRO Akero Therapeutics, Inc. |
| Sector: Health Care | |
| SubSector: Biotechnology | |
| MarketCap: 675.085 Millions | |
| Recent Price: 48.19 Smart Investing & Trading Score: 0 | |
| Day Percent Change: 0.71% Day Change: 0.34 | |
| Week Change: -3.59% Year-to-date Change: 73.6% | |
| AKRO Links: Profile News Message Board | |
| Charts:- Daily , Weekly | |
| Add AKRO to Watchlist: View: Get Complete AKRO Trend Analysis ➞ | |
 | KNSA Kiniksa Pharmaceuticals, Ltd. |
| Sector: Health Care | |
| SubSector: Biotechnology | |
| MarketCap: 780.285 Millions | |
| Recent Price: 33.70 Smart Investing & Trading Score: 70 | |
| Day Percent Change: 1.11% Day Change: 0.37 | |
| Week Change: 0.9% Year-to-date Change: 69.8% | |
| KNSA Links: Profile News Message Board | |
| Charts:- Daily , Weekly | |
| Add KNSA to Watchlist: View: Get Complete KNSA Trend Analysis ➞ | |
 | MKTW MarketWise, Inc. |
| Sector: Technology | |
| SubSector: Software - Application | |
| MarketCap: 646 Millions | |
| Recent Price: 17.83 Smart Investing & Trading Score: 40 | |
| Day Percent Change: -2.92% Day Change: -0.53 | |
| Week Change: -11.07% Year-to-date Change: 68.4% | |
| MKTW Links: Profile News Message Board | |
| Charts:- Daily , Weekly | |
| Add MKTW to Watchlist: View: Get Complete MKTW Trend Analysis ➞ | |
 | SPNS Sapiens International Corporation N.V. |
| Sector: Technology | |
| SubSector: Business Software & Services | |
| MarketCap: 841.858 Millions | |
| Recent Price: 42.93 Smart Investing & Trading Score: 90 | |
| Day Percent Change: 0% Day Change: 0 | |
| Week Change: 0.09% Year-to-date Change: 63.2% | |
| SPNS Links: Profile News Message Board | |
| Charts:- Daily , Weekly | |
| Add SPNS to Watchlist: View: Get Complete SPNS Trend Analysis ➞ | |
 | LRN K12 Inc. |
| Sector: Services & Goods | |
| SubSector: Education & Training Services | |
| MarketCap: 549.606 Millions | |
| Recent Price: 169.81 Smart Investing & Trading Score: 60 | |
| Day Percent Change: 2.72% Day Change: 4.44 | |
| Week Change: 6.81% Year-to-date Change: 61.4% | |
| LRN Links: Profile News Message Board | |
| Charts:- Daily , Weekly | |
| Add LRN to Watchlist: View: Get Complete LRN Trend Analysis ➞ | |
 | PL Planet Labs PBC |
| Sector: Industrials | |
| SubSector: Aerospace & Defense | |
| MarketCap: 874 Millions | |
| Recent Price: 7.08 Smart Investing & Trading Score: 90 | |
| Day Percent Change: 0.78% Day Change: 0.05 | |
| Week Change: -4.99% Year-to-date Change: 60.4% | |
| PL Links: Profile News Message Board | |
| Charts:- Daily , Weekly | |
| Add PL to Watchlist: View: Get Complete PL Trend Analysis ➞ | |
 | AGX Argan, Inc. |
| Sector: Industrials | |
| SubSector: Heavy Construction | |
| MarketCap: 664.095 Millions | |
| Recent Price: 226.87 Smart Investing & Trading Score: 50 | |
| Day Percent Change: 1.11% Day Change: 2.4 | |
| Week Change: -2.78% Year-to-date Change: 60.4% | |
| AGX Links: Profile News Message Board | |
| Charts:- Daily , Weekly | |
| Add AGX to Watchlist: View: Get Complete AGX Trend Analysis ➞ | |
 | DHC Diversified Healthcare Trust |
| Sector: Financials | |
| SubSector: REIT - Healthcare Facilities | |
| MarketCap: 814.114 Millions | |
| Recent Price: 3.80 Smart Investing & Trading Score: 90 | |
| Day Percent Change: 0% Day Change: 0 | |
| Week Change: 2.3% Year-to-date Change: 56.7% | |
| DHC Links: Profile News Message Board | |
| Charts:- Daily , Weekly | |
| Add DHC to Watchlist: View: Get Complete DHC Trend Analysis ➞ | |
 | BASE Couchbase, Inc. |
| Sector: Technology | |
| SubSector: Software - Infrastructure | |
| MarketCap: 724 Millions | |
| Recent Price: 24.40 Smart Investing & Trading Score: 60 | |
| Day Percent Change: -0.04% Day Change: -0.01 | |
| Week Change: 0.08% Year-to-date Change: 56.2% | |
| BASE Links: Profile News Message Board | |
| Charts:- Daily , Weekly | |
| Add BASE to Watchlist: View: Get Complete BASE Trend Analysis ➞ | |
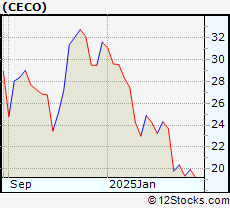 | CECO Career Education Corporation |
| Sector: Services & Goods | |
| SubSector: Education & Training Services | |
| MarketCap: 558.94 Millions | |
| Recent Price: 46.80 Smart Investing & Trading Score: 60 | |
| Day Percent Change: 3.05% Day Change: 1.38 | |
| Week Change: 4.34% Year-to-date Change: 54.1% | |
| CECO Links: Profile News Message Board | |
| Charts:- Daily , Weekly | |
| Add CECO to Watchlist: View: Get Complete CECO Trend Analysis ➞ | |
 | TRS TriMas Corporation |
| Sector: Industrials | |
| SubSector: Industrial Equipment & Components | |
| MarketCap: 963.509 Millions | |
| Recent Price: 38.67 Smart Investing & Trading Score: 80 | |
| Day Percent Change: 0.86% Day Change: 0.32 | |
| Week Change: 1.89% Year-to-date Change: 53.9% | |
| TRS Links: Profile News Message Board | |
| Charts:- Daily , Weekly | |
| Add TRS to Watchlist: View: Get Complete TRS Trend Analysis ➞ | |
 | PAHC Phibro Animal Health Corporation |
| Sector: Health Care | |
| SubSector: Specialized Health Services | |
| MarketCap: 852.956 Millions | |
| Recent Price: 32.20 Smart Investing & Trading Score: 100 | |
| Day Percent Change: 1.32% Day Change: 0.41 | |
| Week Change: 3.21% Year-to-date Change: 51.7% | |
| PAHC Links: Profile News Message Board | |
| Charts:- Daily , Weekly | |
| Add PAHC to Watchlist: View: Get Complete PAHC Trend Analysis ➞ | |
 | CMPO CompoSecure, Inc. |
| Sector: Industrials | |
| SubSector: Metal Fabrication | |
| MarketCap: 535 Millions | |
| Recent Price: 19.86 Smart Investing & Trading Score: 60 | |
| Day Percent Change: 1.37% Day Change: 0.26 | |
| Week Change: -0.87% Year-to-date Change: 51.4% | |
| CMPO Links: Profile News Message Board | |
| Charts:- Daily , Weekly | |
| Add CMPO to Watchlist: View: Get Complete CMPO Trend Analysis ➞ | |
 | DY Dycom Industries, Inc. |
| Sector: Industrials | |
| SubSector: Heavy Construction | |
| MarketCap: 576.295 Millions | |
| Recent Price: 255.63 Smart Investing & Trading Score: 20 | |
| Day Percent Change: 1.92% Day Change: 4.93 | |
| Week Change: -2.15% Year-to-date Change: 50.6% | |
| DY Links: Profile News Message Board | |
| Charts:- Daily , Weekly | |
| Add DY to Watchlist: View: Get Complete DY Trend Analysis ➞ | |
 | ENTA Enanta Pharmaceuticals, Inc. |
| Sector: Health Care | |
| SubSector: Biotechnology | |
| MarketCap: 998.385 Millions | |
| Recent Price: 8.53 Smart Investing & Trading Score: 60 | |
| Day Percent Change: -2.61% Day Change: -0.23 | |
| Week Change: 10.98% Year-to-date Change: 49.4% | |
| ENTA Links: Profile News Message Board | |
| Charts:- Daily , Weekly | |
| Add ENTA to Watchlist: View: Get Complete ENTA Trend Analysis ➞ | |
 | SPTN SpartanNash Company |
| Sector: Consumer Staples | |
| SubSector: Food Wholesale | |
| MarketCap: 671.229 Millions | |
| Recent Price: 26.80 Smart Investing & Trading Score: 90 | |
| Day Percent Change: 0.19% Day Change: 0.05 | |
| Week Change: 0.34% Year-to-date Change: 48.7% | |
| SPTN Links: Profile News Message Board | |
| Charts:- Daily , Weekly | |
| Add SPTN to Watchlist: View: Get Complete SPTN Trend Analysis ➞ | |
 | IAUX i-80 Gold Corp. |
| Sector: Materials | |
| SubSector: Gold | |
| MarketCap: 616 Millions | |
| Recent Price: 0.76 Smart Investing & Trading Score: 100 | |
| Day Percent Change: 6.31% Day Change: 0.04 | |
| Week Change: 12.09% Year-to-date Change: 48.3% | |
| IAUX Links: Profile News Message Board | |
| Charts:- Daily , Weekly | |
| Add IAUX to Watchlist: View: Get Complete IAUX Trend Analysis ➞ | |
| For tabular summary view of above stock list: Summary View ➞ 0 - 25 , 25 - 50 , 50 - 75 , 75 - 100 , 100 - 125 , 125 - 150 , 150 - 175 , 175 - 200 , 200 - 225 , 225 - 250 , 250 - 275 , 275 - 300 , 300 - 325 | ||
| Click To Change The Sort Order: By Market Cap or Company Size Performance: Year-to-date, Week and Day | |
| Select Chart Type: | ||
| Too many stocks? View smallcap stocks filtered by marketcap & sector |
| Marketcap: All SmallCap Stocks (default-no microcap), Large, Mid-Range, Small & MicroCap |
| Sector: Tech, Finance, Energy, Staples, Retail, Industrial, Materials, Utilities & Medical |
|
Best Stocks Today 12Stocks.com |
© 2025 12Stocks.com Terms & Conditions Privacy Contact Us
All Information Provided Only For Education And Not To Be Used For Investing or Trading. See Terms & Conditions


One More Thing ... Get Best Stocks Delivered Daily!
Never Ever Miss A Move With Our Top Ten Stocks Lists
Find Best Stocks In Any Market - Bull or Bear Market
Take A Peek At Our Top Ten Stocks Lists: Daily, Weekly, Year-to-Date & Top Trends
Find Best Stocks In Any Market - Bull or Bear Market
Take A Peek At Our Top Ten Stocks Lists: Daily, Weekly, Year-to-Date & Top Trends
Smallcap Stocks With Best Up Trends [0-bearish to 100-bullish]: Cato [100], ALX Oncology[100], Cooper-Standard [100], Precigen [100], Designer Brands[100], Babcock & Wilcox Enterprises[100], Design [100], Ironwood [100], Teekay Tankers[100], Green Plains[100], i-80 Gold[100]
Best Smallcap Stocks Year-to-Date:
Celcuity [284.87%], OptimizeRx [232.1%], Precigen [225%], CommScope Holding[195.39%], Willdan Group[179%], 908 Devices[173.64%], Centrus Energy[166.15%], nLIGHT [157.86%], Cooper-Standard [153.02%], Rigel [149.64%], Kratos Defense[145.56%] Best Smallcap Stocks This Week:
Precigen [96.76%], ALX Oncology[57.25%], Immuneering [52.3%], Plymouth Industrial[40.4%], Array [37.99%], Cato [34.15%], SelectQuote [30.15%], Karyopharm [29.46%], Zentalis [26.35%], Guess [25.88%], Shoals [25.49%] Best Smallcap Stocks Daily:
SelectQuote [41.53%], Immuneering [34.99%], Cato [34.15%], ALX Oncology[23.8%], Cooper-Standard [16.38%], Tyra Biosciences[14.26%], Zentalis [14.02%], Zura Bio[13.71%], X4 [13.57%], Precigen [13.4%], Mersana [11.25%]