
 Login Sign Up


| |||||
 |  | ||||

| 12Stocks.com Market Intelligence |
Best SmallCap Stocks
|
| In a hurry? Small Cap Stock Lists: Performance Trends Table, Stock Charts
Sort Small Cap stocks: Daily, Weekly, Year-to-Date, Market Cap & Trends. Filter Small Cap stocks list by sector: Show all, Tech, Finance, Energy, Staples, Retail, Industrial, Materials, Utilities and HealthCare Filter Small Cap stocks list by size: All Large Medium Small and MicroCap |
| 12Stocks.com Small Cap Stocks Performances & Trends Daily | |||||||||
|
|  The overall Smart Investing & Trading Score is 80 (0-bearish to 100-bullish) which puts Small Cap index in short term neutral to bullish trend. The Smart Investing & Trading Score from previous trading session is 100 and hence a deterioration of trend.
| ||||||||
Here are the Smart Investing & Trading Scores of the most requested small cap stocks at 12Stocks.com (click stock name for detailed review):
|


| 12Stocks.com: Investing in Smallcap Index with Stocks | |
|
The following table helps investors and traders sort through current performance and trends (as measured by Smart Investing & Trading Score) of various
stocks in the Smallcap Index. Quick View: Move mouse or cursor over stock symbol (ticker) to view short-term technical chart and over stock name to view long term chart. Click on  to add stock symbol to your watchlist and to add stock symbol to your watchlist and  to view watchlist. Click on any ticker or stock name for detailed market intelligence report for that stock. to view watchlist. Click on any ticker or stock name for detailed market intelligence report for that stock. |
12Stocks.com Performance of Stocks in Smallcap Index
| Ticker | Stock Name | Watchlist | Category | Recent Price | Smart Investing & Trading Score | Change % | Weekly Change% |
| PGEN | Precigen |   | Health Care | 4.55 | 100 | 13.40% | 96.76% |
| GES | Guess | | Services & Goods | 16.84 | 70 | -0.12% | 25.88% |
| RCKT | Rocket | | Health Care | 3.32 | 50 | -0.53% | 23.10% |
| MBI | MBIA | | Financials | 8.13 | 70 | 3.04% | 18.44% |
| STOK | Stoke | | Health Care | 19.30 | 70 | 1.86% | 14.62% |
| IAUX | i-80 Gold | | Materials | 0.76 | 100 | 6.31% | 12.09% |
| SST | System1 | | Industrials | 7.59 | 60 | 4.83% | 11.61% |
| AMRC | Ameresco | | Services & Goods | 24.54 | 80 | 0.35% | 11.37% |
| ENTA | Enanta | | Health Care | 8.53 | 60 | -2.61% | 10.98% |
| CIFR | Cipher Mining | | Financials | 6.99 | 100 | -0.84% | 10.90% |
| UONEK | Urban One | | Services & Goods | 0.82 | 60 | -1.32% | 10.62% |
| TYRA | Tyra Biosciences | | Health Care | 12.88 | 71 | 14.26% | 9.35% |
| OMER | Omeros | | Health Care | 4.25 | 30 | 6.92% | 8.74% |
| TNK | Teekay Tankers | | Transports | 48.18 | 100 | 7.26% | 8.58% |
| EHAB | Enhabit | | Health Care | 8.00 | 15 | -1.48% | 8.12% |
| UPWK | Upwork | | Technology | 14.80 | 90 | 4.12% | 7.96% |
| STNG | Scorpio Tankers | | Transports | 49.77 | 100 | 4.52% | 7.59% |
| INSW | Seaways | | Services & Goods | 44.74 | 100 | 5.35% | 7.20% |
| GLNG | Golar LNG | | Transports | 44.74 | 60 | 3.82% | 7.13% |
| LRN | K12 | | Services & Goods | 169.81 | 60 | 2.72% | 6.81% |
| COLL | Collegium Pharmaceutical | | Health Care | 38.79 | 70 | 3.00% | 6.35% |
| VERA | Vera | | Health Care | 22.02 | 30 | 2.31% | 6.30% |
| EVLV | Evolv | | Industrials | 8.38 | 60 | -1.88% | 6.24% |
| BMEA | Biomea Fusion | | Health Care | 1.86 | 90 | 0.84% | 6.21% |
| RXST | RxSight | | Health Care | 8.55 | 70 | 3.31% | 6.20% |
| For chart view version of above stock list: Chart View ➞ 0 - 25 , 25 - 50 , 50 - 75 , 75 - 100 , 100 - 125 , 125 - 150 , 150 - 175 , 175 - 200 , 200 - 225 , 225 - 250 , 250 - 275 , 275 - 300 , 300 - 325 | ||
 | Click To Change The Sort Order: By Market Cap or Company Size Performance: Year-to-date, Week and Day |  |
| Too many stocks? View smallcap stocks filtered by marketcap & sector |
| Marketcap: All SmallCap Stocks (default-no microcap), Large, Mid-Range, Small |
| Smallcap Sector: Tech, Finance, Energy, Staples, Retail, Industrial, Materials, & Medical |
|
Get the most comprehensive stock market coverage daily at 12Stocks.com ➞ Best Stocks Today ➞ Best Stocks Weekly ➞ Best Stocks Year-to-Date ➞ Best Stocks Trends ➞  Best Stocks Today 12Stocks.com Best Nasdaq Stocks ➞ Best S&P 500 Stocks ➞ Best Tech Stocks ➞ Best Biotech Stocks ➞ |
| Detailed Overview of SmallCap Stocks |
| SmallCap Technical Overview, Leaders & Laggards, Top SmallCap ETF Funds & Detailed SmallCap Stocks List, Charts, Trends & More |
| Smallcap: Technical Analysis, Trends & YTD Performance | |
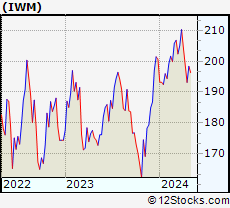
| SmallCap segment as represented by
IWM, an exchange-traded fund [ETF], holds basket of thousands of smallcap stocks from across all major sectors of the US stock market. The smallcap index (contains stocks like Riverbed & Sotheby's) is up by 4.36% and is currently underperforming the overall market by -2.9% year-to-date. Below is a quick view of technical charts and trends: | |
 IWM Weekly Chart |
|
| Long Term Trend: Very Good | |
| Medium Term Trend: Very Good | |
 IWM Daily Chart |
|
| Short Term Trend: Very Good | |
| Overall Trend Score: 80 | |
| YTD Performance: 4.36% | |
| **Trend Scores & Views Are Only For Educational Purposes And Not For Investing | |
| 12Stocks.com: Top Performing Small Cap Index Stocks | ||||||||||||||||||||||||||||||||||||||||||||||||
 The top performing Small Cap Index stocks year to date are
Now, more recently, over last week, the top performing Small Cap Index stocks on the move are


|
||||||||||||||||||||||||||||||||||||||||||||||||
| 12Stocks.com: Investing in Smallcap Index using Exchange Traded Funds | |
|
The following table shows list of key exchange traded funds (ETF) that
help investors track Smallcap index. The following list also includes leveraged ETF funds that track twice or thrice the daily returns of Smallcap indices. Short or inverse ETF funds move in the opposite direction to the index they track and are useful during market pullbacks or during bear markets. Quick View: Move mouse or cursor over ETF symbol (ticker) to view short-term technical chart and over ETF name to view long term chart. Click on ticker or stock name for detailed view. Click on to add stock symbol to your watchlist and to view watchlist. |
12Stocks.com List of ETFs that track Smallcap Index
| Ticker | ETF Name | Watchlist | Recent Price | Smart Investing & Trading Score | Change % | Week % | Year-to-date % |
| IWM | iShares Russell 2000 | | 235.17 | 80 | -0.44 | 0.14 | 4.36% |
| IJR | iShares Core S&P Small-Cap | | 118.76 | 100 | -0.08 | -0.89 | -0.29% |
| VTWO | Vanguard Russell 2000 ETF | | 95.43 | 80 | 0.24 | -0.93 | 2.92% |
| IWN | iShares Russell 2000 Value | | 174.53 | 100 | -0.01 | -0.85 | 2.1% |
| IWO | iShares Russell 2000 Growth | | 308.59 | 80 | 0.51 | -1.11 | 3.5% |
| IJS | iShares S&P Small-Cap 600 Value | | 110.04 | 100 | -0.22 | -0.99 | -2.29% |
| IJT | iShares S&P Small-Cap 600 Growth | | 141.94 | 70 | 0.05 | -0.89 | 1.68% |
| XSLV | PowerShares S&P SmallCap Low Volatil ETF | | 47.68 | 100 | -0.3 | -0.13 | -1.1% |
| SAA | ProShares Ultra SmallCap600 | | 25.65 | 100 | -0.31 | -2.17 | -8.34% |
| SMLV | SPDR SSGA US Small Cap Low Volatil ETF | | 133.28 | 100 | -0.09 | 2.75 | 2.13% |
| SDD | ProShares UltraShort SmallCap600 | | 13.29 | 30 | -100 | -100 | -100% |
| SBB | ProShares Short SmallCap600 | | 13.98 | 20 | 0.15 | 0.97 | 0.93% |
| 12Stocks.com: Charts, Trends, Fundamental Data and Performances of SmallCap Stocks | |
|
We now take in-depth look at all SmallCap stocks including charts, multi-period performances and overall trends (as measured by Smart Investing & Trading Score). One can sort SmallCap stocks (click link to choose) by Daily, Weekly and by Year-to-Date performances. Also, one can sort by size of the company or by market capitalization. |
| Select Your Default Chart Type: | |||||
| |||||
| Click on stock symbol or name for detailed view. Click on to add stock symbol to your watchlist and to view watchlist. Quick View: Move mouse or cursor over "Daily" to quickly view daily technical stock chart and over "Weekly" to view weekly technical stock chart. | |||||

 | PGEN Precigen, Inc. |
| Sector: Health Care | |
| SubSector: Biotechnology | |
| MarketCap: 564.785 Millions | |
| Recent Price: 4.55 Smart Investing & Trading Score: 100 | |
| Day Percent Change: 13.4% Day Change: 0.43 | |
| Week Change: 96.76% Year-to-date Change: 225.0% | |
| PGEN Links: Profile News Message Board | |
| Charts:- Daily , Weekly | |
| Add PGEN to Watchlist: View: Get Complete PGEN Trend Analysis ➞ | |
 | GES Guess , Inc. |
| Sector: Services & Goods | |
| SubSector: Apparel Stores | |
| MarketCap: 591.908 Millions | |
| Recent Price: 16.84 Smart Investing & Trading Score: 70 | |
| Day Percent Change: -0.12% Day Change: -0.02 | |
| Week Change: 25.88% Year-to-date Change: 26.7% | |
| GES Links: Profile News Message Board | |
| Charts:- Daily , Weekly | |
| Add GES to Watchlist: View: Get Complete GES Trend Analysis ➞ | |
 | RCKT Rocket Pharmaceuticals, Inc. |
| Sector: Health Care | |
| SubSector: Biotechnology | |
| MarketCap: 899.585 Millions | |
| Recent Price: 3.32 Smart Investing & Trading Score: 50 | |
| Day Percent Change: -0.53% Day Change: -0.02 | |
| Week Change: 23.1% Year-to-date Change: -70.3% | |
| RCKT Links: Profile News Message Board | |
| Charts:- Daily , Weekly | |
| Add RCKT to Watchlist: View: Get Complete RCKT Trend Analysis ➞ | |
 | MBI MBIA Inc. |
| Sector: Financials | |
| SubSector: Property & Casualty Insurance | |
| MarketCap: 539.012 Millions | |
| Recent Price: 8.13 Smart Investing & Trading Score: 70 | |
| Day Percent Change: 3.04% Day Change: 0.22 | |
| Week Change: 18.44% Year-to-date Change: 15.3% | |
| MBI Links: Profile News Message Board | |
| Charts:- Daily , Weekly | |
| Add MBI to Watchlist: View: Get Complete MBI Trend Analysis ➞ | |
 | STOK Stoke Therapeutics, Inc. |
| Sector: Health Care | |
| SubSector: Biotechnology | |
| MarketCap: 772.485 Millions | |
| Recent Price: 19.30 Smart Investing & Trading Score: 70 | |
| Day Percent Change: 1.86% Day Change: 0.36 | |
| Week Change: 14.62% Year-to-date Change: 78.4% | |
| STOK Links: Profile News Message Board | |
| Charts:- Daily , Weekly | |
| Add STOK to Watchlist: View: Get Complete STOK Trend Analysis ➞ | |
 | IAUX i-80 Gold Corp. |
| Sector: Materials | |
| SubSector: Gold | |
| MarketCap: 616 Millions | |
| Recent Price: 0.76 Smart Investing & Trading Score: 100 | |
| Day Percent Change: 6.31% Day Change: 0.04 | |
| Week Change: 12.09% Year-to-date Change: 48.3% | |
| IAUX Links: Profile News Message Board | |
| Charts:- Daily , Weekly | |
| Add IAUX to Watchlist: View: Get Complete IAUX Trend Analysis ➞ | |
 | SST System1, Inc. |
| Sector: Industrials | |
| SubSector: Specialty Business Services | |
| MarketCap: 504 Millions | |
| Recent Price: 7.59 Smart Investing & Trading Score: 60 | |
| Day Percent Change: 4.83% Day Change: 0.31 | |
| Week Change: 11.61% Year-to-date Change: -25.1% | |
| SST Links: Profile News Message Board | |
| Charts:- Daily , Weekly | |
| Add SST to Watchlist: View: Get Complete SST Trend Analysis ➞ | |
 | AMRC Ameresco, Inc. |
| Sector: Services & Goods | |
| SubSector: Technical Services | |
| MarketCap: 898.91 Millions | |
| Recent Price: 24.54 Smart Investing & Trading Score: 80 | |
| Day Percent Change: 0.35% Day Change: 0.08 | |
| Week Change: 11.37% Year-to-date Change: -3.2% | |
| AMRC Links: Profile News Message Board | |
| Charts:- Daily , Weekly | |
| Add AMRC to Watchlist: View: Get Complete AMRC Trend Analysis ➞ | |
 | ENTA Enanta Pharmaceuticals, Inc. |
| Sector: Health Care | |
| SubSector: Biotechnology | |
| MarketCap: 998.385 Millions | |
| Recent Price: 8.53 Smart Investing & Trading Score: 60 | |
| Day Percent Change: -2.61% Day Change: -0.23 | |
| Week Change: 10.98% Year-to-date Change: 49.4% | |
| ENTA Links: Profile News Message Board | |
| Charts:- Daily , Weekly | |
| Add ENTA to Watchlist: View: Get Complete ENTA Trend Analysis ➞ | |
 | CIFR Cipher Mining Inc. |
| Sector: Financials | |
| SubSector: Capital Markets | |
| MarketCap: 712 Millions | |
| Recent Price: 6.99 Smart Investing & Trading Score: 100 | |
| Day Percent Change: -0.84% Day Change: -0.05 | |
| Week Change: 10.9% Year-to-date Change: 27.2% | |
| CIFR Links: Profile News Message Board | |
| Charts:- Daily , Weekly | |
| Add CIFR to Watchlist: View: Get Complete CIFR Trend Analysis ➞ | |
 | UONEK Urban One, Inc. |
| Sector: Services & Goods | |
| SubSector: Broadcasting - Radio | |
| MarketCap: 601.795 Millions | |
| Recent Price: 0.82 Smart Investing & Trading Score: 60 | |
| Day Percent Change: -1.32% Day Change: -0.01 | |
| Week Change: 10.62% Year-to-date Change: -24.6% | |
| UONEK Links: Profile News Message Board | |
| Charts:- Daily , Weekly | |
| Add UONEK to Watchlist: View: Get Complete UONEK Trend Analysis ➞ | |
 | TYRA Tyra Biosciences, Inc. |
| Sector: Health Care | |
| SubSector: Biotechnology | |
| MarketCap: 732 Millions | |
| Recent Price: 12.88 Smart Investing & Trading Score: 71 | |
| Day Percent Change: 14.26% Day Change: 1.46 | |
| Week Change: 9.35% Year-to-date Change: -15.8% | |
| TYRA Links: Profile News Message Board | |
| Charts:- Daily , Weekly | |
| Add TYRA to Watchlist: View: Get Complete TYRA Trend Analysis ➞ | |
 | OMER Omeros Corporation |
| Sector: Health Care | |
| SubSector: Biotechnology | |
| MarketCap: 759.585 Millions | |
| Recent Price: 4.25 Smart Investing & Trading Score: 30 | |
| Day Percent Change: 6.92% Day Change: 0.29 | |
| Week Change: 8.74% Year-to-date Change: -54.7% | |
| OMER Links: Profile News Message Board | |
| Charts:- Daily , Weekly | |
| Add OMER to Watchlist: View: Get Complete OMER Trend Analysis ➞ | |
 | TNK Teekay Tankers Ltd. |
| Sector: Transports | |
| SubSector: Shipping | |
| MarketCap: 584.714 Millions | |
| Recent Price: 48.18 Smart Investing & Trading Score: 100 | |
| Day Percent Change: 7.26% Day Change: 3.24 | |
| Week Change: 8.58% Year-to-date Change: 24.4% | |
| TNK Links: Profile News Message Board | |
| Charts:- Daily , Weekly | |
| Add TNK to Watchlist: View: Get Complete TNK Trend Analysis ➞ | |
 | EHAB Enhabit, Inc. |
| Sector: Health Care | |
| SubSector: Medical Care Facilities | |
| MarketCap: 569 Millions | |
| Recent Price: 8.00 Smart Investing & Trading Score: 15 | |
| Day Percent Change: -1.48% Day Change: -0.12 | |
| Week Change: 8.12% Year-to-date Change: 2.3% | |
| EHAB Links: Profile News Message Board | |
| Charts:- Daily , Weekly | |
| Add EHAB to Watchlist: View: Get Complete EHAB Trend Analysis ➞ | |
 | UPWK Upwork Inc. |
| Sector: Technology | |
| SubSector: Internet Information Providers | |
| MarketCap: 815.98 Millions | |
| Recent Price: 14.80 Smart Investing & Trading Score: 90 | |
| Day Percent Change: 4.12% Day Change: 0.58 | |
| Week Change: 7.96% Year-to-date Change: -9.5% | |
| UPWK Links: Profile News Message Board | |
| Charts:- Daily , Weekly | |
| Add UPWK to Watchlist: View: Get Complete UPWK Trend Analysis ➞ | |
 | STNG Scorpio Tankers Inc. |
| Sector: Transports | |
| SubSector: Shipping | |
| MarketCap: 813.214 Millions | |
| Recent Price: 49.77 Smart Investing & Trading Score: 100 | |
| Day Percent Change: 4.52% Day Change: 2.09 | |
| Week Change: 7.59% Year-to-date Change: -0.8% | |
| STNG Links: Profile News Message Board | |
| Charts:- Daily , Weekly | |
| Add STNG to Watchlist: View: Get Complete STNG Trend Analysis ➞ | |
 | INSW International Seaways, Inc. |
| Sector: Services & Goods | |
| SubSector: Business Services | |
| MarketCap: 521.582 Millions | |
| Recent Price: 44.74 Smart Investing & Trading Score: 100 | |
| Day Percent Change: 5.35% Day Change: 2.26 | |
| Week Change: 7.2% Year-to-date Change: 28.5% | |
| INSW Links: Profile News Message Board | |
| Charts:- Daily , Weekly | |
| Add INSW to Watchlist: View: Get Complete INSW Trend Analysis ➞ | |
 | GLNG Golar LNG Limited |
| Sector: Transports | |
| SubSector: Shipping | |
| MarketCap: 854.414 Millions | |
| Recent Price: 44.74 Smart Investing & Trading Score: 60 | |
| Day Percent Change: 3.82% Day Change: 1.59 | |
| Week Change: 7.13% Year-to-date Change: 3.7% | |
| GLNG Links: Profile News Message Board | |
| Charts:- Daily , Weekly | |
| Add GLNG to Watchlist: View: Get Complete GLNG Trend Analysis ➞ | |
 | LRN K12 Inc. |
| Sector: Services & Goods | |
| SubSector: Education & Training Services | |
| MarketCap: 549.606 Millions | |
| Recent Price: 169.81 Smart Investing & Trading Score: 60 | |
| Day Percent Change: 2.72% Day Change: 4.44 | |
| Week Change: 6.81% Year-to-date Change: 61.4% | |
| LRN Links: Profile News Message Board | |
| Charts:- Daily , Weekly | |
| Add LRN to Watchlist: View: Get Complete LRN Trend Analysis ➞ | |
 | COLL Collegium Pharmaceutical, Inc. |
| Sector: Health Care | |
| SubSector: Drugs - Generic | |
| MarketCap: 569.185 Millions | |
| Recent Price: 38.79 Smart Investing & Trading Score: 70 | |
| Day Percent Change: 3% Day Change: 1.15 | |
| Week Change: 6.35% Year-to-date Change: 37.9% | |
| COLL Links: Profile News Message Board | |
| Charts:- Daily , Weekly | |
| Add COLL to Watchlist: View: Get Complete COLL Trend Analysis ➞ | |
 | VERA Vera Therapeutics, Inc. |
| Sector: Health Care | |
| SubSector: Biotechnology | |
| MarketCap: 746 Millions | |
| Recent Price: 22.02 Smart Investing & Trading Score: 30 | |
| Day Percent Change: 2.31% Day Change: 0.51 | |
| Week Change: 6.3% Year-to-date Change: -46.5% | |
| VERA Links: Profile News Message Board | |
| Charts:- Daily , Weekly | |
| Add VERA to Watchlist: View: Get Complete VERA Trend Analysis ➞ | |
 | EVLV Evolv Technologies Holdings, Inc. |
| Sector: Industrials | |
| SubSector: Security & Protection Services | |
| MarketCap: 853 Millions | |
| Recent Price: 8.38 Smart Investing & Trading Score: 60 | |
| Day Percent Change: -1.88% Day Change: -0.15 | |
| Week Change: 6.24% Year-to-date Change: 98.2% | |
| EVLV Links: Profile News Message Board | |
| Charts:- Daily , Weekly | |
| Add EVLV to Watchlist: View: Get Complete EVLV Trend Analysis ➞ | |
 | BMEA Biomea Fusion, Inc. |
| Sector: Health Care | |
| SubSector: Biotechnology | |
| MarketCap: 818 Millions | |
| Recent Price: 1.86 Smart Investing & Trading Score: 90 | |
| Day Percent Change: 0.84% Day Change: 0.01 | |
| Week Change: 6.21% Year-to-date Change: -53.7% | |
| BMEA Links: Profile News Message Board | |
| Charts:- Daily , Weekly | |
| Add BMEA to Watchlist: View: Get Complete BMEA Trend Analysis ➞ | |
 | RXST RxSight, Inc. |
| Sector: Health Care | |
| SubSector: Medical Devices | |
| MarketCap: 893 Millions | |
| Recent Price: 8.55 Smart Investing & Trading Score: 70 | |
| Day Percent Change: 3.31% Day Change: 0.28 | |
| Week Change: 6.2% Year-to-date Change: -74.6% | |
| RXST Links: Profile News Message Board | |
| Charts:- Daily , Weekly | |
| Add RXST to Watchlist: View: Get Complete RXST Trend Analysis ➞ | |
| For tabular summary view of above stock list: Summary View ➞ 0 - 25 , 25 - 50 , 50 - 75 , 75 - 100 , 100 - 125 , 125 - 150 , 150 - 175 , 175 - 200 , 200 - 225 , 225 - 250 , 250 - 275 , 275 - 300 , 300 - 325 | ||
| Click To Change The Sort Order: By Market Cap or Company Size Performance: Year-to-date, Week and Day | |
| Select Chart Type: | ||
| Too many stocks? View smallcap stocks filtered by marketcap & sector |
| Marketcap: All SmallCap Stocks (default-no microcap), Large, Mid-Range, Small & MicroCap |
| Sector: Tech, Finance, Energy, Staples, Retail, Industrial, Materials, Utilities & Medical |
|
Best Stocks Today 12Stocks.com |
© 2025 12Stocks.com Terms & Conditions Privacy Contact Us
All Information Provided Only For Education And Not To Be Used For Investing or Trading. See Terms & Conditions


One More Thing ... Get Best Stocks Delivered Daily!
Never Ever Miss A Move With Our Top Ten Stocks Lists
Find Best Stocks In Any Market - Bull or Bear Market
Take A Peek At Our Top Ten Stocks Lists: Daily, Weekly, Year-to-Date & Top Trends
Find Best Stocks In Any Market - Bull or Bear Market
Take A Peek At Our Top Ten Stocks Lists: Daily, Weekly, Year-to-Date & Top Trends
Smallcap Stocks With Best Up Trends [0-bearish to 100-bullish]: Cato [100], ALX Oncology[100], Cooper-Standard [100], Precigen [100], Designer Brands[100], Babcock & Wilcox Enterprises[100], Design [100], Ironwood [100], Teekay Tankers[100], Green Plains[100], i-80 Gold[100]
Best Smallcap Stocks Year-to-Date:
Celcuity [284.87%], OptimizeRx [232.1%], Precigen [225%], CommScope Holding[195.39%], Willdan Group[179%], 908 Devices[173.64%], Centrus Energy[166.15%], nLIGHT [157.86%], Cooper-Standard [153.02%], Rigel [149.64%], Kratos Defense[145.56%] Best Smallcap Stocks This Week:
Precigen [96.76%], ALX Oncology[57.25%], Immuneering [52.3%], Plymouth Industrial[40.4%], Array [37.99%], Cato [34.15%], SelectQuote [30.15%], Karyopharm [29.46%], Zentalis [26.35%], Guess [25.88%], Shoals [25.49%] Best Smallcap Stocks Daily:
SelectQuote [41.53%], Immuneering [34.99%], Cato [34.15%], ALX Oncology[23.8%], Cooper-Standard [16.38%], Tyra Biosciences[14.26%], Zentalis [14.02%], Zura Bio[13.71%], X4 [13.57%], Precigen [13.4%], Mersana [11.25%]