
 Login Sign Up


| |||||
 |  | ||||

| 12Stocks.com Market Intelligence |
Best SmallCap Stocks
|
| In a hurry? Small Cap Stock Lists: Performance Trends Table, Stock Charts
Sort Small Cap stocks: Daily, Weekly, Year-to-Date, Market Cap & Trends. Filter Small Cap stocks list by sector: Show all, Tech, Finance, Energy, Staples, Retail, Industrial, Materials, Utilities and HealthCare Filter Small Cap stocks list by size: All Large Medium Small and MicroCap |
| 12Stocks.com Small Cap Stocks Performances & Trends Daily | |||||||||
|
|  The overall Smart Investing & Trading Score is 18 (0-bearish to 100-bullish) which puts Small Cap index in short term bearish trend. The Smart Investing & Trading Score from previous trading session is 32 and hence a deterioration of trend.
| ||||||||
Here are the Smart Investing & Trading Scores of the most requested small cap stocks at 12Stocks.com (click stock name for detailed review):
|


| 12Stocks.com: Investing in Smallcap Index with Stocks | |
|
The following table helps investors and traders sort through current performance and trends (as measured by Smart Investing & Trading Score) of various
stocks in the Smallcap Index. Quick View: Move mouse or cursor over stock symbol (ticker) to view short-term technical chart and over stock name to view long term chart. Click on  to add stock symbol to your watchlist and to add stock symbol to your watchlist and  to view watchlist. Click on any ticker or stock name for detailed market intelligence report for that stock. to view watchlist. Click on any ticker or stock name for detailed market intelligence report for that stock. |
12Stocks.com Performance of Stocks in Smallcap Index
| Ticker | Stock Name | Watchlist | Category | Recent Price | Smart Investing & Trading Score | Change % | Weekly Change% |
| EFC | Ellington Financial |   | Financials | 12.11 | 93 | 0.17% | 1.51% |
| UMH | UMH Properties | | Financials | 15.44 | 74 | 1.31% | 1.45% |
| CNNE | Cannae | | Financials | 17.59 | 28 | -1.84% | 1.44% |
| WTBA | West Ban | | Financials | 17.13 | 42 | 0.20% | 1.42% |
| LOB | Live Oak | | Financials | 32.88 | 35 | -0.60% | 1.42% |
| LGIH | LGI Homes | | Financials | 94.31 | 28 | -1.67% | 1.40% |
| OCFC | OceanFirst Financial | | Financials | 14.60 | 49 | -2.60% | 1.39% |
| GABC | German American | | Financials | 32.44 | 59 | -0.67% | 1.38% |
| DX | Dynex Capital | | Financials | 11.85 | 32 | 1.20% | 1.37% |
| CHCT | Community Healthcare | | Financials | 23.64 | 60 | 0.21% | 1.33% |
| NAVI | Navient | | Financials | 14.57 | 42 | 0.73% | 1.29% |
| DEA | Easterly Government | | Financials | 12.07 | 93 | 0.92% | 1.26% |
| XHR | Xenia Hotels | | Financials | 14.43 | 62 | -0.69% | 1.26% |
| BSRR | Sierra Bancorp | | Financials | 20.50 | 68 | -3.16% | 1.23% |
| SVC | Service Properties | | Financials | 5.07 | 28 | 0.60% | 1.20% |
| SHO | Sunstone Hotel | | Financials | 10.13 | 28 | -0.10% | 1.20% |
| BNL | Broadstone Net | | Financials | 15.34 | 67 | 0.13% | 1.19% |
| LC | LendingClub | | Financials | 8.47 | 30 | -2.19% | 1.19% |
| MBWM | Mercantile Bank | | Financials | 36.83 | 25 | -1.34% | 1.18% |
| LXP | Lexington Realty | | Financials | 8.78 | 50 | -0.11% | 1.15% |
| FOR | Forestar Group | | Financials | 32.22 | 20 | -0.68% | 1.13% |
| LCNB | LCNB | | Financials | 13.87 | 39 | -0.18% | 1.13% |
| FBRT | Franklin BSP | | Financials | 12.62 | 43 | -1.17% | 1.12% |
| SAMG | Silvercrest Asset | | Financials | 15.43 | 67 | 1.98% | 1.11% |
| BDN | Brandywine Realty | | Financials | 4.59 | 44 | 1.10% | 1.10% |
| For chart view version of above stock list: Chart View ➞ 0 - 25 , 25 - 50 , 50 - 75 , 75 - 100 , 100 - 125 , 125 - 150 , 150 - 175 , 175 - 200 , 200 - 225 , 225 - 250 , 250 - 275 , 275 - 300 , 300 - 325 , 325 - 350 , 350 - 375 , 375 - 400 | ||
 | Click To Change The Sort Order: By Market Cap or Company Size Performance: Year-to-date, Week and Day |  |
| Too many stocks? View smallcap stocks filtered by marketcap & sector |
| Marketcap: All SmallCap Stocks (default-no microcap), Large, Mid-Range, Small |
| Smallcap Sector: Tech, Finance, Energy, Staples, Retail, Industrial, Materials, & Medical |
|
Get the most comprehensive stock market coverage daily at 12Stocks.com ➞ Best Stocks Today ➞ Best Stocks Weekly ➞ Best Stocks Year-to-Date ➞ Best Stocks Trends ➞  Best Stocks Today 12Stocks.com Best Nasdaq Stocks ➞ Best S&P 500 Stocks ➞ Best Tech Stocks ➞ Best Biotech Stocks ➞ |
| Detailed Overview of SmallCap Stocks |
| SmallCap Technical Overview, Leaders & Laggards, Top SmallCap ETF Funds & Detailed SmallCap Stocks List, Charts, Trends & More |
| Smallcap: Technical Analysis, Trends & YTD Performance | |
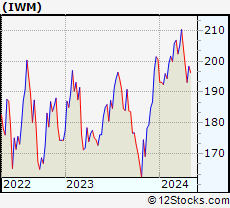
| SmallCap segment as represented by
IWM, an exchange-traded fund [ETF], holds basket of thousands of smallcap stocks from across all major sectors of the US stock market. The smallcap index (contains stocks like Riverbed & Sotheby's) is up by 0.61% and is currently underperforming the overall market by -11.9% year-to-date. Below is a quick view of technical charts and trends: | |
 IWM Weekly Chart |
|
| Long Term Trend: Not Good | |
| Medium Term Trend: Not Good | |
 IWM Daily Chart |
|
| Short Term Trend: Deteriorating | |
| Overall Trend Score: 18 | |
| YTD Performance: 0.61% | |
| **Trend Scores & Views Are Only For Educational Purposes And Not For Investing | |
| 12Stocks.com: Top Performing Small Cap Index Stocks | ||||||||||||||||||||||||||||||||||||||||||||||||
 The top performing Small Cap Index stocks year to date are
Now, more recently, over last week, the top performing Small Cap Index stocks on the move are


|
||||||||||||||||||||||||||||||||||||||||||||||||
| 12Stocks.com: Investing in Smallcap Index using Exchange Traded Funds | |
|
The following table shows list of key exchange traded funds (ETF) that
help investors track Smallcap index. The following list also includes leveraged ETF funds that track twice or thrice the daily returns of Smallcap indices. Short or inverse ETF funds move in the opposite direction to the index they track and are useful during market pullbacks or during bear markets. Quick View: Move mouse or cursor over ETF symbol (ticker) to view short-term technical chart and over ETF name to view long term chart. Click on ticker or stock name for detailed view. Click on to add stock symbol to your watchlist and to view watchlist. |
12Stocks.com List of ETFs that track Smallcap Index
| Ticker | ETF Name | Watchlist | Recent Price | Smart Investing & Trading Score | Change % | Week % | Year-to-date % |
| IWM | iShares Russell 2000 | | 201.94 | 18 | -0.87 | 0.37 | 0.61% |
| IJR | iShares Core S&P Small-Cap | | 106.26 | 10 | -0.98 | -0.76 | -1.84% |
| VTWO | Vanguard Russell 2000 ETF | | 81.89 | 28 | -0.91 | 0.63 | 0.97% |
| IWN | iShares Russell 2000 Value | | 151.10 | 10 | -1.05 | -0.66 | -2.72% |
| IJT | iShares S&P Small-Cap 600 Growth | | 128.14 | 15 | -1.03 | 0.02 | 2.4% |
| IWO | iShares Russell 2000 Growth | | 262.07 | 33 | -0.78 | 0.61 | 3.91% |
| IJS | iShares S&P Small-Cap 600 Value | | 96.64 | 10 | -1.11 | -1.32 | -6.24% |
| SMLV | SPDR SSGA US Small Cap Low Volatil ETF | | 107.15 | 18 | -1.17 | -0.83 | -4.77% |
| XSLV | PowerShares S&P SmallCap Low Volatil ETF | | 43.18 | 15 | -0.37 | -0.48 | -2.2% |
| SDD | ProShares UltraShort SmallCap600 | | 19.36 | 75 | 4.42 | 1.69 | 5.07% |
| SBB | ProShares Short SmallCap600 | | 16.42 | 75 | 1.92 | 0.8 | 3.08% |
| SAA | ProShares Ultra SmallCap600 | | 23.16 | 18 | -2.24 | -0.62 | -7.17% |
| 12Stocks.com: Charts, Trends, Fundamental Data and Performances of SmallCap Stocks | |
|
We now take in-depth look at all SmallCap stocks including charts, multi-period performances and overall trends (as measured by Smart Investing & Trading Score). One can sort SmallCap stocks (click link to choose) by Daily, Weekly and by Year-to-Date performances. Also, one can sort by size of the company or by market capitalization. |
| Select Your Default Chart Type: | |||||
| |||||
| Click on stock symbol or name for detailed view. Click on to add stock symbol to your watchlist and to view watchlist. Quick View: Move mouse or cursor over "Daily" to quickly view daily technical stock chart and over "Weekly" to view weekly technical stock chart. | |||||

 | EFC Ellington Financial Inc. |
| Sector: Financials | |
| SubSector: Mortgage Investment | |
| MarketCap: 380.239 Millions | |
| Recent Price: 12.11 Smart Investing & Trading Score: 93 | |
| Day Percent Change: 0.17% Day Change: 0.02 | |
| Week Change: 1.51% Year-to-date Change: -4.7% | |
| EFC Links: Profile News Message Board | |
| Charts:- Daily , Weekly | |
| Add EFC to Watchlist: View: Get Complete EFC Trend Analysis ➞ | |
 | UMH UMH Properties, Inc. |
| Sector: Financials | |
| SubSector: REIT - Diversified | |
| MarketCap: 433.353 Millions | |
| Recent Price: 15.44 Smart Investing & Trading Score: 74 | |
| Day Percent Change: 1.31% Day Change: 0.20 | |
| Week Change: 1.45% Year-to-date Change: 0.8% | |
| UMH Links: Profile News Message Board | |
| Charts:- Daily , Weekly | |
| Add UMH to Watchlist: View: Get Complete UMH Trend Analysis ➞ | |
 | CNNE Cannae Holdings, Inc. |
| Sector: Financials | |
| SubSector: Asset Management | |
| MarketCap: 2625.53 Millions | |
| Recent Price: 17.59 Smart Investing & Trading Score: 28 | |
| Day Percent Change: -1.84% Day Change: -0.33 | |
| Week Change: 1.44% Year-to-date Change: -9.8% | |
| CNNE Links: Profile News Message Board | |
| Charts:- Daily , Weekly | |
| Add CNNE to Watchlist: View: Get Complete CNNE Trend Analysis ➞ | |
 | WTBA West Bancorporation, Inc. |
| Sector: Financials | |
| SubSector: Regional - Southwest Banks | |
| MarketCap: 272.965 Millions | |
| Recent Price: 17.13 Smart Investing & Trading Score: 42 | |
| Day Percent Change: 0.20% Day Change: 0.04 | |
| Week Change: 1.42% Year-to-date Change: -19.2% | |
| WTBA Links: Profile News Message Board | |
| Charts:- Daily , Weekly | |
| Add WTBA to Watchlist: View: Get Complete WTBA Trend Analysis ➞ | |
 | LOB Live Oak Bancshares, Inc. |
| Sector: Financials | |
| SubSector: Savings & Loans | |
| MarketCap: 394.23 Millions | |
| Recent Price: 32.88 Smart Investing & Trading Score: 35 | |
| Day Percent Change: -0.60% Day Change: -0.20 | |
| Week Change: 1.42% Year-to-date Change: -27.7% | |
| LOB Links: Profile News Message Board | |
| Charts:- Daily , Weekly | |
| Add LOB to Watchlist: View: Get Complete LOB Trend Analysis ➞ | |
 | LGIH LGI Homes, Inc. |
| Sector: Financials | |
| SubSector: Real Estate Development | |
| MarketCap: 1316.49 Millions | |
| Recent Price: 94.31 Smart Investing & Trading Score: 28 | |
| Day Percent Change: -1.67% Day Change: -1.60 | |
| Week Change: 1.4% Year-to-date Change: -29.2% | |
| LGIH Links: Profile News Message Board | |
| Charts:- Daily , Weekly | |
| Add LGIH to Watchlist: View: Get Complete LGIH Trend Analysis ➞ | |
 | OCFC OceanFirst Financial Corp. |
| Sector: Financials | |
| SubSector: Savings & Loans | |
| MarketCap: 867.43 Millions | |
| Recent Price: 14.60 Smart Investing & Trading Score: 49 | |
| Day Percent Change: -2.60% Day Change: -0.39 | |
| Week Change: 1.39% Year-to-date Change: -15.9% | |
| OCFC Links: Profile News Message Board | |
| Charts:- Daily , Weekly | |
| Add OCFC to Watchlist: View: Get Complete OCFC Trend Analysis ➞ | |
 | GABC German American Bancorp, Inc. |
| Sector: Financials | |
| SubSector: Regional - Midwest Banks | |
| MarketCap: 731.47 Millions | |
| Recent Price: 32.44 Smart Investing & Trading Score: 59 | |
| Day Percent Change: -0.67% Day Change: -0.22 | |
| Week Change: 1.38% Year-to-date Change: 0.1% | |
| GABC Links: Profile News Message Board | |
| Charts:- Daily , Weekly | |
| Add GABC to Watchlist: View: Get Complete GABC Trend Analysis ➞ | |
 | DX Dynex Capital, Inc. |
| Sector: Financials | |
| SubSector: Mortgage Investment | |
| MarketCap: 327.839 Millions | |
| Recent Price: 11.85 Smart Investing & Trading Score: 32 | |
| Day Percent Change: 1.20% Day Change: 0.14 | |
| Week Change: 1.37% Year-to-date Change: -5.4% | |
| DX Links: Profile News Message Board | |
| Charts:- Daily , Weekly | |
| Add DX to Watchlist: View: Get Complete DX Trend Analysis ➞ | |
 | CHCT Community Healthcare Trust Incorporated |
| Sector: Financials | |
| SubSector: REIT - Healthcare Facilities | |
| MarketCap: 698.614 Millions | |
| Recent Price: 23.64 Smart Investing & Trading Score: 60 | |
| Day Percent Change: 0.21% Day Change: 0.05 | |
| Week Change: 1.33% Year-to-date Change: -11.3% | |
| CHCT Links: Profile News Message Board | |
| Charts:- Daily , Weekly | |
| Add CHCT to Watchlist: View: Get Complete CHCT Trend Analysis ➞ | |
 | NAVI Navient Corporation |
| Sector: Financials | |
| SubSector: Credit Services | |
| MarketCap: 1362.48 Millions | |
| Recent Price: 14.57 Smart Investing & Trading Score: 42 | |
| Day Percent Change: 0.73% Day Change: 0.10 | |
| Week Change: 1.29% Year-to-date Change: -21.7% | |
| NAVI Links: Profile News Message Board | |
| Charts:- Daily , Weekly | |
| Add NAVI to Watchlist: View: Get Complete NAVI Trend Analysis ➞ | |
 | DEA Easterly Government Properties, Inc. |
| Sector: Financials | |
| SubSector: REIT - Office | |
| MarketCap: 1832.56 Millions | |
| Recent Price: 12.07 Smart Investing & Trading Score: 93 | |
| Day Percent Change: 0.92% Day Change: 0.11 | |
| Week Change: 1.26% Year-to-date Change: -10.2% | |
| DEA Links: Profile News Message Board | |
| Charts:- Daily , Weekly | |
| Add DEA to Watchlist: View: Get Complete DEA Trend Analysis ➞ | |
 | XHR Xenia Hotels & Resorts, Inc. |
| Sector: Financials | |
| SubSector: REIT - Hotel/Motel | |
| MarketCap: 1058.24 Millions | |
| Recent Price: 14.43 Smart Investing & Trading Score: 62 | |
| Day Percent Change: -0.69% Day Change: -0.10 | |
| Week Change: 1.26% Year-to-date Change: 6.0% | |
| XHR Links: Profile News Message Board | |
| Charts:- Daily , Weekly | |
| Add XHR to Watchlist: View: Get Complete XHR Trend Analysis ➞ | |
 | BSRR Sierra Bancorp |
| Sector: Financials | |
| SubSector: Regional - Pacific Banks | |
| MarketCap: 256.929 Millions | |
| Recent Price: 20.50 Smart Investing & Trading Score: 68 | |
| Day Percent Change: -3.16% Day Change: -0.67 | |
| Week Change: 1.23% Year-to-date Change: -9.1% | |
| BSRR Links: Profile News Message Board | |
| Charts:- Daily , Weekly | |
| Add BSRR to Watchlist: View: Get Complete BSRR Trend Analysis ➞ | |
 | SVC Service Properties Trust |
| Sector: Financials | |
| SubSector: REIT - Hotel/Motel | |
| MarketCap: 1067.74 Millions | |
| Recent Price: 5.07 Smart Investing & Trading Score: 28 | |
| Day Percent Change: 0.60% Day Change: 0.03 | |
| Week Change: 1.2% Year-to-date Change: -40.6% | |
| SVC Links: Profile News Message Board | |
| Charts:- Daily , Weekly | |
| Add SVC to Watchlist: View: Get Complete SVC Trend Analysis ➞ | |
 | SHO Sunstone Hotel Investors, Inc. |
| Sector: Financials | |
| SubSector: REIT - Hotel/Motel | |
| MarketCap: 1861.04 Millions | |
| Recent Price: 10.13 Smart Investing & Trading Score: 28 | |
| Day Percent Change: -0.10% Day Change: -0.01 | |
| Week Change: 1.2% Year-to-date Change: -5.6% | |
| SHO Links: Profile News Message Board | |
| Charts:- Daily , Weekly | |
| Add SHO to Watchlist: View: Get Complete SHO Trend Analysis ➞ | |
 | BNL Broadstone Net Lease, Inc. |
| Sector: Financials | |
| SubSector: REIT Diversified | |
| MarketCap: 27267 Millions | |
| Recent Price: 15.34 Smart Investing & Trading Score: 67 | |
| Day Percent Change: 0.13% Day Change: 0.02 | |
| Week Change: 1.19% Year-to-date Change: -10.9% | |
| BNL Links: Profile News Message Board | |
| Charts:- Daily , Weekly | |
| Add BNL to Watchlist: View: Get Complete BNL Trend Analysis ➞ | |
 | LC LendingClub Corporation |
| Sector: Financials | |
| SubSector: Credit Services | |
| MarketCap: 852.308 Millions | |
| Recent Price: 8.47 Smart Investing & Trading Score: 30 | |
| Day Percent Change: -2.19% Day Change: -0.19 | |
| Week Change: 1.19% Year-to-date Change: -3.1% | |
| LC Links: Profile News Message Board | |
| Charts:- Daily , Weekly | |
| Add LC to Watchlist: View: Get Complete LC Trend Analysis ➞ | |
 | MBWM Mercantile Bank Corporation |
| Sector: Financials | |
| SubSector: Regional - Midwest Banks | |
| MarketCap: 372.77 Millions | |
| Recent Price: 36.83 Smart Investing & Trading Score: 25 | |
| Day Percent Change: -1.34% Day Change: -0.50 | |
| Week Change: 1.18% Year-to-date Change: -8.8% | |
| MBWM Links: Profile News Message Board | |
| Charts:- Daily , Weekly | |
| Add MBWM to Watchlist: View: Get Complete MBWM Trend Analysis ➞ | |
 | LXP Lexington Realty Trust |
| Sector: Financials | |
| SubSector: REIT - Diversified | |
| MarketCap: 2483.43 Millions | |
| Recent Price: 8.78 Smart Investing & Trading Score: 50 | |
| Day Percent Change: -0.11% Day Change: -0.01 | |
| Week Change: 1.15% Year-to-date Change: -11.5% | |
| LXP Links: Profile News Message Board | |
| Charts:- Daily , Weekly | |
| Add LXP to Watchlist: View: Get Complete LXP Trend Analysis ➞ | |
 | FOR Forestar Group Inc. |
| Sector: Financials | |
| SubSector: Real Estate Development | |
| MarketCap: 661.019 Millions | |
| Recent Price: 32.22 Smart Investing & Trading Score: 20 | |
| Day Percent Change: -0.68% Day Change: -0.22 | |
| Week Change: 1.13% Year-to-date Change: -2.6% | |
| FOR Links: Profile News Message Board | |
| Charts:- Daily , Weekly | |
| Add FOR to Watchlist: View: Get Complete FOR Trend Analysis ➞ | |
 | LCNB LCNB Corp. |
| Sector: Financials | |
| SubSector: Regional - Mid-Atlantic Banks | |
| MarketCap: 176.759 Millions | |
| Recent Price: 13.87 Smart Investing & Trading Score: 39 | |
| Day Percent Change: -0.18% Day Change: -0.03 | |
| Week Change: 1.13% Year-to-date Change: -12.1% | |
| LCNB Links: Profile News Message Board | |
| Charts:- Daily , Weekly | |
| Add LCNB to Watchlist: View: Get Complete LCNB Trend Analysis ➞ | |
 | FBRT Franklin BSP Realty Trust, Inc. |
| Sector: Financials | |
| SubSector: REIT - Mortgage | |
| MarketCap: 1170 Millions | |
| Recent Price: 12.62 Smart Investing & Trading Score: 43 | |
| Day Percent Change: -1.17% Day Change: -0.15 | |
| Week Change: 1.12% Year-to-date Change: -7.4% | |
| FBRT Links: Profile News Message Board | |
| Charts:- Daily , Weekly | |
| Add FBRT to Watchlist: View: Get Complete FBRT Trend Analysis ➞ | |
 | SAMG Silvercrest Asset Management Group Inc. |
| Sector: Financials | |
| SubSector: Asset Management | |
| MarketCap: 116.303 Millions | |
| Recent Price: 15.43 Smart Investing & Trading Score: 67 | |
| Day Percent Change: 1.98% Day Change: 0.30 | |
| Week Change: 1.11% Year-to-date Change: -9.2% | |
| SAMG Links: Profile News Message Board | |
| Charts:- Daily , Weekly | |
| Add SAMG to Watchlist: View: Get Complete SAMG Trend Analysis ➞ | |
 | BDN Brandywine Realty Trust |
| Sector: Financials | |
| SubSector: REIT - Diversified | |
| MarketCap: 1688.13 Millions | |
| Recent Price: 4.59 Smart Investing & Trading Score: 44 | |
| Day Percent Change: 1.10% Day Change: 0.05 | |
| Week Change: 1.1% Year-to-date Change: -15.0% | |
| BDN Links: Profile News Message Board | |
| Charts:- Daily , Weekly | |
| Add BDN to Watchlist: View: Get Complete BDN Trend Analysis ➞ | |
| For tabular summary view of above stock list: Summary View ➞ 0 - 25 , 25 - 50 , 50 - 75 , 75 - 100 , 100 - 125 , 125 - 150 , 150 - 175 , 175 - 200 , 200 - 225 , 225 - 250 , 250 - 275 , 275 - 300 , 300 - 325 , 325 - 350 , 350 - 375 , 375 - 400 | ||
| Click To Change The Sort Order: By Market Cap or Company Size Performance: Year-to-date, Week and Day | |
| Select Chart Type: | ||
| Too many stocks? View smallcap stocks filtered by marketcap & sector |
| Marketcap: All SmallCap Stocks (default-no microcap), Large, Mid-Range, Small & MicroCap |
| Sector: Tech, Finance, Energy, Staples, Retail, Industrial, Materials, Utilities & Medical |
|
Best Stocks Today 12Stocks.com |
© 2024 12Stocks.com Terms & Conditions Privacy Contact Us
All Information Provided Only For Education And Not To Be Used For Investing or Trading. See Terms & Conditions


One More Thing ... Get Best Stocks Delivered Daily!
Never Ever Miss A Move With Our Top Ten Stocks Lists
Find Best Stocks In Any Market - Bull or Bear Market
Take A Peek At Our Top Ten Stocks Lists: Daily, Weekly, Year-to-Date & Top Trends
Find Best Stocks In Any Market - Bull or Bear Market
Take A Peek At Our Top Ten Stocks Lists: Daily, Weekly, Year-to-Date & Top Trends
Smallcap Stocks With Best Up Trends [0-bearish to 100-bullish]: United Homes[100], Terns [100], Korn Ferry[100], Vanda [100], Replimune Group[100], Farmland Partners[100], Avidity Biosciences[100], Axcelis [100], Riot Blockchain[100], Napco Security[100], Stoke [100]
Best Smallcap Stocks Year-to-Date:
CareMax [512.37%], Li-Cycle [475.47%], Dominion Midstream[421.97%], Avidity Biosciences[343.92%], Janux [300%], Stoke [232.89%], Longboard [213.91%], Novavax [213.75%], Summit [210.73%], Super Micro[206.47%], Sweetgreen [198.14%] Best Smallcap Stocks This Week:
Dominion Midstream[700%], Avidity Biosciences[50.86%], Kaltura [46.19%], Biomea Fusion[38.89%], Scilex Holding[36.7%], Eos Energy[32.74%], UroGen Pharma[32.32%], Arcutis Bio[29.28%], United Homes[28.52%], Nerdy [27.55%], Li-Cycle [26.5%] Best Smallcap Stocks Daily:
UroGen Pharma[37.42%], Biomea Fusion[24.32%], Arcutis Bio[15.56%], United Homes[15.52%], Omeros [12.47%], Super Micro[12.45%], Terns [11.79%], Tango [11.55%], Korn Ferry[10.82%], Cipher Mining[10.54%], Fossil Group[9.93%]