
 Login Sign Up


| |||||
 |  | ||||

| 12Stocks.com Market Intelligence |
Best S&P 100 Stocks
| In a hurry? S&P 100 Stocks Lists: Performance Trends Table, Stock Charts
Sort S&P 100 stocks: Daily, Weekly, Year-to-Date, Market Cap & Trends. |
| 12Stocks.com S&P 100 Stocks Performances & Trends Daily | |||||||||
|
|  The overall Smart Investing & Trading Score is 100 (0-bearish to 100-bullish) which puts S&P 100 index in short term bullish trend. The Smart Investing & Trading Score from previous trading session is 90 and hence an improvement of trend.
| ||||||||
Here are the Smart Investing & Trading Scores of the most requested S&P 100 stocks at 12Stocks.com (click stock name for detailed review):
|


| 12Stocks.com: Top Performing S&P 100 Index Stocks | ||||||||||||||||||||||||||||||||||||||||||||||||
 The top performing S&P 100 Index stocks year to date are
Now, more recently, over last week, the top performing S&P 100 Index stocks on the move are


|
||||||||||||||||||||||||||||||||||||||||||||||||
| 12Stocks.com: Investing in S&P 100 Index with Stocks | |
|
The following table helps investors and traders sort through current performance and trends (as measured by Smart Investing & Trading Score) of various
stocks in the S&P 100 Index. Quick View: Move mouse or cursor over stock symbol (ticker) to view short-term technical chart and over stock name to view long term chart. Click on  to add stock symbol to your watchlist and to add stock symbol to your watchlist and  to view watchlist. Click on any ticker or stock name for detailed market intelligence report for that stock. to view watchlist. Click on any ticker or stock name for detailed market intelligence report for that stock. |
12Stocks.com Performance of Stocks in S&P 100 Index
| Ticker | Stock Name | Watchlist | Category | Recent Price | Smart Investing & Trading Score | Change % | YTD Change% |
| NVDA | NVIDIA Corp |   | Technology | 177.82 | 70 | 0.37% | 28.59% |
| MSFT | Microsoft | | Technology | 509.90 | 80 | 1.77% | 22.28% |
| AAPL | Apple | | Technology | 234.07 | 70 | 1.76% | -3.67% |
| GOOG | | Technology | 241.38 | 90 | 0.25% | 26.92% | |
| GOOGL | | Technology | 240.80 | 90 | 0.18% | 27.42% | |
| AMZN | Amazon.com | | Services & Goods | 228.15 | 30 | -0.78% | 3.60% |
| META | Meta Platforms | | Technology | 755.59 | 40 | 0.62% | 26.30% |
| AVGO | Broadcom | | Technology | 359.87 | 90 | 0.07% | 55.97% |
| TSLA | Tesla | | Services & Goods | 396.01 | 100 | 7.38% | 4.41% |
| JPM | JPMorgan Chase | | Financials | 306.91 | 90 | 0.44% | 29.95% |
| WMT | Walmart | | Consumer Staples | 103.49 | 80 | 0.82% | 15.58% |
| LLY | Lilly(Eli) & Co | | Health Care | 755.39 | 70 | -0.12% | -2.55% |
| V | Visa | | Financials | 339.43 | 20 | -1.18% | 8.51% |
| ORCL | Oracle Corp | | Technology | 292.18 | 70 | -5.09% | 77.45% |
| NFLX | Netflix | | Technology | 1188.44 | 20 | -1.25% | 34.03% |
| MA | Mastercard | | Financials | 580.41 | 40 | -1.41% | 11.60% |
| XOM | Exxon Mobil | | Energy | 112.16 | 80 | 0.02% | 6.43% |
| JNJ | Johnson & Johnson | | Health Care | 178.06 | 70 | -0.25% | 25.69% |
| COST | Costco Wholesale | | Consumer Staples | 967.90 | 60 | 0.37% | 6.79% |
| HD | Home Depot | | Services & Goods | 422.69 | 100 | -0.17% | 10.18% |
| ABBV | Abbvie | | Health Care | 218.34 | 100 | -0.85% | 25.03% |
| PG | Procter & Gamble Co | | Consumer Staples | 157.90 | 50 | -0.46% | -3.02% |
| BAC | Bank Of | | Financials | 50.58 | 80 | -0.33% | 15.60% |
| CVX | Chevron Corp | | Energy | 157.11 | 70 | -0.72% | 9.60% |
| GE | GE Aerospace | | Industrials | 281.69 | 70 | 0.05% | 67.64% |
| For chart view version of above stock list: Chart View ➞ 0 - 25 , 25 - 50 , 50 - 75 , 75 - 100 , 100 - 125 | ||
 | Click To Change The Sort Order: By Market Cap or Company Size Performance: Year-to-date, Week and Day |  |
|
Get the most comprehensive stock market coverage daily at 12Stocks.com ➞ Best Stocks Today ➞ Best Stocks Weekly ➞ Best Stocks Year-to-Date ➞ Best Stocks Trends ➞  Best Stocks Today 12Stocks.com Best Nasdaq Stocks ➞ Best S&P 500 Stocks ➞ Best Tech Stocks ➞ Best Biotech Stocks ➞ |
| Detailed Overview of S&P 100 Stocks |
| S&P 100 Technical Overview, Leaders & Laggards, Top S&P 100 ETF Funds & Detailed S&P 100 Stocks List, Charts, Trends & More |
| S&P 100: Technical Analysis, Trends & YTD Performance | |
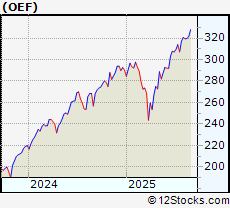
| S&P 100 index as represented by
OEF, an exchange-traded fund [ETF], holds basket of one hundred US (mostly largecap) stocks from across all major sectors of the US stock market. The S&P 100 index (contains stocks like Apple and Exxon) is up by 14.3224% and is currently outperforming the overall market by 1.4714% year-to-date. Below is a quick view of technical charts and trends: | |
 OEF Weekly Chart |
|
| Long Term Trend: Very Good | |
| Medium Term Trend: Good | |
 OEF Daily Chart |
|
| Short Term Trend: Very Good | |
| Overall Trend Score: 100 | |
| YTD Performance: 14.3224% | |
| **Trend Scores & Views Are Only For Educational Purposes And Not For Investing | |
| 12Stocks.com: Investing in S&P 100 Index using Exchange Traded Funds | |
|
The following table shows list of key exchange traded funds (ETF) that
help investors track S&P 100 index. We have also included ETF funds that track S&P 500 index since it is market-cap weighted. The following list also includes leveraged ETF funds that track twice or thrice the daily returns of S&P 100 indices. Short or inverse ETF funds move in the opposite direction to the index they track and are useful during market pullbacks or during bear markets. Quick View: Move mouse or cursor over ETF symbol (ticker) to view short-term technical chart and over ETF name to view long term chart. Click on ticker or stock name for detailed view. Click on to add stock symbol to your watchlist and to view watchlist. |
12Stocks.com List of ETFs that track S&P 100 Index
| Ticker | ETF Name | Watchlist | Recent Price | Smart Investing & Trading Score | Change % | Week % | Year-to-date % |
| SPY | SPDR S&P 500 ETF Trust | | 657.41 | 90 | -0.0334535 | 1.27711 | 13.1205% |
| SPXS | Direxion Daily S&P 500 Bear -3X Shares | | 3.99 | 10 | 0 | -3.62319 | -35.7384% |
| SPXU | ProShares UltraPro Short S&P 500 | | 14.28 | 10 | 0.140252 | -3.44828 | -35.8044% |
| SDS | ProShares UltraShort S&P500 -2x Shares | | 15.01 | 10 | 0.133422 | -2.27865 | -22.4378% |
| VOO | Vanguard S&P 500 ETF | | 604.44 | 90 | -0.0231566 | 1.30562 | 13.2006% |
| UPRO | ProShares UltraPro S&P 500 ETF 3x Shares | | 107.08 | 100 | -0.186428 | 3.57903 | 22.427% |
| SPXL | Direxion Daily S&P 500 Bull 3X Shares | | 203.36 | 100 | -0.137498 | 3.63877 | 22.3792% |
| SSO | ProShares Ultra S&P500 2x Shares | | 109.07 | 90 | -0.119048 | 2.43238 | 19.0106% |
| SH | ProShares Short S&P500 -1x Shares | | 37.85 | 10 | 0.0528681 | -1.09747 | -9.37106% |
| OEF | iShares S&P 100 ETF | | 327.92 | 100 | 0.241494 | 1.62075 | 14.3224% |
| 12Stocks.com: Charts, Trends, Fundamental Data and Performances of S&P 100 Stocks | |
|
We now take in-depth look at all S&P 100 stocks including charts, multi-period performances and overall trends (as measured by Smart Investing & Trading Score). One can sort S&P 100 stocks (click link to choose) by Daily, Weekly and by Year-to-Date performances. Also, one can sort by size of the company or by market capitalization. |
| Select Your Default Chart Type: | |||||
| |||||
| Click on stock symbol or name for detailed view. Click on to add stock symbol to your watchlist and to view watchlist. Quick View: Move mouse or cursor over "Daily" to quickly view daily technical stock chart and over "Weekly" to view weekly technical stock chart. | |||||

 | NVDA NVIDIA Corp |
| Sector: Technology | |
| SubSector: Semiconductors | |
| MarketCap: 4058590 Millions | |
| Recent Price: 177.82 Smart Investing & Trading Score: 70 | |
| Day Percent Change: 0.366879% Day Change: 0.7 | |
| Week Change: 3.58849% Year-to-date Change: 28.6% | |
| NVDA Links: Profile News Message Board | |
| Charts:- Daily , Weekly | |
| Add NVDA to Watchlist: View: Get Complete NVDA Trend Analysis ➞ | |
 | MSFT Microsoft Corporation |
| Sector: Technology | |
| SubSector: Software - Infrastructure | |
| MarketCap: 3679420 Millions | |
| Recent Price: 509.90 Smart Investing & Trading Score: 80 | |
| Day Percent Change: 1.77442% Day Change: 10.99 | |
| Week Change: 0.379944% Year-to-date Change: 22.3% | |
| MSFT Links: Profile News Message Board | |
| Charts:- Daily , Weekly | |
| Add MSFT to Watchlist: View: Get Complete MSFT Trend Analysis ➞ | |
 | AAPL Apple Inc |
| Sector: Technology | |
| SubSector: Consumer Electronics | |
| MarketCap: 3557090 Millions | |
| Recent Price: 234.07 Smart Investing & Trading Score: 70 | |
| Day Percent Change: 1.75629% Day Change: 3.75 | |
| Week Change: -2.38135% Year-to-date Change: -3.7% | |
| AAPL Links: Profile News Message Board | |
| Charts:- Daily , Weekly | |
| Add AAPL to Watchlist: View: Get Complete AAPL Trend Analysis ➞ | |
 | GOOG Alphabet Inc |
| Sector: Technology | |
| SubSector: Internet Content & Information | |
| MarketCap: 2843010 Millions | |
| Recent Price: 241.38 Smart Investing & Trading Score: 90 | |
| Day Percent Change: 0.24919% Day Change: 1.22 | |
| Week Change: 3.74796% Year-to-date Change: 26.9% | |
| GOOG Links: Profile News Message Board | |
| Charts:- Daily , Weekly | |
| Add GOOG to Watchlist: View: Get Complete GOOG Trend Analysis ➞ | |
 | GOOGL Alphabet Inc |
| Sector: Technology | |
| SubSector: Internet Content & Information | |
| MarketCap: 2843010 Millions | |
| Recent Price: 240.80 Smart Investing & Trading Score: 90 | |
| Day Percent Change: 0.178891% Day Change: 1.26 | |
| Week Change: 3.65906% Year-to-date Change: 27.4% | |
| GOOGL Links: Profile News Message Board | |
| Charts:- Daily , Weekly | |
| Add GOOGL to Watchlist: View: Get Complete GOOGL Trend Analysis ➞ | |
 | AMZN Amazon.com Inc |
| Sector: Services & Goods | |
| SubSector: Internet Retail | |
| MarketCap: 2477780 Millions | |
| Recent Price: 228.15 Smart Investing & Trading Score: 30 | |
| Day Percent Change: -0.782779% Day Change: -2.07 | |
| Week Change: -3.19501% Year-to-date Change: 3.6% | |
| AMZN Links: Profile News Message Board | |
| Charts:- Daily , Weekly | |
| Add AMZN to Watchlist: View: Get Complete AMZN Trend Analysis ➞ | |
 | META Meta Platforms Inc |
| Sector: Technology | |
| SubSector: Internet Content & Information | |
| MarketCap: 1890130 Millions | |
| Recent Price: 755.59 Smart Investing & Trading Score: 40 | |
| Day Percent Change: 0.624584% Day Change: 4.28 | |
| Week Change: 0.927002% Year-to-date Change: 26.3% | |
| META Links: Profile News Message Board | |
| Charts:- Daily , Weekly | |
| Add META to Watchlist: View: Get Complete META Trend Analysis ➞ | |
 | AVGO Broadcom Inc |
| Sector: Technology | |
| SubSector: Semiconductors | |
| MarketCap: 1575150 Millions | |
| Recent Price: 359.87 Smart Investing & Trading Score: 90 | |
| Day Percent Change: 0.0667353% Day Change: 3.25 | |
| Week Change: 17.5662% Year-to-date Change: 56.0% | |
| AVGO Links: Profile News Message Board | |
| Charts:- Daily , Weekly | |
| Add AVGO to Watchlist: View: Get Complete AVGO Trend Analysis ➞ | |
 | TSLA Tesla Inc |
| Sector: Services & Goods | |
| SubSector: Auto Manufacturers | |
| MarketCap: 1131620 Millions | |
| Recent Price: 396.01 Smart Investing & Trading Score: 100 | |
| Day Percent Change: 7.37507% Day Change: 24.9 | |
| Week Change: 16.9793% Year-to-date Change: 4.4% | |
| TSLA Links: Profile News Message Board | |
| Charts:- Daily , Weekly | |
| Add TSLA to Watchlist: View: Get Complete TSLA Trend Analysis ➞ | |
 | JPM JPMorgan Chase & Co |
| Sector: Financials | |
| SubSector: Banks - Diversified | |
| MarketCap: 809472 Millions | |
| Recent Price: 306.91 Smart Investing & Trading Score: 90 | |
| Day Percent Change: 0.441812% Day Change: 1.8 | |
| Week Change: 1.01705% Year-to-date Change: 30.0% | |
| JPM Links: Profile News Message Board | |
| Charts:- Daily , Weekly | |
| Add JPM to Watchlist: View: Get Complete JPM Trend Analysis ➞ | |
 | WMT Walmart Inc |
| Sector: Consumer Staples | |
| SubSector: Discount Stores | |
| MarketCap: 801351 Millions | |
| Recent Price: 103.49 Smart Investing & Trading Score: 80 | |
| Day Percent Change: 0.818315% Day Change: 0.96 | |
| Week Change: 2.53641% Year-to-date Change: 15.6% | |
| WMT Links: Profile News Message Board | |
| Charts:- Daily , Weekly | |
| Add WMT to Watchlist: View: Get Complete WMT Trend Analysis ➞ | |
 | LLY Lilly(Eli) & Co |
| Sector: Health Care | |
| SubSector: Drug Manufacturers - General | |
| MarketCap: 688273 Millions | |
| Recent Price: 755.39 Smart Investing & Trading Score: 70 | |
| Day Percent Change: -0.117681% Day Change: -0.41 | |
| Week Change: 1.67988% Year-to-date Change: -2.5% | |
| LLY Links: Profile News Message Board | |
| Charts:- Daily , Weekly | |
| Add LLY to Watchlist: View: Get Complete LLY Trend Analysis ➞ | |
 | V Visa Inc |
| Sector: Financials | |
| SubSector: Credit Services | |
| MarketCap: 661248 Millions | |
| Recent Price: 339.43 Smart Investing & Trading Score: 20 | |
| Day Percent Change: -1.18198% Day Change: -2.8 | |
| Week Change: -3.29354% Year-to-date Change: 8.5% | |
| V Links: Profile News Message Board | |
| Charts:- Daily , Weekly | |
| Add V to Watchlist: View: Get Complete V Trend Analysis ➞ | |
 | ORCL Oracle Corp |
| Sector: Technology | |
| SubSector: Software - Infrastructure | |
| MarketCap: 653896 Millions | |
| Recent Price: 292.18 Smart Investing & Trading Score: 70 | |
| Day Percent Change: -5.09322% Day Change: -13.04 | |
| Week Change: 31.0224% Year-to-date Change: 77.4% | |
| ORCL Links: Profile News Message Board | |
| Charts:- Daily , Weekly | |
| Add ORCL to Watchlist: View: Get Complete ORCL Trend Analysis ➞ | |
 | NFLX Netflix Inc |
| Sector: Technology | |
| SubSector: Entertainment | |
| MarketCap: 528532 Millions | |
| Recent Price: 1188.44 Smart Investing & Trading Score: 20 | |
| Day Percent Change: -1.25135% Day Change: -15.57 | |
| Week Change: -5.49035% Year-to-date Change: 34.0% | |
| NFLX Links: Profile News Message Board | |
| Charts:- Daily , Weekly | |
| Add NFLX to Watchlist: View: Get Complete NFLX Trend Analysis ➞ | |
 | MA Mastercard Incorporated |
| Sector: Financials | |
| SubSector: Credit Services | |
| MarketCap: 528142 Millions | |
| Recent Price: 580.41 Smart Investing & Trading Score: 40 | |
| Day Percent Change: -1.41321% Day Change: -5.26 | |
| Week Change: -2.55691% Year-to-date Change: 11.6% | |
| MA Links: Profile News Message Board | |
| Charts:- Daily , Weekly | |
| Add MA to Watchlist: View: Get Complete MA Trend Analysis ➞ | |
 | XOM Exxon Mobil Corp |
| Sector: Energy | |
| SubSector: Oil & Gas Integrated | |
| MarketCap: 465674 Millions | |
| Recent Price: 112.16 Smart Investing & Trading Score: 80 | |
| Day Percent Change: 0.0178348% Day Change: -0.07 | |
| Week Change: -0.213523% Year-to-date Change: 6.4% | |
| XOM Links: Profile News Message Board | |
| Charts:- Daily , Weekly | |
| Add XOM to Watchlist: View: Get Complete XOM Trend Analysis ➞ | |
 | JNJ Johnson & Johnson |
| Sector: Health Care | |
| SubSector: Drug Manufacturers - General | |
| MarketCap: 429720 Millions | |
| Recent Price: 178.06 Smart Investing & Trading Score: 70 | |
| Day Percent Change: -0.246499% Day Change: -0.03 | |
| Week Change: -0.391586% Year-to-date Change: 25.7% | |
| JNJ Links: Profile News Message Board | |
| Charts:- Daily , Weekly | |
| Add JNJ to Watchlist: View: Get Complete JNJ Trend Analysis ➞ | |
 | COST Costco Wholesale Corp |
| Sector: Consumer Staples | |
| SubSector: Discount Stores | |
| MarketCap: 427281 Millions | |
| Recent Price: 967.90 Smart Investing & Trading Score: 60 | |
| Day Percent Change: 0.371246% Day Change: 4.67 | |
| Week Change: 1.25536% Year-to-date Change: 6.8% | |
| COST Links: Profile News Message Board | |
| Charts:- Daily , Weekly | |
| Add COST to Watchlist: View: Get Complete COST Trend Analysis ➞ | |
 | HD Home Depot, Inc |
| Sector: Services & Goods | |
| SubSector: Home Improvement Retail | |
| MarketCap: 417017 Millions | |
| Recent Price: 422.69 Smart Investing & Trading Score: 100 | |
| Day Percent Change: -0.172406% Day Change: -0.78 | |
| Week Change: 2.67191% Year-to-date Change: 10.2% | |
| HD Links: Profile News Message Board | |
| Charts:- Daily , Weekly | |
| Add HD to Watchlist: View: Get Complete HD Trend Analysis ➞ | |
 | ABBV Abbvie Inc |
| Sector: Health Care | |
| SubSector: Drug Manufacturers - General | |
| MarketCap: 375500 Millions | |
| Recent Price: 218.34 Smart Investing & Trading Score: 100 | |
| Day Percent Change: -0.853692% Day Change: -0.03 | |
| Week Change: 2.50704% Year-to-date Change: 25.0% | |
| ABBV Links: Profile News Message Board | |
| Charts:- Daily , Weekly | |
| Add ABBV to Watchlist: View: Get Complete ABBV Trend Analysis ➞ | |
 | PG Procter & Gamble Co |
| Sector: Consumer Staples | |
| SubSector: Household & Personal Products | |
| MarketCap: 374826 Millions | |
| Recent Price: 157.90 Smart Investing & Trading Score: 50 | |
| Day Percent Change: -0.46019% Day Change: -0.29 | |
| Week Change: -0.810352% Year-to-date Change: -3.0% | |
| PG Links: Profile News Message Board | |
| Charts:- Daily , Weekly | |
| Add PG to Watchlist: View: Get Complete PG Trend Analysis ➞ | |
 | BAC Bank Of America Corp |
| Sector: Financials | |
| SubSector: Banks - Diversified | |
| MarketCap: 368644 Millions | |
| Recent Price: 50.58 Smart Investing & Trading Score: 80 | |
| Day Percent Change: -0.334975% Day Change: -0.05 | |
| Week Change: -0.0790202% Year-to-date Change: 15.6% | |
| BAC Links: Profile News Message Board | |
| Charts:- Daily , Weekly | |
| Add BAC to Watchlist: View: Get Complete BAC Trend Analysis ➞ | |
 | CVX Chevron Corp |
| Sector: Energy | |
| SubSector: Oil & Gas Integrated | |
| MarketCap: 314603 Millions | |
| Recent Price: 157.11 Smart Investing & Trading Score: 70 | |
| Day Percent Change: -0.720379% Day Change: -0.85 | |
| Week Change: -0.36781% Year-to-date Change: 9.6% | |
| CVX Links: Profile News Message Board | |
| Charts:- Daily , Weekly | |
| Add CVX to Watchlist: View: Get Complete CVX Trend Analysis ➞ | |
 | GE GE Aerospace |
| Sector: Industrials | |
| SubSector: Aerospace & Defense | |
| MarketCap: 296106 Millions | |
| Recent Price: 281.69 Smart Investing & Trading Score: 70 | |
| Day Percent Change: 0.0461713% Day Change: -0.1 | |
| Week Change: -0.205477% Year-to-date Change: 67.6% | |
| GE Links: Profile News Message Board | |
| Charts:- Daily , Weekly | |
| Add GE to Watchlist: View: Get Complete GE Trend Analysis ➞ | |
| For tabular summary view of above stock list: Summary View ➞ 0 - 25 , 25 - 50 , 50 - 75 , 75 - 100 , 100 - 125 | ||
| Click To Change The Sort Order: By Market Cap or Company Size Performance: Year-to-date, Week and Day | |
| Select Chart Type: | ||
|
Best Stocks Today 12Stocks.com |
� 2025 12Stocks.com Terms & Conditions Privacy Contact Us
All Information Provided Only For Education And Not To Be Used For Investing or Trading. See Terms & Conditions


One More Thing ... Get Best Stocks Delivered Daily!
Never Ever Miss A Move With Our Top Ten Stocks Lists
Find Best Stocks In Any Market - Bull or Bear Market
Take A Peek At Our Top Ten Stocks Lists: Daily, Weekly, Year-to-Date & Top Trends
Find Best Stocks In Any Market - Bull or Bear Market
Take A Peek At Our Top Ten Stocks Lists: Daily, Weekly, Year-to-Date & Top Trends
S&P 100 Stocks With Best Up Trends [0-bearish to 100-bullish]: Tesla [100], CVS Health[100], iShares S&P[100], Qualcomm [100], Lockheed Martin[100], Morgan Stanley[100], Home Depot[100], Linde [100], Goldman Sachs[100], Abbvie [100], Bank Of[90]
Best S&P 100 Stocks Year-to-Date:
Oracle Corp[77.4466%], CVS Health[75.3787%], GE Aerospace[67.6417%], Broadcom [55.9675%], Citi [45.2574%], Bank Of[39.9364%], Philip Morris[39.4207%], Goldman Sachs[37.0221%], Netflix [34.025%], AT&T [33.9215%], Altria [31.4562%] Best S&P 100 Stocks This Week:
Oracle Corp[31.0224%], Broadcom [17.5662%], Tesla [16.9793%], Unitedhealth [13.5737%], Dow [4.72606%], Goldman Sachs[4.16077%], Morgan Stanley[3.89291%], Google [3.74796%], Google [3.65906%], NVIDIA Corp[3.58849%], Lockheed Martin[3.16515%] Best S&P 100 Stocks Daily:
Tesla [7.37507%], Advanced Micro[1.86292%], Microsoft [1.77442%], Apple [1.75629%], Bank Of[0.833333%], Walmart [0.818315%], Abbott [0.814173%], Citi [0.627403%], Meta Platforms[0.624584%], Metlife [0.597461%], NextEra Energy[0.448682%]