
 Login Sign Up


| |||||
 |  | ||||

| 12Stocks.com Market Intelligence |
Best Nasdaq Stocks
|
On this page, you will find the most comprehensive analysis of Nasdaq 100 stocks and ETFs - from latest trends to performances to charts ➞. First, here are the year-to-date (YTD) performances of the most requested Nasdaq stocks at 12Stocks.com (click stock for review):
| Baidu 42% | ||
| Netflix 36% | ||
| Google 32% | ||
| NVIDIA Corp 27% | ||
| Gilead 24% | ||
| Intel Corp 24% | ||
| Microsoft 23% | ||
| Expedia 23% | ||
| Tesla 10% | ||
| AMGEN 8% | ||
| Qualcomm 7% | ||
| Amazon.com 6% | ||
| Costco 6% | ||
| Apple -1% | ||
| Biogen -4% | ||
| Starbucks Corp -8% | ||
| Comcast Corp -11% | ||
| Nasdaq 100 Stocks Lists: Performances & Trends, Nasdaq 100 Stock Charts
Sort Nasdaq 100 stocks: Daily, Weekly, Year-to-Date, Market Cap & Trends. |
| 12Stocks.com Nasdaq Stocks Performances & Trends Daily Report | |||||||||
|
| 
The overall Smart Investing & Trading Score is 90 (0-bearish to 100-bullish) which puts Nasdaq index in short term bullish trend. The Smart Investing & Trading Score from previous trading session is 100 and a deterioration of trend continues. | ||||||||
Here are the Smart Investing & Trading Scores of the most requested Nasdaq 100 stocks at 12Stocks.com (click stock name for detailed review):
|


| 12Stocks.com: Top Performing Nasdaq 100 Index Stocks | ||||||||||||||||||||||||||||||||||||||||||||||||
 The top performing Nasdaq 100 Index stocks year to date are
Now, more recently, over last week, the top performing Nasdaq 100 Index stocks on the move are


|
||||||||||||||||||||||||||||||||||||||||||||||||
| 12Stocks.com: Investing in Nasdaq 100 Index with Stocks | |
|
The following table helps investors and traders sort through current performance and trends (as measured by Smart Investing & Trading Score) of various
stocks in the Nasdaq 100 Index. Quick View: Move mouse or cursor over stock symbol (ticker) to view short-term technical chart and over stock name to view long term chart. Click on  to add stock symbol to your watchlist and to add stock symbol to your watchlist and  to view watchlist. Click on any ticker or stock name for detailed market intelligence report for that stock. to view watchlist. Click on any ticker or stock name for detailed market intelligence report for that stock. |
12Stocks.com Performance of Stocks in Nasdaq 100 Index
| Ticker | Stock Name | Watchlist | Category | Recent Price | Smart Investing & Trading Score | Change % | YTD Change% |
| NVDA | NVIDIA Corp |   | Technology | 176.12 | 50 | -0.92% | 27.36% |
| MSFT | Microsoft | | Technology | 512.57 | 80 | -0.54% | 22.93% |
| AAPL | Apple | | Technology | 239.98 | 80 | 1.39% | -1.24% |
| GOOG | | Technology | 250.58 | 90 | -0.47% | 31.76% | |
| GOOGL | | Technology | 249.91 | 90 | -0.68% | 32.24% | |
| AMZN | Amazon.com | | Services & Goods | 233.45 | 90 | 0.87% | 6.01% |
| META | Meta Platforms | | Technology | 768.90 | 70 | 0.55% | 28.53% |
| AVGO | Broadcom | | Technology | 362.52 | 90 | -0.43% | 57.12% |
| TSLA | Tesla | | Services & Goods | 415.75 | 100 | 1.39% | 9.62% |
| NFLX | Netflix | | Technology | 1203.44 | 20 | 0.10% | 35.72% |
| COST | Costco | | Consumer Staples | 956.39 | 30 | -0.39% | 5.52% |
| ASML | ASML Holding | | Technology | 875.34 | 100 | 0.93% | 25.91% |
| TMUS | T-Mobile US | | Technology | 237.25 | 10 | -1.04% | 8.83% |
| CSCO | Cisco | | Technology | 66.93 | 10 | -0.16% | 15.47% |
| AZN | Astrazeneca | | Health Care | 77.72 | 30 | -0.42% | 20.44% |
| AMD | Advanced Micro | | Technology | 160.30 | 60 | -0.53% | 32.89% |
| PEP | PepsiCo | | Consumer Staples | 141.12 | 40 | 0.34% | -4.18% |
| INTU | Intuit | | Technology | 646.71 | 0 | -0.71% | 4.34% |
| BKNG | Booking | | Services & Goods | 5509.77 | 40 | -0.90% | 12.29% |
| PDD | PDD | | Services & Goods | 129.15 | 100 | 1.38% | 33.30% |
| QCOM | Qualcomm | | Technology | 163.15 | 100 | 1.20% | 7.40% |
| TXN | Texas Instruments | | Technology | 179.00 | 10 | 0.45% | -2.02% |
| ISRG | Intuitive Surgical | | Health Care | 431.86 | 0 | -0.49% | -17.59% |
| AMGN | AMGEN | | Health Care | 275.92 | 10 | 0.55% | 8.23% |
| ADBE | Adobe | | Technology | 352.00 | 50 | 1.41% | -20.18% |
| MU | Micron | | Technology | 158.62 | 90 | 0.54% | 82.04% |
| GILD | Gilead | | Health Care | 112.54 | 10 | 0.00% | 24.22% |
| HON | Honeywell | | Industrials | 212.01 | 10 | 0.13% | -5.00% |
| LRCX | Lam Research | | Technology | 119.38 | 100 | 0.14% | 65.71% |
| PANW | Palo Alto | | Technology | 199.58 | 80 | -0.84% | 10.42% |
| For chart view version of above stock list: Chart View ➞ 0 - 30 , 30 - 60 , 60 - 90 , 90 - 120 | ||
 | Click To Change The Sort Order: By Market Cap or Company Size Performance: Year-to-date, Week and Day |  |
|
Get the most comprehensive stock market coverage daily at 12Stocks.com ➞ Best Stocks Today ➞ Best Stocks Weekly ➞ Best Stocks Year-to-Date ➞ Best Stocks Trends ➞  Best Stocks Today 12Stocks.com Best Dow Stocks ➞ Best S&P 500 Stocks ➞ Best Tech Stocks ➞ Best Biotech Stocks ➞ |
| Detailed Overview of Nasdaq 100 Stocks |
| Nasdaq 100 Technical Overview, Leaders & Laggards, Top Nasdaq 100 ETF Funds & Detailed Nasdaq 100 Stocks List, Charts, Trends & More |
| Nasdaq 100: Technical Analysis, Trends & YTD Performance | |
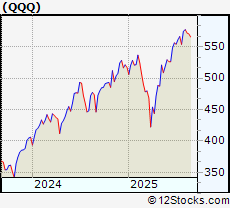
| Nasdaq 100 index as represented by
QQQ, an exchange-traded fund [ETF], holds basket of one hundred (mostly largecap) stocks from technology, biotech & retail sectors of the US stock market. The Nasdaq 100 index (contains stocks like Apple and Amgen) is up by 16.1861% and is currently outperforming the overall market by 2.9245% year-to-date. Below is a quick view of technical charts and trends: | |
 QQQ Weekly Chart |
|
| Long Term Trend: Very Good | |
| Medium Term Trend: Good | |
 QQQ Daily Chart |
|
| Short Term Trend: Very Good | |
| Overall Trend Score: 90 | |
| YTD Performance: 16.1861% | |
| **Trend Scores & Views Are Only For Educational Purposes And Not For Investing | |
| 12Stocks.com: Investing in Nasdaq 100 Index using Exchange Traded Funds | |
|
The following table shows list of key exchange traded funds (ETF) that
help investors track Nasdaq 100 index. The following list also includes leveraged ETF funds that track twice or thrice the daily returns of Nasdaq 100 indices. Short or inverse ETF funds move in the opposite direction to the index they track and are useful during market pullbacks or during bear markets. Quick View: Move mouse or cursor over ETF symbol (ticker) to view short-term technical chart and over ETF name to view long term chart. Click on ticker or stock name for detailed view. Click on to add stock symbol to your watchlist and to view watchlist. |
12Stocks.com List of ETFs that track Nasdaq 100 Index
| Ticker | ETF Name | Watchlist | Recent Price | Smart Investing & Trading Score | Change % | Week % | Year-to-date % |
| SQQQ | ProShares UltraPro Short QQQ -3x Shares | | 16.19 | 10 | 0.309789 | -5.87209 | -46.9417% |
| TQQQ | ProShares UltraPro QQQ 3x Shares | | 99.00 | 100 | -0.231785 | 6.30302 | 26.631% |
| QQQ | Invesco QQQ Trust Series 1 | | 591.27 | 90 | -0.0692942 | 2.1421 | 16.1861% |
| QYLD | Global X NASDAQ 100 Covered Call ETF | | 16.98 | 100 | 0.0589275 | 1.13163 | 0.0624654% |
| QID | ProShares UltraShort QQQ -2x Shares | | 22.42 | 10 | 0.133988 | -3.98287 | -30.2557% |
| QLD | ProShares Ultra QQQ 2x Shares | | 133.24 | 100 | -0.104963 | 4.25665 | 23.814% |
| QQQX | Nuveen NASDAQ 100 Dynamic Overwrite Fund | | 27.23 | 40 | -1.51899 | -0.183284 | 6.00445% |
| QQQE | Direxion NASDAQ-100 Equal Weighted Index Shares | | 99.29 | 80 | 0.313195 | 1.37839 | 10.9057% |
| QTEC | First Trust NASDAQ-100 Technology Sector Index Fund | | 219.92 | 100 | 0.917768 | 2.51725 | 16.5992% |
| QQXT | First Trust Nasdaq-100 Ex-Technology Sector Index Fund | | 98.17 | 30 | -0.10176 | -0.0838656 | 5.95219% |
| QQEW | First Trust NASDAQ-100 Equal Weighted Index Fund | | 137.65 | 70 | -0.159571 | 0.813687 | 10.3964% |
| 12Stocks.com: Charts, Trends, Fundamental Data and Performances of Nasdaq 100 Stocks | |
|
We now take in-depth look at all Nasdaq 100 stocks including charts, multi-period performances and overall trends (as measured by Smart Investing & Trading Score). One can sort Nasdaq 100 stocks (click link to choose) by Daily, Weekly and by Year-to-Date performances. Also, one can sort by size of the company or by market capitalization. |
| Select Your Default Chart Type: | |||||
| |||||
| Click on stock symbol or name for detailed view. Click on to add stock symbol to your watchlist and to view watchlist. Quick View: Move mouse or cursor over "Daily" to quickly view daily technical stock chart and over "Weekly" to view weekly technical stock chart. | |||||

 | NVDA NVIDIA Corp |
| Sector: Technology | |
| SubSector: Semiconductors | |
| MarketCap: 4058590 Millions | |
| Recent Price: 176.12 Smart Investing & Trading Score: 50 | |
| Day Percent Change: -0.917018% Day Change: -1.63 | |
| Week Change: 4.64025% Year-to-date Change: 27.4% | |
| NVDA Links: Profile News Message Board | |
| Charts:- Daily , Weekly | |
| Add NVDA to Watchlist: View: Get Complete NVDA Trend Analysis ➞ | |
 | MSFT Microsoft Corporation |
| Sector: Technology | |
| SubSector: Software - Infrastructure | |
| MarketCap: 3679420 Millions | |
| Recent Price: 512.57 Smart Investing & Trading Score: 80 | |
| Day Percent Change: -0.541369% Day Change: -2.79 | |
| Week Change: 2.88438% Year-to-date Change: 22.9% | |
| MSFT Links: Profile News Message Board | |
| Charts:- Daily , Weekly | |
| Add MSFT to Watchlist: View: Get Complete MSFT Trend Analysis ➞ | |
 | AAPL Apple Inc |
| Sector: Technology | |
| SubSector: Consumer Electronics | |
| MarketCap: 3557090 Millions | |
| Recent Price: 239.98 Smart Investing & Trading Score: 80 | |
| Day Percent Change: 1.38572% Day Change: 3.28 | |
| Week Change: 0.882798% Year-to-date Change: -1.2% | |
| AAPL Links: Profile News Message Board | |
| Charts:- Daily , Weekly | |
| Add AAPL to Watchlist: View: Get Complete AAPL Trend Analysis ➞ | |
 | GOOG Alphabet Inc |
| Sector: Technology | |
| SubSector: Internet Content & Information | |
| MarketCap: 2843010 Millions | |
| Recent Price: 250.58 Smart Investing & Trading Score: 90 | |
| Day Percent Change: -0.4687% Day Change: -1.18 | |
| Week Change: 7.0123% Year-to-date Change: 31.8% | |
| GOOG Links: Profile News Message Board | |
| Charts:- Daily , Weekly | |
| Add GOOG to Watchlist: View: Get Complete GOOG Trend Analysis ➞ | |
 | GOOGL Alphabet Inc |
| Sector: Technology | |
| SubSector: Internet Content & Information | |
| MarketCap: 2843010 Millions | |
| Recent Price: 249.91 Smart Investing & Trading Score: 90 | |
| Day Percent Change: -0.675649% Day Change: -1.7 | |
| Week Change: 6.78089% Year-to-date Change: 32.2% | |
| GOOGL Links: Profile News Message Board | |
| Charts:- Daily , Weekly | |
| Add GOOGL to Watchlist: View: Get Complete GOOGL Trend Analysis ➞ | |
 | AMZN Amazon.com Inc |
| Sector: Services & Goods | |
| SubSector: Internet Retail | |
| MarketCap: 2477780 Millions | |
| Recent Price: 233.45 Smart Investing & Trading Score: 90 | |
| Day Percent Change: 0.872834% Day Change: 2.02 | |
| Week Change: -1.0134% Year-to-date Change: 6.0% | |
| AMZN Links: Profile News Message Board | |
| Charts:- Daily , Weekly | |
| Add AMZN to Watchlist: View: Get Complete AMZN Trend Analysis ➞ | |
 | META Meta Platforms Inc |
| Sector: Technology | |
| SubSector: Internet Content & Information | |
| MarketCap: 1890130 Millions | |
| Recent Price: 768.90 Smart Investing & Trading Score: 70 | |
| Day Percent Change: 0.549235% Day Change: 4.2 | |
| Week Change: 2.20657% Year-to-date Change: 28.5% | |
| META Links: Profile News Message Board | |
| Charts:- Daily , Weekly | |
| Add META to Watchlist: View: Get Complete META Trend Analysis ➞ | |
 | AVGO Broadcom Inc |
| Sector: Technology | |
| SubSector: Semiconductors | |
| MarketCap: 1575150 Millions | |
| Recent Price: 362.52 Smart Investing & Trading Score: 90 | |
| Day Percent Change: -0.431212% Day Change: -1.57 | |
| Week Change: 4.88066% Year-to-date Change: 57.1% | |
| AVGO Links: Profile News Message Board | |
| Charts:- Daily , Weekly | |
| Add AVGO to Watchlist: View: Get Complete AVGO Trend Analysis ➞ | |
 | TSLA Tesla Inc |
| Sector: Services & Goods | |
| SubSector: Auto Manufacturers | |
| MarketCap: 1131620 Millions | |
| Recent Price: 415.75 Smart Investing & Trading Score: 100 | |
| Day Percent Change: 1.39255% Day Change: 5.71 | |
| Week Change: 20.0202% Year-to-date Change: 9.6% | |
| TSLA Links: Profile News Message Board | |
| Charts:- Daily , Weekly | |
| Add TSLA to Watchlist: View: Get Complete TSLA Trend Analysis ➞ | |
 | NFLX Netflix Inc |
| Sector: Technology | |
| SubSector: Entertainment | |
| MarketCap: 528532 Millions | |
| Recent Price: 1203.44 Smart Investing & Trading Score: 20 | |
| Day Percent Change: 0.0981485% Day Change: 1.18 | |
| Week Change: -3.31952% Year-to-date Change: 35.7% | |
| NFLX Links: Profile News Message Board | |
| Charts:- Daily , Weekly | |
| Add NFLX to Watchlist: View: Get Complete NFLX Trend Analysis ➞ | |
 | COST Costco Wholesale Corp |
| Sector: Consumer Staples | |
| SubSector: Discount Stores | |
| MarketCap: 427281 Millions | |
| Recent Price: 956.39 Smart Investing & Trading Score: 30 | |
| Day Percent Change: -0.386418% Day Change: -3.71 | |
| Week Change: -1.59078% Year-to-date Change: 5.5% | |
| COST Links: Profile News Message Board | |
| Charts:- Daily , Weekly | |
| Add COST to Watchlist: View: Get Complete COST Trend Analysis ➞ | |
 | ASML ASML Holding NV |
| Sector: Technology | |
| SubSector: Semiconductor Equipment & Materials | |
| MarketCap: 307427 Millions | |
| Recent Price: 875.34 Smart Investing & Trading Score: 100 | |
| Day Percent Change: 0.927015% Day Change: 8.04 | |
| Week Change: 9.93281% Year-to-date Change: 25.9% | |
| ASML Links: Profile News Message Board | |
| Charts:- Daily , Weekly | |
| Add ASML to Watchlist: View: Get Complete ASML Trend Analysis ➞ | |
 | TMUS T-Mobile US Inc |
| Sector: Technology | |
| SubSector: Telecom Services | |
| MarketCap: 284461 Millions | |
| Recent Price: 237.25 Smart Investing & Trading Score: 10 | |
| Day Percent Change: -1.03863% Day Change: -2.49 | |
| Week Change: -2.32606% Year-to-date Change: 8.8% | |
| TMUS Links: Profile News Message Board | |
| Charts:- Daily , Weekly | |
| Add TMUS to Watchlist: View: Get Complete TMUS Trend Analysis ➞ | |
 | CSCO Cisco Systems, Inc |
| Sector: Technology | |
| SubSector: Communication Equipment | |
| MarketCap: 264469 Millions | |
| Recent Price: 66.93 Smart Investing & Trading Score: 10 | |
| Day Percent Change: -0.164081% Day Change: -0.11 | |
| Week Change: 0.0747608% Year-to-date Change: 15.5% | |
| CSCO Links: Profile News Message Board | |
| Charts:- Daily , Weekly | |
| Add CSCO to Watchlist: View: Get Complete CSCO Trend Analysis ➞ | |
 | AZN Astrazeneca plc ADR |
| Sector: Health Care | |
| SubSector: Drug Manufacturers - General | |
| MarketCap: 253309 Millions | |
| Recent Price: 77.72 Smart Investing & Trading Score: 30 | |
| Day Percent Change: -0.422806% Day Change: -0.33 | |
| Week Change: -4.70819% Year-to-date Change: 20.4% | |
| AZN Links: Profile News Message Board | |
| Charts:- Daily , Weekly | |
| Add AZN to Watchlist: View: Get Complete AZN Trend Analysis ➞ | |
 | AMD Advanced Micro Devices Inc |
| Sector: Technology | |
| SubSector: Semiconductors | |
| MarketCap: 245277 Millions | |
| Recent Price: 160.30 Smart Investing & Trading Score: 60 | |
| Day Percent Change: -0.533631% Day Change: -0.86 | |
| Week Change: 5.87147% Year-to-date Change: 32.9% | |
| AMD Links: Profile News Message Board | |
| Charts:- Daily , Weekly | |
| Add AMD to Watchlist: View: Get Complete AMD Trend Analysis ➞ | |
 | PEP PepsiCo Inc |
| Sector: Consumer Staples | |
| SubSector: Beverages - Non-Alcoholic | |
| MarketCap: 200419 Millions | |
| Recent Price: 141.12 Smart Investing & Trading Score: 40 | |
| Day Percent Change: 0.341297% Day Change: 0.48 | |
| Week Change: -0.416343% Year-to-date Change: -4.2% | |
| PEP Links: Profile News Message Board | |
| Charts:- Daily , Weekly | |
| Add PEP to Watchlist: View: Get Complete PEP Trend Analysis ➞ | |
 | INTU Intuit Inc |
| Sector: Technology | |
| SubSector: Software - Application | |
| MarketCap: 187586 Millions | |
| Recent Price: 646.71 Smart Investing & Trading Score: 0 | |
| Day Percent Change: -0.709318% Day Change: -4.62 | |
| Week Change: -3.71754% Year-to-date Change: 4.3% | |
| INTU Links: Profile News Message Board | |
| Charts:- Daily , Weekly | |
| Add INTU to Watchlist: View: Get Complete INTU Trend Analysis ➞ | |
 | BKNG Booking Holdings Inc |
| Sector: Services & Goods | |
| SubSector: Travel Services | |
| MarketCap: 178442 Millions | |
| Recent Price: 5509.77 Smart Investing & Trading Score: 40 | |
| Day Percent Change: -0.900387% Day Change: -50.06 | |
| Week Change: -1.076% Year-to-date Change: 12.3% | |
| BKNG Links: Profile News Message Board | |
| Charts:- Daily , Weekly | |
| Add BKNG to Watchlist: View: Get Complete BKNG Trend Analysis ➞ | |
 | PDD PDD Holdings Inc ADR |
| Sector: Services & Goods | |
| SubSector: Internet Retail | |
| MarketCap: 173152 Millions | |
| Recent Price: 129.15 Smart Investing & Trading Score: 100 | |
| Day Percent Change: 1.38158% Day Change: 1.76 | |
| Week Change: 3.29521% Year-to-date Change: 33.3% | |
| PDD Links: Profile News Message Board | |
| Charts:- Daily , Weekly | |
| Add PDD to Watchlist: View: Get Complete PDD Trend Analysis ➞ | |
 | QCOM Qualcomm, Inc |
| Sector: Technology | |
| SubSector: Semiconductors | |
| MarketCap: 172467 Millions | |
| Recent Price: 163.15 Smart Investing & Trading Score: 100 | |
| Day Percent Change: 1.19712% Day Change: 1.93 | |
| Week Change: 1.81603% Year-to-date Change: 7.4% | |
| QCOM Links: Profile News Message Board | |
| Charts:- Daily , Weekly | |
| Add QCOM to Watchlist: View: Get Complete QCOM Trend Analysis ➞ | |
 | TXN Texas Instruments Inc |
| Sector: Technology | |
| SubSector: Semiconductors | |
| MarketCap: 170854 Millions | |
| Recent Price: 179.00 Smart Investing & Trading Score: 10 | |
| Day Percent Change: 0.448934% Day Change: 0.8 | |
| Week Change: -3.67022% Year-to-date Change: -2.0% | |
| TXN Links: Profile News Message Board | |
| Charts:- Daily , Weekly | |
| Add TXN to Watchlist: View: Get Complete TXN Trend Analysis ➞ | |
 | ISRG Intuitive Surgical Inc |
| Sector: Health Care | |
| SubSector: Medical Instruments & Supplies | |
| MarketCap: 167358 Millions | |
| Recent Price: 431.86 Smart Investing & Trading Score: 0 | |
| Day Percent Change: -0.490795% Day Change: -2.13 | |
| Week Change: -8.11489% Year-to-date Change: -17.6% | |
| ISRG Links: Profile News Message Board | |
| Charts:- Daily , Weekly | |
| Add ISRG to Watchlist: View: Get Complete ISRG Trend Analysis ➞ | |
 | AMGN AMGEN Inc |
| Sector: Health Care | |
| SubSector: Drug Manufacturers - General | |
| MarketCap: 152701 Millions | |
| Recent Price: 275.92 Smart Investing & Trading Score: 10 | |
| Day Percent Change: 0.553936% Day Change: 1.52 | |
| Week Change: -1.52397% Year-to-date Change: 8.2% | |
| AMGN Links: Profile News Message Board | |
| Charts:- Daily , Weekly | |
| Add AMGN to Watchlist: View: Get Complete AMGN Trend Analysis ➞ | |
 | ADBE Adobe Inc |
| Sector: Technology | |
| SubSector: Software - Application | |
| MarketCap: 148033 Millions | |
| Recent Price: 352.00 Smart Investing & Trading Score: 50 | |
| Day Percent Change: 1.4117% Day Change: 4.9 | |
| Week Change: -1.85691% Year-to-date Change: -20.2% | |
| ADBE Links: Profile News Message Board | |
| Charts:- Daily , Weekly | |
| Add ADBE to Watchlist: View: Get Complete ADBE Trend Analysis ➞ | |
 | MU Micron Technology Inc |
| Sector: Technology | |
| SubSector: Semiconductors | |
| MarketCap: 147019 Millions | |
| Recent Price: 158.62 Smart Investing & Trading Score: 90 | |
| Day Percent Change: 0.538759% Day Change: 0.85 | |
| Week Change: 20.6603% Year-to-date Change: 82.0% | |
| MU Links: Profile News Message Board | |
| Charts:- Daily , Weekly | |
| Add MU to Watchlist: View: Get Complete MU Trend Analysis ➞ | |
 | GILD Gilead Sciences, Inc |
| Sector: Health Care | |
| SubSector: Drug Manufacturers - General | |
| MarketCap: 142755 Millions | |
| Recent Price: 112.54 Smart Investing & Trading Score: 10 | |
| Day Percent Change: 0% Day Change: 0 | |
| Week Change: -2.88229% Year-to-date Change: 24.2% | |
| GILD Links: Profile News Message Board | |
| Charts:- Daily , Weekly | |
| Add GILD to Watchlist: View: Get Complete GILD Trend Analysis ➞ | |
 | HON Honeywell International Inc |
| Sector: Industrials | |
| SubSector: Conglomerates | |
| MarketCap: 136027 Millions | |
| Recent Price: 212.01 Smart Investing & Trading Score: 10 | |
| Day Percent Change: 0.127515% Day Change: 0.27 | |
| Week Change: -1.2759% Year-to-date Change: -5.0% | |
| HON Links: Profile News Message Board | |
| Charts:- Daily , Weekly | |
| Add HON to Watchlist: View: Get Complete HON Trend Analysis ➞ | |
 | LRCX Lam Research Corp |
| Sector: Technology | |
| SubSector: Semiconductor Equipment & Materials | |
| MarketCap: 130296 Millions | |
| Recent Price: 119.38 Smart Investing & Trading Score: 100 | |
| Day Percent Change: 0.142605% Day Change: 0.17 | |
| Week Change: 13.6195% Year-to-date Change: 65.7% | |
| LRCX Links: Profile News Message Board | |
| Charts:- Daily , Weekly | |
| Add LRCX to Watchlist: View: Get Complete LRCX Trend Analysis ➞ | |
 | PANW Palo Alto Networks Inc |
| Sector: Technology | |
| SubSector: Software - Infrastructure | |
| MarketCap: 130074 Millions | |
| Recent Price: 199.58 Smart Investing & Trading Score: 80 | |
| Day Percent Change: -0.844595% Day Change: -1.7 | |
| Week Change: 1.1146% Year-to-date Change: 10.4% | |
| PANW Links: Profile News Message Board | |
| Charts:- Daily , Weekly | |
| Add PANW to Watchlist: View: Get Complete PANW Trend Analysis ➞ | |
| For tabular summary view of above stock list: Summary View ➞ 0 - 30 , 30 - 60 , 60 - 90 , 90 - 120 | ||
| Click To Change The Sort Order: By Market Cap or Company Size Performance: Year-to-date, Week and Day | |
| Select Chart Type: | ||
|
Best Stocks Today 12Stocks.com |
© 2025 12Stocks.com Terms & Conditions Privacy Contact Us
All Information Provided Only For Education And Not To Be Used For Investing or Trading. See Terms & Conditions


One More Thing ... Get Best Stocks Delivered Daily!
Never Ever Miss A Move With Our Top Ten Stocks Lists
Find Best Stocks In Any Market - Bull or Bear Market
Take A Peek At Our Top Ten Stocks Lists: Daily, Weekly, Year-to-Date & Top Trends
Find Best Stocks In Any Market - Bull or Bear Market
Take A Peek At Our Top Ten Stocks Lists: Daily, Weekly, Year-to-Date & Top Trends
Nasdaq 100 Stocks With Best Up Trends [0-bearish to 100-bullish]: Tesla [100], PDD [100], Qualcomm [100], ASML Holding[100], Intel Corp[100], Lam Research[100], UltraPro[100], KLA Corp[100], Monster Beverage[90], Amazon.com [90], Electronic Arts[90]
Best Nasdaq 100 Stocks Year-to-Date:
Micron [82.0406%], Warner Bros.[69.92%], Lam Research[65.7071%], Idexx [57.1481%], Broadcom [57.116%], KLA Corp[55.6481%], Zscaler [53.6442%], DoorDash [52.1477%], Fastenal Co[36.2144%], Netflix [35.7166%], Take-Two Interactive[35.5383%] Best Nasdaq 100 Stocks This Week:
Splunk [38.7643%], Micron [20.6603%], Tesla [20.0202%], Lam Research[13.6195%], ASML Holding[9.93281%], Constellation Energy[9.57098%], KLA Corp[8.50404%], Google [7.0123%], Google [6.78089%], UltraPro[6.30302%], Applied Materials[6.20179%] Best Nasdaq 100 Stocks Daily:
Moderna [3.09883%], ON Semiconductor[2.20328%], Diamondback Energy[1.58329%], Starbucks Corp[1.56023%], Adobe [1.4117%], Apple [1.38572%], Tesla [1.39255%], PDD [1.38158%], Dexcom [1.36279%], Microchip [1.21893%], Qualcomm [1.19712%]