
 Login Sign Up


| |||||
 |  | ||||

| 12Stocks.com Market Intelligence |
Best MidCap Stocks
|
| In a hurry? Mid Cap Stocks Lists: Performance Trends Table, Stock Charts
Sort midcap stocks: Daily, Weekly, Year-to-Date, Market Cap & Trends. Filter midcap stocks list by sector: Show all, Tech, Finance, Energy, Staples, Retail, Industrial, Materials, Utilities and HealthCare Filter midcap stocks list by size:All MidCap Large Mid-Range Small |
| 12Stocks.com Mid Cap Stocks Performances & Trends Daily | |||||||||
|
|  The overall Smart Investing & Trading Score is 45 (0-bearish to 100-bullish) which puts Mid Cap index in short term neutral trend. The Smart Investing & Trading Score from previous trading session is 7 and hence an improvement of trend.
| ||||||||
Here are the Smart Investing & Trading Scores of the most requested mid cap stocks at 12Stocks.com (click stock name for detailed review):
|


| 12Stocks.com: Top Performing Mid Cap Index Stocks | ||||||||||||||||||||||||||||||||||||||||||||||||
 The top performing Mid Cap Index stocks year to date are
Now, more recently, over last week, the top performing Mid Cap Index stocks on the move are


|
||||||||||||||||||||||||||||||||||||||||||||||||
| 12Stocks.com: Investing in Midcap Index with Stocks | |
|
The following table helps investors and traders sort through current performance and trends (as measured by Smart Investing & Trading Score) of various
stocks in the Midcap Index. Quick View: Move mouse or cursor over stock symbol (ticker) to view short-term technical chart and over stock name to view long term chart. Click on  to add stock symbol to your watchlist and to add stock symbol to your watchlist and  to view watchlist. Click on any ticker or stock name for detailed market intelligence report for that stock. to view watchlist. Click on any ticker or stock name for detailed market intelligence report for that stock. |
12Stocks.com Performance of Stocks in Midcap Index
| Ticker | Stock Name | Watchlist | Category | Recent Price | Smart Investing & Trading Score | Change % | YTD Change% |
| G | Genpact |   | Technology | 31.34 | 67 | 0.11% | -9.69% |
| INFA | Informatica | | Technology | 30.16 | 10 | -3.15% | 6.14% |
| CACI | CACI | | Technology | 413.00 | 95 | 0.50% | 27.52% |
| ON | ON Semiconductor | | Technology | 71.58 | 47 | 2.24% | -14.31% |
| SMAR | Smartsheet | | Technology | 38.95 | 52 | 1.46% | -18.55% |
| HCP | HashiCorp | | Technology | 32.76 | 76 | 0.32% | 35.80% |
| MORN | Morningstar | | Technology | 294.45 | 32 | 1.19% | 2.87% |
| LITE | Lumentum | | Technology | 45.81 | 67 | 3.43% | -12.61% |
| PCTY | Paylocity Holding | | Technology | 172.32 | 10 | 15.19% | 4.53% |
| AFRM | Affirm | | Technology | 35.79 | 64 | 6.11% | -26.90% |
| SNX | SYNNEX | | Technology | 117.52 | 58 | 0.94% | 9.21% |
| MKSI | MKS Instruments | | Technology | 122.66 | 17 | 3.97% | 19.24% |
| ST | Sensata Technologies | | Technology | 39.98 | 100 | 1.47% | 6.41% |
| ESTC | Elastic N.V | | Technology | 106.66 | 45 | 0.53% | -5.36% |
| S | SentinelOne | | Technology | 21.59 | 22 | 0.44% | -21.30% |
| FIVN | Five9 | | Technology | 59.81 | 10 | 5.44% | -23.99% |
| PYCR | Paycor HCM | | Technology | 17.34 | 0 | 3.74% | -19.97% |
| Z | Zillow | | Technology | 41.50 | 0 | 4.17% | -28.28% |
| CRUS | Cirrus Logic | | Technology | 88.44 | 7 | 2.94% | 6.30% |
| MRCY | Mercury | | Technology | 29.65 | 74 | 1.06% | -18.92% |
| DXC | DXC | | Technology | 19.23 | 0 | 1.77% | -15.89% |
| FSLR | First Solar | | Technology | 190.63 | 59 | 5.61% | 10.65% |
| MANH | Manhattan Associates | | Technology | 211.47 | 25 | 1.26% | -1.79% |
| SAIC | Science Applications | | Technology | 130.64 | 52 | 0.62% | 5.08% |
| NTNX | Nutanix | | Technology | 63.34 | 25 | 1.84% | 32.81% |
| For chart view version of above stock list: Chart View ➞ 0 - 25 , 25 - 50 , 50 - 75 , 75 - 100 , 100 - 125 , 125 - 150 | ||
 | Click To Change The Sort Order: By Market Cap or Company Size Performance: Year-to-date, Week and Day |  |
|
Get the most comprehensive stock market coverage daily at 12Stocks.com ➞ Best Stocks Today ➞ Best Stocks Weekly ➞ Best Stocks Year-to-Date ➞ Best Stocks Trends ➞  Best Stocks Today 12Stocks.com Best Nasdaq Stocks ➞ Best S&P 500 Stocks ➞ Best Tech Stocks ➞ Best Biotech Stocks ➞ |
| Detailed Overview of Midcap Stocks |
| Midcap Technical Overview, Leaders & Laggards, Top Midcap ETF Funds & Detailed Midcap Stocks List, Charts, Trends & More |
| Midcap: Technical Analysis, Trends & YTD Performance | |
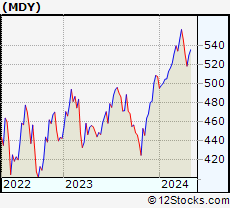
| MidCap segment as represented by
MDY, an exchange-traded fund [ETF], holds basket of about four hundred midcap stocks from across all major sectors of the US stock market. The midcap index (contains stocks like Green Mountain Coffee Roasters and Tractor Supply Company) is up by 5.98% and is currently underperforming the overall market by -0.81% year-to-date. Below is a quick view of technical charts and trends: | |
 MDY Weekly Chart |
|
| Long Term Trend: Good | |
| Medium Term Trend: Good | |
 MDY Daily Chart |
|
| Short Term Trend: Deteriorating | |
| Overall Trend Score: 45 | |
| YTD Performance: 5.98% | |
| **Trend Scores & Views Are Only For Educational Purposes And Not For Investing | |
| 12Stocks.com: Investing in Midcap Index using Exchange Traded Funds | |
|
The following table shows list of key exchange traded funds (ETF) that
help investors track Midcap index. The following list also includes leveraged ETF funds that track twice or thrice the daily returns of Midcap indices. Short or inverse ETF funds move in the opposite direction to the index they track and are useful during market pullbacks or during bear markets. Quick View: Move mouse or cursor over ETF symbol (ticker) to view short-term technical chart and over ETF name to view long term chart. Click on ticker or stock name for detailed view. Click on to add stock symbol to your watchlist and to view watchlist. |
12Stocks.com List of ETFs that track Midcap Index
| Ticker | ETF Name | Watchlist | Recent Price | Smart Investing & Trading Score | Change % | Week % | Year-to-date % |
| MDY | SPDR S&P MidCap 400 ETF | | 537.70 | 45 | 1.44 | 1.57 | 5.98% |
| SMDD | ProShares UltraPro Short MidCap400 | | 11.15 | 40 | -5.35 | -5.75 | -17.18% |
| UMDD | ProShares UltraPro MidCap400 | | 24.95 | 10 | 4.23 | 4.14 | 11.79% |
| MZZ | ProShares UltraShort MidCap400 | | 11.33 | 33 | -3.16 | -3 | -9.87% |
| MYY | ProShares Short MidCap400 | | 20.43 | 48 | -1.45 | -1.73 | -4.78% |
| 12Stocks.com: Charts, Trends, Fundamental Data and Performances of MidCap Stocks | |
|
We now take in-depth look at all MidCap stocks including charts, multi-period performances and overall trends (as measured by Smart Investing & Trading Score). One can sort MidCap stocks (click link to choose) by Daily, Weekly and by Year-to-Date performances. Also, one can sort by size of the company or by market capitalization. |
| Select Your Default Chart Type: | |||||
| |||||
| Click on stock symbol or name for detailed view. Click on to add stock symbol to your watchlist and to view watchlist. Quick View: Move mouse or cursor over "Daily" to quickly view daily technical stock chart and over "Weekly" to view weekly technical stock chart. | |||||

 | G Genpact Limited |
| Sector: Technology | |
| SubSector: Information Technology Services | |
| MarketCap: 5485.78 Millions | |
| Recent Price: 31.34 Smart Investing & Trading Score: 67 | |
| Day Percent Change: 0.11% Day Change: 0.04 | |
| Week Change: 1.44% Year-to-date Change: -9.7% | |
| G Links: Profile News Message Board | |
| Charts:- Daily , Weekly | |
| Add G to Watchlist: View: Get Complete G Trend Analysis ➞ | |
 | INFA Informatica Inc. |
| Sector: Technology | |
| SubSector: Software - Infrastructure | |
| MarketCap: 5340 Millions | |
| Recent Price: 30.16 Smart Investing & Trading Score: 10 | |
| Day Percent Change: -3.15% Day Change: -0.98 | |
| Week Change: -5.44% Year-to-date Change: 6.1% | |
| INFA Links: Profile News Message Board | |
| Charts:- Daily , Weekly | |
| Add INFA to Watchlist: View: Get Complete INFA Trend Analysis ➞ | |
 | CACI CACI International Inc |
| Sector: Technology | |
| SubSector: Information Technology Services | |
| MarketCap: 5211.58 Millions | |
| Recent Price: 413.00 Smart Investing & Trading Score: 95 | |
| Day Percent Change: 0.50% Day Change: 2.04 | |
| Week Change: 2.01% Year-to-date Change: 27.5% | |
| CACI Links: Profile News Message Board | |
| Charts:- Daily , Weekly | |
| Add CACI to Watchlist: View: Get Complete CACI Trend Analysis ➞ | |
 | ON ON Semiconductor Corporation |
| Sector: Technology | |
| SubSector: Semiconductor - Broad Line | |
| MarketCap: 5183.82 Millions | |
| Recent Price: 71.58 Smart Investing & Trading Score: 47 | |
| Day Percent Change: 2.24% Day Change: 1.57 | |
| Week Change: 5.17% Year-to-date Change: -14.3% | |
| ON Links: Profile News Message Board | |
| Charts:- Daily , Weekly | |
| Add ON to Watchlist: View: Get Complete ON Trend Analysis ➞ | |
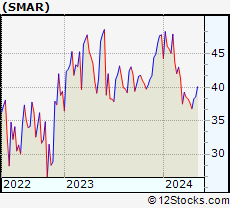 | SMAR Smartsheet Inc. |
| Sector: Technology | |
| SubSector: Business Software & Services | |
| MarketCap: 5159.38 Millions | |
| Recent Price: 38.95 Smart Investing & Trading Score: 52 | |
| Day Percent Change: 1.46% Day Change: 0.56 | |
| Week Change: 1.75% Year-to-date Change: -18.6% | |
| SMAR Links: Profile News Message Board | |
| Charts:- Daily , Weekly | |
| Add SMAR to Watchlist: View: Get Complete SMAR Trend Analysis ➞ | |
 | HCP HashiCorp, Inc. |
| Sector: Technology | |
| SubSector: Software - Infrastructure | |
| MarketCap: 5070 Millions | |
| Recent Price: 32.76 Smart Investing & Trading Score: 76 | |
| Day Percent Change: 0.32% Day Change: 0.11 | |
| Week Change: 0.44% Year-to-date Change: 35.8% | |
| HCP Links: Profile News Message Board | |
| Charts:- Daily , Weekly | |
| Add HCP to Watchlist: View: Get Complete HCP Trend Analysis ➞ | |
 | MORN Morningstar, Inc. |
| Sector: Technology | |
| SubSector: Information & Delivery Services | |
| MarketCap: 4997.87 Millions | |
| Recent Price: 294.45 Smart Investing & Trading Score: 32 | |
| Day Percent Change: 1.19% Day Change: 3.47 | |
| Week Change: 2.85% Year-to-date Change: 2.9% | |
| MORN Links: Profile News Message Board | |
| Charts:- Daily , Weekly | |
| Add MORN to Watchlist: View: Get Complete MORN Trend Analysis ➞ | |
 | LITE Lumentum Holdings Inc. |
| Sector: Technology | |
| SubSector: Communication Equipment | |
| MarketCap: 4990.49 Millions | |
| Recent Price: 45.81 Smart Investing & Trading Score: 67 | |
| Day Percent Change: 3.43% Day Change: 1.52 | |
| Week Change: 5.5% Year-to-date Change: -12.6% | |
| LITE Links: Profile News Message Board | |
| Charts:- Daily , Weekly | |
| Add LITE to Watchlist: View: Get Complete LITE Trend Analysis ➞ | |
 | PCTY Paylocity Holding Corporation |
| Sector: Technology | |
| SubSector: Application Software | |
| MarketCap: 4972.82 Millions | |
| Recent Price: 172.32 Smart Investing & Trading Score: 10 | |
| Day Percent Change: 15.19% Day Change: 22.72 | |
| Week Change: 9.72% Year-to-date Change: 4.5% | |
| PCTY Links: Profile News Message Board | |
| Charts:- Daily , Weekly | |
| Add PCTY to Watchlist: View: Get Complete PCTY Trend Analysis ➞ | |
 | AFRM Affirm Holdings, Inc. |
| Sector: Technology | |
| SubSector: Software - Infrastructure | |
| MarketCap: 4560 Millions | |
| Recent Price: 35.79 Smart Investing & Trading Score: 64 | |
| Day Percent Change: 6.11% Day Change: 2.06 | |
| Week Change: 7.35% Year-to-date Change: -26.9% | |
| AFRM Links: Profile News Message Board | |
| Charts:- Daily , Weekly | |
| Add AFRM to Watchlist: View: Get Complete AFRM Trend Analysis ➞ | |
 | SNX SYNNEX Corporation |
| Sector: Technology | |
| SubSector: Information Technology Services | |
| MarketCap: 4519.48 Millions | |
| Recent Price: 117.52 Smart Investing & Trading Score: 58 | |
| Day Percent Change: 0.94% Day Change: 1.10 | |
| Week Change: 0.07% Year-to-date Change: 9.2% | |
| SNX Links: Profile News Message Board | |
| Charts:- Daily , Weekly | |
| Add SNX to Watchlist: View: Get Complete SNX Trend Analysis ➞ | |
 | MKSI MKS Instruments, Inc. |
| Sector: Technology | |
| SubSector: Scientific & Technical Instruments | |
| MarketCap: 4502.93 Millions | |
| Recent Price: 122.66 Smart Investing & Trading Score: 17 | |
| Day Percent Change: 3.97% Day Change: 4.68 | |
| Week Change: 1.58% Year-to-date Change: 19.2% | |
| MKSI Links: Profile News Message Board | |
| Charts:- Daily , Weekly | |
| Add MKSI to Watchlist: View: Get Complete MKSI Trend Analysis ➞ | |
 | ST Sensata Technologies Holding plc |
| Sector: Technology | |
| SubSector: Scientific & Technical Instruments | |
| MarketCap: 4434.23 Millions | |
| Recent Price: 39.98 Smart Investing & Trading Score: 100 | |
| Day Percent Change: 1.47% Day Change: 0.58 | |
| Week Change: 14.29% Year-to-date Change: 6.4% | |
| ST Links: Profile News Message Board | |
| Charts:- Daily , Weekly | |
| Add ST to Watchlist: View: Get Complete ST Trend Analysis ➞ | |
 | ESTC Elastic N.V. |
| Sector: Technology | |
| SubSector: Application Software | |
| MarketCap: 4420.92 Millions | |
| Recent Price: 106.66 Smart Investing & Trading Score: 45 | |
| Day Percent Change: 0.53% Day Change: 0.56 | |
| Week Change: -0.72% Year-to-date Change: -5.4% | |
| ESTC Links: Profile News Message Board | |
| Charts:- Daily , Weekly | |
| Add ESTC to Watchlist: View: Get Complete ESTC Trend Analysis ➞ | |
 | S SentinelOne, Inc. |
| Sector: Technology | |
| SubSector: Software - Infrastructure | |
| MarketCap: 4420 Millions | |
| Recent Price: 21.59 Smart Investing & Trading Score: 22 | |
| Day Percent Change: 0.44% Day Change: 0.09 | |
| Week Change: 0.16% Year-to-date Change: -21.3% | |
| S Links: Profile News Message Board | |
| Charts:- Daily , Weekly | |
| Add S to Watchlist: View: Get Complete S Trend Analysis ➞ | |
 | FIVN Five9, Inc. |
| Sector: Technology | |
| SubSector: Application Software | |
| MarketCap: 4253.62 Millions | |
| Recent Price: 59.81 Smart Investing & Trading Score: 10 | |
| Day Percent Change: 5.44% Day Change: 3.09 | |
| Week Change: 1.42% Year-to-date Change: -24.0% | |
| FIVN Links: Profile News Message Board | |
| Charts:- Daily , Weekly | |
| Add FIVN to Watchlist: View: Get Complete FIVN Trend Analysis ➞ | |
 | PYCR Paycor HCM, Inc. |
| Sector: Technology | |
| SubSector: Software - Application | |
| MarketCap: 4220 Millions | |
| Recent Price: 17.34 Smart Investing & Trading Score: 0 | |
| Day Percent Change: 3.74% Day Change: 0.63 | |
| Week Change: -3.05% Year-to-date Change: -20.0% | |
| PYCR Links: Profile News Message Board | |
| Charts:- Daily , Weekly | |
| Add PYCR to Watchlist: View: Get Complete PYCR Trend Analysis ➞ | |
 | Z Zillow Group, Inc. |
| Sector: Technology | |
| SubSector: Internet Information Providers | |
| MarketCap: 3880.4 Millions | |
| Recent Price: 41.50 Smart Investing & Trading Score: 0 | |
| Day Percent Change: 4.17% Day Change: 1.66 | |
| Week Change: -4.97% Year-to-date Change: -28.3% | |
| Z Links: Profile News Message Board | |
| Charts:- Daily , Weekly | |
| Add Z to Watchlist: View: Get Complete Z Trend Analysis ➞ | |
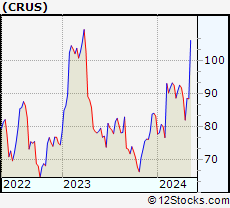 | CRUS Cirrus Logic, Inc. |
| Sector: Technology | |
| SubSector: Semiconductor - Specialized | |
| MarketCap: 3852.6 Millions | |
| Recent Price: 88.44 Smart Investing & Trading Score: 7 | |
| Day Percent Change: 2.94% Day Change: 2.53 | |
| Week Change: -0.11% Year-to-date Change: 6.3% | |
| CRUS Links: Profile News Message Board | |
| Charts:- Daily , Weekly | |
| Add CRUS to Watchlist: View: Get Complete CRUS Trend Analysis ➞ | |
 | MRCY Mercury Systems, Inc. |
| Sector: Technology | |
| SubSector: Computer Peripherals | |
| MarketCap: 3797.09 Millions | |
| Recent Price: 29.65 Smart Investing & Trading Score: 74 | |
| Day Percent Change: 1.06% Day Change: 0.31 | |
| Week Change: 1.96% Year-to-date Change: -18.9% | |
| MRCY Links: Profile News Message Board | |
| Charts:- Daily , Weekly | |
| Add MRCY to Watchlist: View: Get Complete MRCY Trend Analysis ➞ | |
 | DXC DXC Technology Company |
| Sector: Technology | |
| SubSector: Information Technology Services | |
| MarketCap: 3622.28 Millions | |
| Recent Price: 19.23 Smart Investing & Trading Score: 0 | |
| Day Percent Change: 1.77% Day Change: 0.34 | |
| Week Change: -4.21% Year-to-date Change: -15.9% | |
| DXC Links: Profile News Message Board | |
| Charts:- Daily , Weekly | |
| Add DXC to Watchlist: View: Get Complete DXC Trend Analysis ➞ | |
 | FSLR First Solar, Inc. |
| Sector: Technology | |
| SubSector: Semiconductor - Specialized | |
| MarketCap: 3617.9 Millions | |
| Recent Price: 190.63 Smart Investing & Trading Score: 59 | |
| Day Percent Change: 5.61% Day Change: 10.12 | |
| Week Change: 6.66% Year-to-date Change: 10.7% | |
| FSLR Links: Profile News Message Board | |
| Charts:- Daily , Weekly | |
| Add FSLR to Watchlist: View: Get Complete FSLR Trend Analysis ➞ | |
 | MANH Manhattan Associates, Inc. |
| Sector: Technology | |
| SubSector: Application Software | |
| MarketCap: 3487.02 Millions | |
| Recent Price: 211.47 Smart Investing & Trading Score: 25 | |
| Day Percent Change: 1.26% Day Change: 2.63 | |
| Week Change: 1.17% Year-to-date Change: -1.8% | |
| MANH Links: Profile News Message Board | |
| Charts:- Daily , Weekly | |
| Add MANH to Watchlist: View: Get Complete MANH Trend Analysis ➞ | |
 | SAIC Science Applications International Corporation |
| Sector: Technology | |
| SubSector: Information Technology Services | |
| MarketCap: 3388.78 Millions | |
| Recent Price: 130.64 Smart Investing & Trading Score: 52 | |
| Day Percent Change: 0.62% Day Change: 0.80 | |
| Week Change: 0.9% Year-to-date Change: 5.1% | |
| SAIC Links: Profile News Message Board | |
| Charts:- Daily , Weekly | |
| Add SAIC to Watchlist: View: Get Complete SAIC Trend Analysis ➞ | |
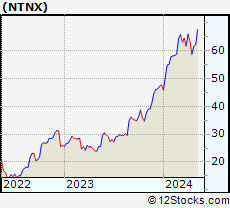 | NTNX Nutanix, Inc. |
| Sector: Technology | |
| SubSector: Technical & System Software | |
| MarketCap: 3376.6 Millions | |
| Recent Price: 63.34 Smart Investing & Trading Score: 25 | |
| Day Percent Change: 1.84% Day Change: 1.15 | |
| Week Change: 2.72% Year-to-date Change: 32.8% | |
| NTNX Links: Profile News Message Board | |
| Charts:- Daily , Weekly | |
| Add NTNX to Watchlist: View: Get Complete NTNX Trend Analysis ➞ | |
| For tabular summary view of above stock list: Summary View ➞ 0 - 25 , 25 - 50 , 50 - 75 , 75 - 100 , 100 - 125 , 125 - 150 | ||
| Click To Change The Sort Order: By Market Cap or Company Size Performance: Year-to-date, Week and Day | |
| Select Chart Type: | ||
|
Best Stocks Today 12Stocks.com |
© 2024 12Stocks.com Terms & Conditions Privacy Contact Us
All Information Provided Only For Education And Not To Be Used For Investing or Trading. See Terms & Conditions


One More Thing ... Get Best Stocks Delivered Daily!
Never Ever Miss A Move With Our Top Ten Stocks Lists
Find Best Stocks In Any Market - Bull or Bear Market
Take A Peek At Our Top Ten Stocks Lists: Daily, Weekly, Year-to-Date & Top Trends
Find Best Stocks In Any Market - Bull or Bear Market
Take A Peek At Our Top Ten Stocks Lists: Daily, Weekly, Year-to-Date & Top Trends
Midcap Stocks With Best Up Trends [0-bearish to 100-bullish]: Medical Properties[100], Columbia Banking[100], Clearway Energy[100], Highwoods Properties[100], Zions Ban[100], Vistra Energy[100], Cognex [100], Brookfield Renewable[100], Maravai LifeSciences[100], Realty[100], Bio-Techne [100]
Best Midcap Stocks Year-to-Date:
Vistra Energy[112.2%], AppLovin [85.48%], ShockWave Medical[73.37%], EMCOR [67.79%], Constellation Energy[64.16%], CAVA [63.09%], Tenet [58.61%], Spotify [57.48%], Natera [53.01%], Williams-Sonoma [51.23%], Wingstop [49.79%] Best Midcap Stocks This Week:
Olaplex [25.37%], Tenet [24.69%], New York[20.03%], Bio-Techne [19.9%], Pinterest [19.14%], NovoCure [18.92%], Wayfair [18.75%], Brookfield Renewable[18.62%], Sunrun [18.56%], Valmont Industries[17.4%], Maravai LifeSciences[16.36%] Best Midcap Stocks Daily:
Paylocity Holding[15.19%], Ginkgo Bioworks[13.85%], MasTec [13.60%], Sunrun [11.42%], Peloton Interactive[10.06%], Plug Power[10.00%], Organon [9.44%], Universal Display[9.31%], Frontier [9.26%], XPO Logistics[8.60%], Rivian Automotive[8.05%]