
 Login Sign Up


| |||||
 |  | ||||

| 12Stocks.com Market Intelligence |
Best MidCap Stocks
|
| In a hurry? Mid Cap Stocks Lists: Performance Trends Table, Stock Charts
Sort midcap stocks: Daily, Weekly, Year-to-Date, Market Cap & Trends. Filter midcap stocks list by sector: Show all, Tech, Finance, Energy, Staples, Retail, Industrial, Materials, Utilities and HealthCare Filter midcap stocks list by size:All MidCap Large Mid-Range Small |
| 12Stocks.com Mid Cap Stocks Performances & Trends Daily | |||||||||
|
|  The overall Smart Investing & Trading Score is 70 (0-bearish to 100-bullish) which puts Mid Cap index in short term neutral to bullish trend. The Smart Investing & Trading Score from previous trading session is 60 and an improvement of trend continues.
| ||||||||
Here are the Smart Investing & Trading Scores of the most requested mid cap stocks at 12Stocks.com (click stock name for detailed review):
|


| 12Stocks.com: Top Performing Mid Cap Index Stocks | ||||||||||||||||||||||||||||||||||||||||||||||||
 The top performing Mid Cap Index stocks year to date are
Now, more recently, over last week, the top performing Mid Cap Index stocks on the move are


|
||||||||||||||||||||||||||||||||||||||||||||||||
| 12Stocks.com: Investing in Midcap Index with Stocks | |
|
The following table helps investors and traders sort through current performance and trends (as measured by Smart Investing & Trading Score) of various
stocks in the Midcap Index. Quick View: Move mouse or cursor over stock symbol (ticker) to view short-term technical chart and over stock name to view long term chart. Click on  to add stock symbol to your watchlist and to add stock symbol to your watchlist and  to view watchlist. Click on any ticker or stock name for detailed market intelligence report for that stock. to view watchlist. Click on any ticker or stock name for detailed market intelligence report for that stock. |
12Stocks.com Performance of Stocks in Midcap Index
| Ticker | Stock Name | Watchlist | Category | Recent Price | Smart Investing & Trading Score | Change % | YTD Change% |
| PH | Parker-Hannifin Corp |   | Industrials | 758.14 | 60 | 0.39% | 21.06% |
| TT | Trane Technologies | | Industrials | 424.44 | 0 | -0.23% | 17.33% |
| CTAS | Cintas | | Industrials | 202.89 | 50 | -0.37% | 11.84% |
| RSG | Republic Services | | Industrials | 222.57 | 0 | -2.08% | 11.77% |
| TDG | Transdigm | | Industrials | 1283.81 | 40 | -1.31% | 2.37% |
| URI | United Rentals | | Industrials | 978.22 | 90 | 1.59% | 42.50% |
| AXON | Axon Enterprise | | Industrials | 720.20 | 40 | 1.25% | 20.74% |
| CARR | Carrier Global | | Industrials | 58.90 | 20 | -0.94% | -13.27% |
| AZEK | AZEK | | Industrials | 54.35 | 70 | -0.93% | 15.42% |
| CMI | Cummins | | Industrials | 432.59 | 90 | 1.87% | 25.74% |
| FAST | Fastenal Co | | Industrials | 48.17 | 40 | 0.94% | 37.64% |
| PWR | Quanta Services | | Industrials | 420.86 | 100 | 0.05% | 33.48% |
| PCAR | Paccar | | Industrials | 99.09 | 50 | 1.41% | -3.56% |
| GWW | W.W. Grainger | | Industrials | 953.75 | 50 | 1.03% | -7.84% |
| CPRT | Copart | | Industrials | 44.57 | 10 | -1.15% | -20.86% |
| AME | Ametek | | Industrials | 186.13 | 30 | -0.70% | 4.74% |
| DAL | Delta Air | | Industrials | 57.08 | 40 | 1.73% | -2.51% |
| HEI | Heico Corp | | Industrials | 317.81 | 20 | -0.63% | 34.10% |
| ROK | Rockwell Automation | | Industrials | 348.69 | 70 | -0.18% | 25.22% |
| VRSK | Verisk Analytics | | Industrials | 247.43 | 30 | -0.85% | -9.22% |
| UAL | United Airlines | | Industrials | 94.83 | 20 | 1.80% | -0.63% |
| XYL | Xylem | | Industrials | 149.01 | 100 | 0.76% | 29.32% |
| OTIS | Otis Worldwide | | Industrials | 92.24 | 100 | -0.13% | 0.83% |
| WAB | Westinghouse Air | | Industrials | 197.87 | 80 | -0.35% | 4.98% |
| IR | Ingersoll-Rand | | Industrials | 84.18 | 90 | 0.81% | -6.96% |
| For chart view version of above stock list: Chart View ➞ 0 - 25 , 25 - 50 , 50 - 75 , 75 - 100 , 100 - 125 | ||
 | Click To Change The Sort Order: By Market Cap or Company Size Performance: Year-to-date, Week and Day |  |
|
Get the most comprehensive stock market coverage daily at 12Stocks.com ➞ Best Stocks Today ➞ Best Stocks Weekly ➞ Best Stocks Year-to-Date ➞ Best Stocks Trends ➞  Best Stocks Today 12Stocks.com Best Nasdaq Stocks ➞ Best S&P 500 Stocks ➞ Best Tech Stocks ➞ Best Biotech Stocks ➞ |
| Detailed Overview of Midcap Stocks |
| Midcap Technical Overview, Leaders & Laggards, Top Midcap ETF Funds & Detailed Midcap Stocks List, Charts, Trends & More |
| Midcap: Technical Analysis, Trends & YTD Performance | |
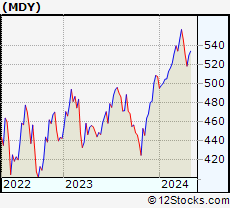
| MidCap segment as represented by
MDY, an exchange-traded fund [ETF], holds basket of about four hundred midcap stocks from across all major sectors of the US stock market. The midcap index (contains stocks like Green Mountain Coffee Roasters and Tractor Supply Company) is up by 5.96788% and is currently underperforming the overall market by -8.79002% year-to-date. Below is a quick view of technical charts and trends: | |
 MDY Weekly Chart |
|
| Long Term Trend: Very Good | |
| Medium Term Trend: Not Good | |
 MDY Daily Chart |
|
| Short Term Trend: Very Good | |
| Overall Trend Score: 70 | |
| YTD Performance: 5.96788% | |
| **Trend Scores & Views Are Only For Educational Purposes And Not For Investing | |
| 12Stocks.com: Investing in Midcap Index using Exchange Traded Funds | |
|
The following table shows list of key exchange traded funds (ETF) that
help investors track Midcap index. The following list also includes leveraged ETF funds that track twice or thrice the daily returns of Midcap indices. Short or inverse ETF funds move in the opposite direction to the index they track and are useful during market pullbacks or during bear markets. Quick View: Move mouse or cursor over ETF symbol (ticker) to view short-term technical chart and over ETF name to view long term chart. Click on ticker or stock name for detailed view. Click on to add stock symbol to your watchlist and to view watchlist. |
12Stocks.com List of ETFs that track Midcap Index
| Ticker | ETF Name | Watchlist | Recent Price | Smart Investing & Trading Score | Change % | Week % | Year-to-date % |
| IJH | iShares Core S&P Mid-Cap ETF | | 65.57 | 70 | 0.122156 | 0.814883 | 6.12728% |
| IWR | iShares Russell Mid-Cap ETF | | 96.94 | 80 | 0.435143 | 1.095 | 10.4451% |
| MDY | S&P MidCap 400 ETF | | 598.78 | 70 | 0.135458 | 0.799623 | 5.96788% |
| IWP | iShares Russell Mid-Cap Growth ETF | | 143.46 | 60 | 1.06375 | 0.709021 | 12.7484% |
| IWS | iShares Russell Mid-Cap Value ETF | | 140.24 | 90 | 0.293213 | 1.2417 | 9.61902% |
| XMLV | Invesco S&P MidCap Low Volatility ETF | | 63.15 | 40 | -0.468716 | 0.529449 | 5.75473% |
| IJK | iShares S&P Mid-Cap 400 Growth ETF | | 96.25 | 70 | 0.176936 | 0.669386 | 6.02707% |
| IJJ | iShares S&P Mid-Cap 400 Value ETF | | 130.47 | 70 | 0.138153 | 0.850274 | 5.90097% |
| MYY | ProShares Short Midcap400 -1x Shares | | 17.72 | 10 | -0.221847 | -0.638093 | -5.50223% |
| UMDD | ProShares UltraPro MidCap400 3x Shares | | 25.88 | 70 | 0.622084 | 2.09476 | -1.51345% |
| MZZ | ProShares UltraShort MidCap400 -2x Shares | | 8.16 | 10 | -0.237155 | -1.19976 | -15.2687% |
| MVV | ProShares Ultra MidCap400 2X Shares | | 69.74 | 70 | 0.273185 | 1.4105 | 3.63664% |
| SMDD | ProShares UltraPro Short MidCap400 -3x Shares | | 13.01 | 20 | -0.306513 | -1.99919 | -26.369% |
| 12Stocks.com: Charts, Trends, Fundamental Data and Performances of MidCap Stocks | |
|
We now take in-depth look at all MidCap stocks including charts, multi-period performances and overall trends (as measured by Smart Investing & Trading Score). One can sort MidCap stocks (click link to choose) by Daily, Weekly and by Year-to-Date performances. Also, one can sort by size of the company or by market capitalization. |
| Select Your Default Chart Type: | |||||
| |||||
| Click on stock symbol or name for detailed view. Click on to add stock symbol to your watchlist and to view watchlist. Quick View: Move mouse or cursor over "Daily" to quickly view daily technical stock chart and over "Weekly" to view weekly technical stock chart. | |||||

 | PH Parker-Hannifin Corp |
| Sector: Industrials | |
| SubSector: Specialty Industrial Machinery | |
| MarketCap: 96096 Millions | |
| Recent Price: 758.14 Smart Investing & Trading Score: 60 | |
| Day Percent Change: 0.386642% Day Change: 3.98 | |
| Week Change: 1.25274% Year-to-date Change: 21.1% | |
| PH Links: Profile News Message Board | |
| Charts:- Daily , Weekly | |
| Add PH to Watchlist: View: Get Complete PH Trend Analysis ➞ | |
 | TT Trane Technologies plc |
| Sector: Industrials | |
| SubSector: Building Products & Equipment | |
| MarketCap: 92083.5 Millions | |
| Recent Price: 424.44 Smart Investing & Trading Score: 0 | |
| Day Percent Change: -0.23% Day Change: -0.97 | |
| Week Change: 2.22% Year-to-date Change: 17.3% | |
| TT Links: Profile News Message Board | |
| Charts:- Daily , Weekly | |
| Add TT to Watchlist: View: Get Complete TT Trend Analysis ➞ | |
 | CTAS Cintas Corporation |
| Sector: Industrials | |
| SubSector: Specialty Business Services | |
| MarketCap: 82409 Millions | |
| Recent Price: 202.89 Smart Investing & Trading Score: 50 | |
| Day Percent Change: -0.368297% Day Change: -0.88 | |
| Week Change: 1.42472% Year-to-date Change: 11.8% | |
| CTAS Links: Profile News Message Board | |
| Charts:- Daily , Weekly | |
| Add CTAS to Watchlist: View: Get Complete CTAS Trend Analysis ➞ | |
 | RSG Republic Services, Inc |
| Sector: Industrials | |
| SubSector: Waste Management | |
| MarketCap: 71725.3 Millions | |
| Recent Price: 222.57 Smart Investing & Trading Score: 0 | |
| Day Percent Change: -2.07664% Day Change: -4.61 | |
| Week Change: -2.12401% Year-to-date Change: 11.8% | |
| RSG Links: Profile News Message Board | |
| Charts:- Daily , Weekly | |
| Add RSG to Watchlist: View: Get Complete RSG Trend Analysis ➞ | |
 | TDG Transdigm Group Incorporated |
| Sector: Industrials | |
| SubSector: Aerospace & Defense | |
| MarketCap: 71623.5 Millions | |
| Recent Price: 1283.81 Smart Investing & Trading Score: 40 | |
| Day Percent Change: -1.30612% Day Change: -13.54 | |
| Week Change: -1.24538% Year-to-date Change: 2.4% | |
| TDG Links: Profile News Message Board | |
| Charts:- Daily , Weekly | |
| Add TDG to Watchlist: View: Get Complete TDG Trend Analysis ➞ | |
 | URI United Rentals, Inc |
| Sector: Industrials | |
| SubSector: Rental & Leasing Services | |
| MarketCap: 62747.5 Millions | |
| Recent Price: 978.22 Smart Investing & Trading Score: 90 | |
| Day Percent Change: 1.58892% Day Change: 6.81 | |
| Week Change: 4.53525% Year-to-date Change: 42.5% | |
| URI Links: Profile News Message Board | |
| Charts:- Daily , Weekly | |
| Add URI to Watchlist: View: Get Complete URI Trend Analysis ➞ | |
 | AXON Axon Enterprise Inc |
| Sector: Industrials | |
| SubSector: Aerospace & Defense | |
| MarketCap: 57183.4 Millions | |
| Recent Price: 720.20 Smart Investing & Trading Score: 40 | |
| Day Percent Change: 1.24554% Day Change: 8.69 | |
| Week Change: 3.17756% Year-to-date Change: 20.7% | |
| AXON Links: Profile News Message Board | |
| Charts:- Daily , Weekly | |
| Add AXON to Watchlist: View: Get Complete AXON Trend Analysis ➞ | |
 | CARR Carrier Global Corp |
| Sector: Industrials | |
| SubSector: Building Products & Equipment | |
| MarketCap: 55750.5 Millions | |
| Recent Price: 58.90 Smart Investing & Trading Score: 20 | |
| Day Percent Change: -0.94181% Day Change: -0.43 | |
| Week Change: -0.152568% Year-to-date Change: -13.3% | |
| CARR Links: Profile News Message Board | |
| Charts:- Daily , Weekly | |
| Add CARR to Watchlist: View: Get Complete CARR Trend Analysis ➞ | |
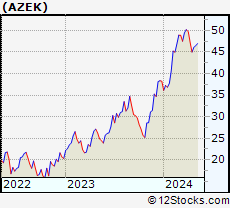 | AZEK The AZEK Company Inc. |
| Sector: Industrials | |
| SubSector: Building Products & Equipment | |
| MarketCap: 55127 Millions | |
| Recent Price: 54.35 Smart Investing & Trading Score: 70 | |
| Day Percent Change: -0.929639% Day Change: -9999 | |
| Week Change: 6.17308% Year-to-date Change: 15.4% | |
| AZEK Links: Profile News Message Board | |
| Charts:- Daily , Weekly | |
| Add AZEK to Watchlist: View: Get Complete AZEK Trend Analysis ➞ | |
 | CMI Cummins Inc |
| Sector: Industrials | |
| SubSector: Specialty Industrial Machinery | |
| MarketCap: 55093.7 Millions | |
| Recent Price: 432.59 Smart Investing & Trading Score: 90 | |
| Day Percent Change: 1.86978% Day Change: 7.58 | |
| Week Change: 3.49538% Year-to-date Change: 25.7% | |
| CMI Links: Profile News Message Board | |
| Charts:- Daily , Weekly | |
| Add CMI to Watchlist: View: Get Complete CMI Trend Analysis ➞ | |
 | FAST Fastenal Co |
| Sector: Industrials | |
| SubSector: Industrial Distribution | |
| MarketCap: 55075.1 Millions | |
| Recent Price: 48.17 Smart Investing & Trading Score: 40 | |
| Day Percent Change: 0.943001% Day Change: 0.27 | |
| Week Change: 1.3252% Year-to-date Change: 37.6% | |
| FAST Links: Profile News Message Board | |
| Charts:- Daily , Weekly | |
| Add FAST to Watchlist: View: Get Complete FAST Trend Analysis ➞ | |
 | PWR Quanta Services, Inc |
| Sector: Industrials | |
| SubSector: Engineering & Construction | |
| MarketCap: 54880.4 Millions | |
| Recent Price: 420.86 Smart Investing & Trading Score: 100 | |
| Day Percent Change: 0.0499227% Day Change: -1.21 | |
| Week Change: 4.46546% Year-to-date Change: 33.5% | |
| PWR Links: Profile News Message Board | |
| Charts:- Daily , Weekly | |
| Add PWR to Watchlist: View: Get Complete PWR Trend Analysis ➞ | |
 | PCAR Paccar Inc |
| Sector: Industrials | |
| SubSector: Farm & Heavy Construction Machinery | |
| MarketCap: 52011.5 Millions | |
| Recent Price: 99.09 Smart Investing & Trading Score: 50 | |
| Day Percent Change: 1.41234% Day Change: 1.4 | |
| Week Change: 2.27062% Year-to-date Change: -3.6% | |
| PCAR Links: Profile News Message Board | |
| Charts:- Daily , Weekly | |
| Add PCAR to Watchlist: View: Get Complete PCAR Trend Analysis ➞ | |
 | GWW W.W. Grainger Inc |
| Sector: Industrials | |
| SubSector: Industrial Distribution | |
| MarketCap: 47519.9 Millions | |
| Recent Price: 953.75 Smart Investing & Trading Score: 50 | |
| Day Percent Change: 1.03284% Day Change: 7.14 | |
| Week Change: 0.0860504% Year-to-date Change: -7.8% | |
| GWW Links: Profile News Message Board | |
| Charts:- Daily , Weekly | |
| Add GWW to Watchlist: View: Get Complete GWW Trend Analysis ➞ | |
 | CPRT Copart, Inc |
| Sector: Industrials | |
| SubSector: Specialty Business Services | |
| MarketCap: 46964.1 Millions | |
| Recent Price: 44.57 Smart Investing & Trading Score: 10 | |
| Day Percent Change: -1.15325% Day Change: -0.62 | |
| Week Change: -1.80657% Year-to-date Change: -20.9% | |
| CPRT Links: Profile News Message Board | |
| Charts:- Daily , Weekly | |
| Add CPRT to Watchlist: View: Get Complete CPRT Trend Analysis ➞ | |
 | AME Ametek Inc |
| Sector: Industrials | |
| SubSector: Specialty Industrial Machinery | |
| MarketCap: 43292.3 Millions | |
| Recent Price: 186.13 Smart Investing & Trading Score: 30 | |
| Day Percent Change: -0.69889% Day Change: -0.68 | |
| Week Change: -0.0214857% Year-to-date Change: 4.7% | |
| AME Links: Profile News Message Board | |
| Charts:- Daily , Weekly | |
| Add AME to Watchlist: View: Get Complete AME Trend Analysis ➞ | |
 | DAL Delta Air Lines, Inc |
| Sector: Industrials | |
| SubSector: Airlines | |
| MarketCap: 39947.4 Millions | |
| Recent Price: 57.08 Smart Investing & Trading Score: 40 | |
| Day Percent Change: 1.72875% Day Change: 1.11 | |
| Week Change: -1.09167% Year-to-date Change: -2.5% | |
| DAL Links: Profile News Message Board | |
| Charts:- Daily , Weekly | |
| Add DAL to Watchlist: View: Get Complete DAL Trend Analysis ➞ | |
 | HEI Heico Corp |
| Sector: Industrials | |
| SubSector: Aerospace & Defense | |
| MarketCap: 38941.5 Millions | |
| Recent Price: 317.81 Smart Investing & Trading Score: 20 | |
| Day Percent Change: -0.625371% Day Change: -1.11 | |
| Week Change: 0.350489% Year-to-date Change: 34.1% | |
| HEI Links: Profile News Message Board | |
| Charts:- Daily , Weekly | |
| Add HEI to Watchlist: View: Get Complete HEI Trend Analysis ➞ | |
 | ROK Rockwell Automation Inc |
| Sector: Industrials | |
| SubSector: Specialty Industrial Machinery | |
| MarketCap: 38200.7 Millions | |
| Recent Price: 348.69 Smart Investing & Trading Score: 70 | |
| Day Percent Change: -0.18035% Day Change: 0.31 | |
| Week Change: 1.81324% Year-to-date Change: 25.2% | |
| ROK Links: Profile News Message Board | |
| Charts:- Daily , Weekly | |
| Add ROK to Watchlist: View: Get Complete ROK Trend Analysis ➞ | |
 | VRSK Verisk Analytics Inc |
| Sector: Industrials | |
| SubSector: Consulting Services | |
| MarketCap: 37766.4 Millions | |
| Recent Price: 247.43 Smart Investing & Trading Score: 30 | |
| Day Percent Change: -0.849529% Day Change: -1.73 | |
| Week Change: 1.844% Year-to-date Change: -9.2% | |
| VRSK Links: Profile News Message Board | |
| Charts:- Daily , Weekly | |
| Add VRSK to Watchlist: View: Get Complete VRSK Trend Analysis ➞ | |
 | UAL United Airlines Holdings Inc |
| Sector: Industrials | |
| SubSector: Airlines | |
| MarketCap: 34506.6 Millions | |
| Recent Price: 94.83 Smart Investing & Trading Score: 20 | |
| Day Percent Change: 1.80354% Day Change: 1.8 | |
| Week Change: -6.47007% Year-to-date Change: -0.6% | |
| UAL Links: Profile News Message Board | |
| Charts:- Daily , Weekly | |
| Add UAL to Watchlist: View: Get Complete UAL Trend Analysis ➞ | |
 | XYL Xylem Inc |
| Sector: Industrials | |
| SubSector: Specialty Industrial Machinery | |
| MarketCap: 34213.7 Millions | |
| Recent Price: 149.01 Smart Investing & Trading Score: 100 | |
| Day Percent Change: 0.764133% Day Change: 0.77 | |
| Week Change: 5.3372% Year-to-date Change: 29.3% | |
| XYL Links: Profile News Message Board | |
| Charts:- Daily , Weekly | |
| Add XYL to Watchlist: View: Get Complete XYL Trend Analysis ➞ | |
 | OTIS Otis Worldwide Corp |
| Sector: Industrials | |
| SubSector: Specialty Industrial Machinery | |
| MarketCap: 34145.3 Millions | |
| Recent Price: 92.24 Smart Investing & Trading Score: 100 | |
| Day Percent Change: -0.129926% Day Change: 0.22 | |
| Week Change: 3.95582% Year-to-date Change: 0.8% | |
| OTIS Links: Profile News Message Board | |
| Charts:- Daily , Weekly | |
| Add OTIS to Watchlist: View: Get Complete OTIS Trend Analysis ➞ | |
 | WAB Westinghouse Air Brake Technologies Corp |
| Sector: Industrials | |
| SubSector: Railroads | |
| MarketCap: 33024.7 Millions | |
| Recent Price: 197.87 Smart Investing & Trading Score: 80 | |
| Day Percent Change: -0.347502% Day Change: -0.38 | |
| Week Change: 2.89117% Year-to-date Change: 5.0% | |
| WAB Links: Profile News Message Board | |
| Charts:- Daily , Weekly | |
| Add WAB to Watchlist: View: Get Complete WAB Trend Analysis ➞ | |
 | IR Ingersoll-Rand Inc |
| Sector: Industrials | |
| SubSector: Specialty Industrial Machinery | |
| MarketCap: 32173.8 Millions | |
| Recent Price: 84.18 Smart Investing & Trading Score: 90 | |
| Day Percent Change: 0.814371% Day Change: 0.58 | |
| Week Change: 4.04153% Year-to-date Change: -7.0% | |
| IR Links: Profile News Message Board | |
| Charts:- Daily , Weekly | |
| Add IR to Watchlist: View: Get Complete IR Trend Analysis ➞ | |
| For tabular summary view of above stock list: Summary View ➞ 0 - 25 , 25 - 50 , 50 - 75 , 75 - 100 , 100 - 125 | ||
| Click To Change The Sort Order: By Market Cap or Company Size Performance: Year-to-date, Week and Day | |
| Select Chart Type: | ||
|
Best Stocks Today 12Stocks.com |
© 2025 12Stocks.com Terms & Conditions Privacy Contact Us
All Information Provided Only For Education And Not To Be Used For Investing or Trading. See Terms & Conditions


One More Thing ... Get Best Stocks Delivered Daily!
Never Ever Miss A Move With Our Top Ten Stocks Lists
Find Best Stocks In Any Market - Bull or Bear Market
Take A Peek At Our Top Ten Stocks Lists: Daily, Weekly, Year-to-Date & Top Trends
Find Best Stocks In Any Market - Bull or Bear Market
Take A Peek At Our Top Ten Stocks Lists: Daily, Weekly, Year-to-Date & Top Trends
Midcap Stocks With Best Up Trends [0-bearish to 100-bullish]: Fair Isaac[100], Sarepta [100], Ginkgo Bioworks[100], Acadia [100], Robinhood Markets[100], Sunrun [100], Confluent [100], MKS [100], Ionis [100], Bio-Techne Corp[100], DuPont de[100]
Best Midcap Stocks Year-to-Date:
Lucid [695.38%], MP Materials[332.947%], Wolfspeed [307.01%], Robinhood Markets[269.422%], SSR Mining[227.298%], Viasat [224.029%], Western Digital[181.204%], QuantumScape Corp[158.123%], Palantir Technologies[148.77%], Roblox [126.886%], Celsius [116.544%] Best Midcap Stocks This Week:
Wolfspeed [1961.98%], Splunk [38.7643%], Ginkgo Bioworks[38.5082%], Stericycle [31.4276%], Sarepta [22.3987%], Bio-Techne Corp[21.2222%], Electronic Arts[20.1076%], QuidelOrtho [19.7078%], Western Digital[19.6645%], Sunrun [19.4081%], Certara [19.0227%] Best Midcap Stocks Daily:
Fair Isaac[17.979%], Sarepta [15.6832%], Ginkgo Bioworks[8.86162%], Teladoc Health[8.71795%], Acadia [8.51324%], Agilon Health[8%], Coinbase Global[7.48187%], Celanese Corp[6.98937%], Bentley [6.91632%], AMC Entertainment[6.77966%], Kinsale Capital[6.00493%]