
 Login Sign Up


| |||||
 |  | ||||

| 12Stocks.com Market Intelligence |
Best MidCap Stocks
|
| In a hurry? Mid Cap Stocks Lists: Performance Trends Table, Stock Charts
Sort midcap stocks: Daily, Weekly, Year-to-Date, Market Cap & Trends. Filter midcap stocks list by sector: Show all, Tech, Finance, Energy, Staples, Retail, Industrial, Materials, Utilities and HealthCare Filter midcap stocks list by size:All MidCap Large Mid-Range Small |
| 12Stocks.com Mid Cap Stocks Performances & Trends Daily | |||||||||
|
|  The overall Smart Investing & Trading Score is 70 (0-bearish to 100-bullish) which puts Mid Cap index in short term neutral to bullish trend. The Smart Investing & Trading Score from previous trading session is 60 and an improvement of trend continues.
| ||||||||
Here are the Smart Investing & Trading Scores of the most requested mid cap stocks at 12Stocks.com (click stock name for detailed review):
|


| 12Stocks.com: Top Performing Mid Cap Index Stocks | ||||||||||||||||||||||||||||||||||||||||||||||||
 The top performing Mid Cap Index stocks year to date are
Now, more recently, over last week, the top performing Mid Cap Index stocks on the move are


|
||||||||||||||||||||||||||||||||||||||||||||||||
| 12Stocks.com: Investing in Midcap Index with Stocks | |
|
The following table helps investors and traders sort through current performance and trends (as measured by Smart Investing & Trading Score) of various
stocks in the Midcap Index. Quick View: Move mouse or cursor over stock symbol (ticker) to view short-term technical chart and over stock name to view long term chart. Click on  to add stock symbol to your watchlist and to add stock symbol to your watchlist and  to view watchlist. Click on any ticker or stock name for detailed market intelligence report for that stock. to view watchlist. Click on any ticker or stock name for detailed market intelligence report for that stock. |
12Stocks.com Performance of Stocks in Midcap Index
| Ticker | Stock Name | Watchlist | Category | Recent Price | Smart Investing & Trading Score | Change % | YTD Change% |
| ALNY | Alnylam |   | Health Care | 460.99 | 60 | 0.07% | 97.32% |
| COR | Cencora | | Health Care | 308.57 | 60 | -1.03% | 37.88% |
| IDXX | Idexx | | Health Care | 633.84 | 40 | 2.21% | 55.03% |
| VEEV | Veeva | | Health Care | 300.79 | 90 | 2.57% | 42.84% |
| RMD | Resmed | | Health Care | 276.64 | 60 | 2.14% | 21.61% |
| A | Agilent Technologies | | Health Care | 138.70 | 100 | 0.09% | 4.39% |
| CAH | Cardinal Health | | Health Care | 158.46 | 90 | 0.34% | 35.17% |
| IQV | IQVIA | | Health Care | 204.34 | 100 | 0.27% | 4.73% |
| DXCM | Dexcom | | Health Care | 66.44 | 10 | 0.54% | -15.36% |
| MTD | Mettler-Toledo | | Health Care | 1300.54 | 100 | 0.83% | 6.53% |
| PODD | Insulet | | Health Care | 312.27 | 50 | 2.06% | 21.58% |
| STE | Steris | | Health Care | 242.40 | 20 | 0.46% | 20.32% |
| LH | Labcorp | | Health Care | 279.44 | 40 | 0.14% | 23.17% |
| NTRA | Natera | | Health Care | 160.14 | 30 | -0.91% | -0.29% |
| RPRX | Royalty Pharma | | Health Care | 36.50 | 60 | 0.50% | 43.42% |
| ZBH | Zimmer Biomet | | Health Care | 99.17 | 70 | 0.28% | -4.61% |
| BIIB | Biogen | | Health Care | 155.25 | 100 | 0.67% | 3.50% |
| DGX | Quest Diagnostics | | Health Care | 180.96 | 20 | -0.61% | 21.60% |
| WAT | Waters Corp | | Health Care | 321.92 | 100 | 0.66% | -12.58% |
| UTHR | United | | Health Care | 443.70 | 100 | 1.26% | 23.17% |
| WST | West Pharmaceutical | | Health Care | 273.16 | 100 | 0.64% | -16.61% |
| THC | Tenet | | Health Care | 203.38 | 90 | 1.01% | 62.42% |
| INCY | yte Corp | | Health Care | 86.30 | 90 | -0.46% | 24.12% |
| ILMN | Illumina | | Health Care | 99.30 | 60 | -2.89% | -24.16% |
| HOLX | Hologic | | Health Care | 67.90 | 70 | 1.28% | -5.35% |
| For chart view version of above stock list: Chart View ➞ 0 - 25 , 25 - 50 , 50 - 75 , 75 - 100 | ||
 | Click To Change The Sort Order: By Market Cap or Company Size Performance: Year-to-date, Week and Day |  |
|
Get the most comprehensive stock market coverage daily at 12Stocks.com ➞ Best Stocks Today ➞ Best Stocks Weekly ➞ Best Stocks Year-to-Date ➞ Best Stocks Trends ➞  Best Stocks Today 12Stocks.com Best Nasdaq Stocks ➞ Best S&P 500 Stocks ➞ Best Tech Stocks ➞ Best Biotech Stocks ➞ |
| Detailed Overview of Midcap Stocks |
| Midcap Technical Overview, Leaders & Laggards, Top Midcap ETF Funds & Detailed Midcap Stocks List, Charts, Trends & More |
| Midcap: Technical Analysis, Trends & YTD Performance | |
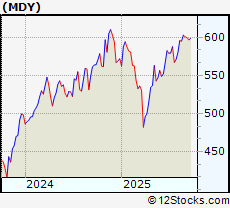
| MidCap segment as represented by
MDY, an exchange-traded fund [ETF], holds basket of about four hundred midcap stocks from across all major sectors of the US stock market. The midcap index (contains stocks like Green Mountain Coffee Roasters and Tractor Supply Company) is up by 5.96788% and is currently underperforming the overall market by -8.79002% year-to-date. Below is a quick view of technical charts and trends: | |
 MDY Weekly Chart |
|
| Long Term Trend: Very Good | |
| Medium Term Trend: Not Good | |
 MDY Daily Chart |
|
| Short Term Trend: Very Good | |
| Overall Trend Score: 70 | |
| YTD Performance: 5.96788% | |
| **Trend Scores & Views Are Only For Educational Purposes And Not For Investing | |
| 12Stocks.com: Investing in Midcap Index using Exchange Traded Funds | |
|
The following table shows list of key exchange traded funds (ETF) that
help investors track Midcap index. The following list also includes leveraged ETF funds that track twice or thrice the daily returns of Midcap indices. Short or inverse ETF funds move in the opposite direction to the index they track and are useful during market pullbacks or during bear markets. Quick View: Move mouse or cursor over ETF symbol (ticker) to view short-term technical chart and over ETF name to view long term chart. Click on ticker or stock name for detailed view. Click on to add stock symbol to your watchlist and to view watchlist. |
12Stocks.com List of ETFs that track Midcap Index
| Ticker | ETF Name | Watchlist | Recent Price | Smart Investing & Trading Score | Change % | Week % | Year-to-date % |
| IJH | iShares Core S&P Mid-Cap ETF | | 65.57 | 70 | 0.122156 | 0.814883 | 6.12728% |
| IWR | iShares Russell Mid-Cap ETF | | 96.94 | 80 | 0.435143 | 1.095 | 10.4451% |
| MDY | S&P MidCap 400 ETF | | 598.78 | 70 | 0.135458 | 0.799623 | 5.96788% |
| IWP | iShares Russell Mid-Cap Growth ETF | | 143.46 | 60 | 1.06375 | 0.709021 | 12.7484% |
| IWS | iShares Russell Mid-Cap Value ETF | | 140.24 | 90 | 0.293213 | 1.2417 | 9.61902% |
| XMLV | Invesco S&P MidCap Low Volatility ETF | | 63.15 | 40 | -0.468716 | 0.529449 | 5.75473% |
| IJK | iShares S&P Mid-Cap 400 Growth ETF | | 96.25 | 70 | 0.176936 | 0.669386 | 6.02707% |
| IJJ | iShares S&P Mid-Cap 400 Value ETF | | 130.47 | 70 | 0.138153 | 0.850274 | 5.90097% |
| MYY | ProShares Short Midcap400 -1x Shares | | 17.72 | 10 | -0.221847 | -0.638093 | -5.50223% |
| UMDD | ProShares UltraPro MidCap400 3x Shares | | 25.88 | 70 | 0.622084 | 2.09476 | -1.51345% |
| MZZ | ProShares UltraShort MidCap400 -2x Shares | | 8.16 | 10 | -0.237155 | -1.19976 | -15.2687% |
| MVV | ProShares Ultra MidCap400 2X Shares | | 69.74 | 70 | 0.273185 | 1.4105 | 3.63664% |
| SMDD | ProShares UltraPro Short MidCap400 -3x Shares | | 13.01 | 20 | -0.306513 | -1.99919 | -26.369% |
| 12Stocks.com: Charts, Trends, Fundamental Data and Performances of MidCap Stocks | |
|
We now take in-depth look at all MidCap stocks including charts, multi-period performances and overall trends (as measured by Smart Investing & Trading Score). One can sort MidCap stocks (click link to choose) by Daily, Weekly and by Year-to-Date performances. Also, one can sort by size of the company or by market capitalization. |
| Select Your Default Chart Type: | |||||
| |||||
| Click on stock symbol or name for detailed view. Click on to add stock symbol to your watchlist and to view watchlist. Quick View: Move mouse or cursor over "Daily" to quickly view daily technical stock chart and over "Weekly" to view weekly technical stock chart. | |||||

 | ALNY Alnylam Pharmaceuticals Inc |
| Sector: Health Care | |
| SubSector: Biotechnology | |
| MarketCap: 59247.7 Millions | |
| Recent Price: 460.99 Smart Investing & Trading Score: 60 | |
| Day Percent Change: 0.0738088% Day Change: -3.48 | |
| Week Change: 0.571591% Year-to-date Change: 97.3% | |
| ALNY Links: Profile News Message Board | |
| Charts:- Daily , Weekly | |
| Add ALNY to Watchlist: View: Get Complete ALNY Trend Analysis ➞ | |
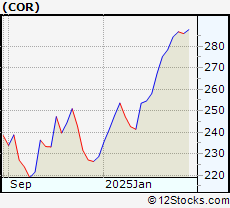 | COR Cencora Inc |
| Sector: Health Care | |
| SubSector: Medical Distribution | |
| MarketCap: 56709.3 Millions | |
| Recent Price: 308.57 Smart Investing & Trading Score: 60 | |
| Day Percent Change: -1.0264% Day Change: -3.06 | |
| Week Change: 0.0681022% Year-to-date Change: 37.9% | |
| COR Links: Profile News Message Board | |
| Charts:- Daily , Weekly | |
| Add COR to Watchlist: View: Get Complete COR Trend Analysis ➞ | |
 | IDXX Idexx Laboratories, Inc |
| Sector: Health Care | |
| SubSector: Diagnostics & Research | |
| MarketCap: 51442.2 Millions | |
| Recent Price: 633.84 Smart Investing & Trading Score: 40 | |
| Day Percent Change: 2.21412% Day Change: 10.88 | |
| Week Change: 1.06351% Year-to-date Change: 55.0% | |
| IDXX Links: Profile News Message Board | |
| Charts:- Daily , Weekly | |
| Add IDXX to Watchlist: View: Get Complete IDXX Trend Analysis ➞ | |
 | VEEV Veeva Systems Inc |
| Sector: Health Care | |
| SubSector: Health Information Services | |
| MarketCap: 44735.4 Millions | |
| Recent Price: 300.79 Smart Investing & Trading Score: 90 | |
| Day Percent Change: 2.56769% Day Change: 4.53 | |
| Week Change: 8.2212% Year-to-date Change: 42.8% | |
| VEEV Links: Profile News Message Board | |
| Charts:- Daily , Weekly | |
| Add VEEV to Watchlist: View: Get Complete VEEV Trend Analysis ➞ | |
 | RMD Resmed Inc |
| Sector: Health Care | |
| SubSector: Medical Instruments & Supplies | |
| MarketCap: 40564.2 Millions | |
| Recent Price: 276.64 Smart Investing & Trading Score: 60 | |
| Day Percent Change: 2.13771% Day Change: 4.54 | |
| Week Change: 0.893541% Year-to-date Change: 21.6% | |
| RMD Links: Profile News Message Board | |
| Charts:- Daily , Weekly | |
| Add RMD to Watchlist: View: Get Complete RMD Trend Analysis ➞ | |
 | A Agilent Technologies Inc |
| Sector: Health Care | |
| SubSector: Diagnostics & Research | |
| MarketCap: 36500.7 Millions | |
| Recent Price: 138.70 Smart Investing & Trading Score: 100 | |
| Day Percent Change: 0.0865926% Day Change: 0.52 | |
| Week Change: 11.5131% Year-to-date Change: 4.4% | |
| A Links: Profile News Message Board | |
| Charts:- Daily , Weekly | |
| Add A to Watchlist: View: Get Complete A Trend Analysis ➞ | |
 | CAH Cardinal Health, Inc |
| Sector: Health Care | |
| SubSector: Medical Distribution | |
| MarketCap: 35714 Millions | |
| Recent Price: 158.46 Smart Investing & Trading Score: 90 | |
| Day Percent Change: 0.335592% Day Change: 0.17 | |
| Week Change: 2.51003% Year-to-date Change: 35.2% | |
| CAH Links: Profile News Message Board | |
| Charts:- Daily , Weekly | |
| Add CAH to Watchlist: View: Get Complete CAH Trend Analysis ➞ | |
 | IQV IQVIA Holdings Inc |
| Sector: Health Care | |
| SubSector: Diagnostics & Research | |
| MarketCap: 31905.6 Millions | |
| Recent Price: 204.34 Smart Investing & Trading Score: 100 | |
| Day Percent Change: 0.269886% Day Change: 0.17 | |
| Week Change: 12.7455% Year-to-date Change: 4.7% | |
| IQV Links: Profile News Message Board | |
| Charts:- Daily , Weekly | |
| Add IQV to Watchlist: View: Get Complete IQV Trend Analysis ➞ | |
 | DXCM Dexcom Inc |
| Sector: Health Care | |
| SubSector: Medical Devices | |
| MarketCap: 31572.4 Millions | |
| Recent Price: 66.44 Smart Investing & Trading Score: 10 | |
| Day Percent Change: 0.544794% Day Change: -0.51 | |
| Week Change: -1.57037% Year-to-date Change: -15.4% | |
| DXCM Links: Profile News Message Board | |
| Charts:- Daily , Weekly | |
| Add DXCM to Watchlist: View: Get Complete DXCM Trend Analysis ➞ | |
 | MTD Mettler-Toledo International, Inc |
| Sector: Health Care | |
| SubSector: Diagnostics & Research | |
| MarketCap: 26896.4 Millions | |
| Recent Price: 1300.54 Smart Investing & Trading Score: 100 | |
| Day Percent Change: 0.831124% Day Change: 3.62 | |
| Week Change: 4.68976% Year-to-date Change: 6.5% | |
| MTD Links: Profile News Message Board | |
| Charts:- Daily , Weekly | |
| Add MTD to Watchlist: View: Get Complete MTD Trend Analysis ➞ | |
 | PODD Insulet Corporation |
| Sector: Health Care | |
| SubSector: Medical Devices | |
| MarketCap: 24526.9 Millions | |
| Recent Price: 312.27 Smart Investing & Trading Score: 50 | |
| Day Percent Change: 2.05569% Day Change: 5.16 | |
| Week Change: -4.49583% Year-to-date Change: 21.6% | |
| PODD Links: Profile News Message Board | |
| Charts:- Daily , Weekly | |
| Add PODD to Watchlist: View: Get Complete PODD Trend Analysis ➞ | |
 | STE Steris Plc |
| Sector: Health Care | |
| SubSector: Medical Devices | |
| MarketCap: 24159.8 Millions | |
| Recent Price: 242.40 Smart Investing & Trading Score: 20 | |
| Day Percent Change: 0.455864% Day Change: 0.92 | |
| Week Change: -1.45941% Year-to-date Change: 20.3% | |
| STE Links: Profile News Message Board | |
| Charts:- Daily , Weekly | |
| Add STE to Watchlist: View: Get Complete STE Trend Analysis ➞ | |
 | LH Labcorp Holdings Inc |
| Sector: Health Care | |
| SubSector: Diagnostics & Research | |
| MarketCap: 23157.5 Millions | |
| Recent Price: 279.44 Smart Investing & Trading Score: 40 | |
| Day Percent Change: 0.136171% Day Change: 0.64 | |
| Week Change: 0.0322176% Year-to-date Change: 23.2% | |
| LH Links: Profile News Message Board | |
| Charts:- Daily , Weekly | |
| Add LH to Watchlist: View: Get Complete LH Trend Analysis ➞ | |
 | NTRA Natera Inc |
| Sector: Health Care | |
| SubSector: Diagnostics & Research | |
| MarketCap: 23060.4 Millions | |
| Recent Price: 160.14 Smart Investing & Trading Score: 30 | |
| Day Percent Change: -0.909597% Day Change: -1.17 | |
| Week Change: -2.30004% Year-to-date Change: -0.3% | |
| NTRA Links: Profile News Message Board | |
| Charts:- Daily , Weekly | |
| Add NTRA to Watchlist: View: Get Complete NTRA Trend Analysis ➞ | |
 | RPRX Royalty Pharma plc |
| Sector: Health Care | |
| SubSector: Biotechnology | |
| MarketCap: 21036.9 Millions | |
| Recent Price: 36.50 Smart Investing & Trading Score: 60 | |
| Day Percent Change: 0.495595% Day Change: 0.21 | |
| Week Change: 2.04082% Year-to-date Change: 43.4% | |
| RPRX Links: Profile News Message Board | |
| Charts:- Daily , Weekly | |
| Add RPRX to Watchlist: View: Get Complete RPRX Trend Analysis ➞ | |
 | ZBH Zimmer Biomet Holdings Inc |
| Sector: Health Care | |
| SubSector: Medical Devices | |
| MarketCap: 20944.7 Millions | |
| Recent Price: 99.17 Smart Investing & Trading Score: 70 | |
| Day Percent Change: 0.283143% Day Change: -0.04 | |
| Week Change: 0.191958% Year-to-date Change: -4.6% | |
| ZBH Links: Profile News Message Board | |
| Charts:- Daily , Weekly | |
| Add ZBH to Watchlist: View: Get Complete ZBH Trend Analysis ➞ | |
 | BIIB Biogen Inc |
| Sector: Health Care | |
| SubSector: Drug Manufacturers - General | |
| MarketCap: 20624.3 Millions | |
| Recent Price: 155.25 Smart Investing & Trading Score: 100 | |
| Day Percent Change: 0.667877% Day Change: 0.1 | |
| Week Change: 12.7697% Year-to-date Change: 3.5% | |
| BIIB Links: Profile News Message Board | |
| Charts:- Daily , Weekly | |
| Add BIIB to Watchlist: View: Get Complete BIIB Trend Analysis ➞ | |
 | DGX Quest Diagnostics, Inc |
| Sector: Health Care | |
| SubSector: Diagnostics & Research | |
| MarketCap: 20518.5 Millions | |
| Recent Price: 180.96 Smart Investing & Trading Score: 20 | |
| Day Percent Change: -0.609656% Day Change: -0.67 | |
| Week Change: -3.13671% Year-to-date Change: 21.6% | |
| DGX Links: Profile News Message Board | |
| Charts:- Daily , Weekly | |
| Add DGX to Watchlist: View: Get Complete DGX Trend Analysis ➞ | |
 | WAT Waters Corp |
| Sector: Health Care | |
| SubSector: Diagnostics & Research | |
| MarketCap: 18233.4 Millions | |
| Recent Price: 321.92 Smart Investing & Trading Score: 100 | |
| Day Percent Change: 0.659767% Day Change: 2.48 | |
| Week Change: 10.0017% Year-to-date Change: -12.6% | |
| WAT Links: Profile News Message Board | |
| Charts:- Daily , Weekly | |
| Add WAT to Watchlist: View: Get Complete WAT Trend Analysis ➞ | |
 | UTHR United Therapeutics Corp |
| Sector: Health Care | |
| SubSector: Drug Manufacturers - Specialty & Generic | |
| MarketCap: 18114 Millions | |
| Recent Price: 443.70 Smart Investing & Trading Score: 100 | |
| Day Percent Change: 1.25976% Day Change: 3.43 | |
| Week Change: 1.12821% Year-to-date Change: 23.2% | |
| UTHR Links: Profile News Message Board | |
| Charts:- Daily , Weekly | |
| Add UTHR to Watchlist: View: Get Complete UTHR Trend Analysis ➞ | |
 | WST West Pharmaceutical Services, Inc |
| Sector: Health Care | |
| SubSector: Medical Instruments & Supplies | |
| MarketCap: 18029.3 Millions | |
| Recent Price: 273.16 Smart Investing & Trading Score: 100 | |
| Day Percent Change: 0.641073% Day Change: 2.62 | |
| Week Change: 5.08579% Year-to-date Change: -16.6% | |
| WST Links: Profile News Message Board | |
| Charts:- Daily , Weekly | |
| Add WST to Watchlist: View: Get Complete WST Trend Analysis ➞ | |
 | THC Tenet Healthcare Corp |
| Sector: Health Care | |
| SubSector: Medical Care Facilities | |
| MarketCap: 17332.7 Millions | |
| Recent Price: 203.38 Smart Investing & Trading Score: 90 | |
| Day Percent Change: 1.01321% Day Change: 1.15 | |
| Week Change: 3.43284% Year-to-date Change: 62.4% | |
| THC Links: Profile News Message Board | |
| Charts:- Daily , Weekly | |
| Add THC to Watchlist: View: Get Complete THC Trend Analysis ➞ | |
 | INCY Incyte Corp |
| Sector: Health Care | |
| SubSector: Biotechnology | |
| MarketCap: 16918.7 Millions | |
| Recent Price: 86.30 Smart Investing & Trading Score: 90 | |
| Day Percent Change: -0.461361% Day Change: -0.12 | |
| Week Change: 2.54278% Year-to-date Change: 24.1% | |
| INCY Links: Profile News Message Board | |
| Charts:- Daily , Weekly | |
| Add INCY to Watchlist: View: Get Complete INCY Trend Analysis ➞ | |
 | ILMN Illumina Inc |
| Sector: Health Care | |
| SubSector: Diagnostics & Research | |
| MarketCap: 15205.5 Millions | |
| Recent Price: 99.30 Smart Investing & Trading Score: 60 | |
| Day Percent Change: -2.89458% Day Change: -3.41 | |
| Week Change: 5.17954% Year-to-date Change: -24.2% | |
| ILMN Links: Profile News Message Board | |
| Charts:- Daily , Weekly | |
| Add ILMN to Watchlist: View: Get Complete ILMN Trend Analysis ➞ | |
 | HOLX Hologic, Inc |
| Sector: Health Care | |
| SubSector: Medical Instruments & Supplies | |
| MarketCap: 14848.7 Millions | |
| Recent Price: 67.90 Smart Investing & Trading Score: 70 | |
| Day Percent Change: 1.28282% Day Change: 0.42 | |
| Week Change: 2.25904% Year-to-date Change: -5.4% | |
| HOLX Links: Profile News Message Board | |
| Charts:- Daily , Weekly | |
| Add HOLX to Watchlist: View: Get Complete HOLX Trend Analysis ➞ | |
| For tabular summary view of above stock list: Summary View ➞ 0 - 25 , 25 - 50 , 50 - 75 , 75 - 100 | ||
| Click To Change The Sort Order: By Market Cap or Company Size Performance: Year-to-date, Week and Day | |
| Select Chart Type: | ||
|
Best Stocks Today 12Stocks.com |
© 2025 12Stocks.com Terms & Conditions Privacy Contact Us
All Information Provided Only For Education And Not To Be Used For Investing or Trading. See Terms & Conditions


One More Thing ... Get Best Stocks Delivered Daily!
Never Ever Miss A Move With Our Top Ten Stocks Lists
Find Best Stocks In Any Market - Bull or Bear Market
Take A Peek At Our Top Ten Stocks Lists: Daily, Weekly, Year-to-Date & Top Trends
Find Best Stocks In Any Market - Bull or Bear Market
Take A Peek At Our Top Ten Stocks Lists: Daily, Weekly, Year-to-Date & Top Trends
Midcap Stocks With Best Up Trends [0-bearish to 100-bullish]: Fair Isaac[100], Sarepta [100], Ginkgo Bioworks[100], Acadia [100], Robinhood Markets[100], Sunrun [100], Confluent [100], MKS [100], Ionis [100], Bio-Techne Corp[100], DuPont de[100]
Best Midcap Stocks Year-to-Date:
Lucid [695.38%], MP Materials[332.947%], Wolfspeed [307.01%], Robinhood Markets[269.422%], SSR Mining[227.298%], Viasat [224.029%], Western Digital[181.204%], QuantumScape Corp[158.123%], Palantir Technologies[148.77%], Roblox [126.886%], Celsius [116.544%] Best Midcap Stocks This Week:
Wolfspeed [1961.98%], Splunk [38.7643%], Ginkgo Bioworks[38.5082%], Stericycle [31.4276%], Sarepta [22.3987%], Bio-Techne Corp[21.2222%], Electronic Arts[20.1076%], QuidelOrtho [19.7078%], Western Digital[19.6645%], Sunrun [19.4081%], Certara [19.0227%] Best Midcap Stocks Daily:
Fair Isaac[17.979%], Sarepta [15.6832%], Ginkgo Bioworks[8.86162%], Teladoc Health[8.71795%], Acadia [8.51324%], Agilon Health[8%], Coinbase Global[7.48187%], Celanese Corp[6.98937%], Bentley [6.91632%], AMC Entertainment[6.77966%], Kinsale Capital[6.00493%]