
 Login Sign Up


| |||||
 |  | ||||

| 12Stocks.com Market Intelligence |
Best Industrial Stocks
| In a hurry? Industrial Stocks Lists: Performance Trends Table, Stock Charts
Sort Industrial stocks: Daily, Weekly, Year-to-Date, Market Cap & Trends. Filter Industrial stocks list by size:All Industrial Large Mid-Range Small |
| 12Stocks.com Industrial Stocks Performances & Trends Daily | |||||||||
|
|  The overall Smart Investing & Trading Score is 85 (0-bearish to 100-bullish) which puts Industrial sector in short term bullish trend. The Smart Investing & Trading Score from previous trading session is 73 and hence an improvement of trend.
| ||||||||
Here are the Smart Investing & Trading Scores of the most requested Industrial stocks at 12Stocks.com (click stock name for detailed review):
|


| 12Stocks.com: Investing in Industrial sector with Stocks | |
|
The following table helps investors and traders sort through current performance and trends (as measured by Smart Investing & Trading Score) of various
stocks in the Industrial sector. Quick View: Move mouse or cursor over stock symbol (ticker) to view short-term Technical chart and over stock name to view long term chart. Click on  to add stock symbol to your watchlist and to add stock symbol to your watchlist and  to view watchlist. Click on any ticker or stock name for detailed market intelligence report for that stock. to view watchlist. Click on any ticker or stock name for detailed market intelligence report for that stock. |
12Stocks.com Performance of Stocks in Industrial Sector
| Ticker | Stock Name | Watchlist | Category | Recent Price | Smart Investing & Trading Score | Change % | YTD Change% |
| USLM | United States |   | Building Materials | 347.32 | 100 | 2.10% | 50.78% |
| LEV | Lion Electric | | Farm & Heavy Construction Machinery | 1.05 | 54 | 4.46% | -40.56% |
| LOMA | Loma Negra | | Building Materials | 7.63 | 100 | 2.83% | 7.62% |
| LXFR | Luxfer | | Machinery | 11.75 | 100 | 0.43% | 31.43% |
| MYRG | MYR | | Contractors | 146.69 | 0 | 1.92% | 1.42% |
| EVTL | Vertical Aerospace | | Aerospace & Defense | 0.78 | 68 | 0.91% | 13.85% |
| SWIM | Latham | | Building Products & Equipment | 2.87 | 22 | 5.13% | 8.71% |
| SLND | Southland | | Engineering & Construction | 4.31 | 27 | -1.82% | -16.47% |
| TPC | Tutor Perini | | Heavy Construction | 18.51 | 100 | 2.89% | 103.41% |
| IESC | IES | | Contractors | 170.47 | 100 | 5.63% | 115.19% |
| REX | REX American | | Conglomerates | 57.60 | 78 | 0.82% | 21.78% |
| MTW | Manitowoc | | Machinery | 12.61 | 42 | 1.45% | -24.45% |
| AVHI | AV Homes | | Residential | 11.07 | 57 | 0.00% | 1.65% |
| FIP | FTAI Infrastructure | | Industrials | 7.39 | 71 | 1.44% | 90.10% |
| HOVNP | Hovnanian Enterprises | | Residential | 18.21 | 67 | 0.00% | -1.03% |
| BOOM | DMC Global | | Fabrication | 13.32 | 0 | -2.35% | -29.22% |
| TGI | Triumph | | Aerospace/Defense | 14.43 | 90 | 4.38% | -13.00% |
| CYD | China Yuchai | | Machinery | 8.24 | 22 | 0.12% | -1.67% |
| WTTR | Select Energy | | Pollution & Treatment Controls | 9.23 | 61 | 0.76% | 21.61% |
| CSTE | Caesarstone | | Building Materials | 6.53 | 85 | 2.19% | 74.60% |
| ADSE | ADS-TEC Energy | | Electrical Equipment & Parts | 10.92 | 34 | 3.41% | 53.16% |
| NVX | Novonix | | Electrical Equipment & Parts | 2.23 | 54 | -1.98% | 14.36% |
| NX | Quanex Building | | Building Materials | 35.53 | 52 | 2.16% | 16.23% |
| LEGH | Legacy Housing | | Residential | 21.45 | 64 | 0.85% | -14.95% |
| ATRO | Astronics | | Aerospace/Defense | 19.01 | 64 | 3.48% | 9.13% |
| For chart view version of above stock list: Chart View ➞ 0 - 25 , 25 - 50 , 50 - 75 , 75 - 100 , 100 - 125 , 125 - 150 , 150 - 175 , 175 - 200 , 200 - 225 , 225 - 250 , 250 - 275 , 275 - 300 | ||
 | Click To Change The Sort Order: By Market Cap or Company Size Performance: Year-to-date, Week and Day |  |
|
Get the most comprehensive stock market coverage daily at 12Stocks.com ➞ Best Stocks Today ➞ Best Stocks Weekly ➞ Best Stocks Year-to-Date ➞ Best Stocks Trends ➞  Best Stocks Today 12Stocks.com Best Nasdaq Stocks ➞ Best S&P 500 Stocks ➞ Best Tech Stocks ➞ Best Biotech Stocks ➞ |
| Detailed Overview of Industrial Stocks |
| Industrial Technical Overview, Leaders & Laggards, Top Industrial ETF Funds & Detailed Industrial Stocks List, Charts, Trends & More |
| Industrial Sector: Technical Analysis, Trends & YTD Performance | |
| Industrial sector is composed of stocks
from industrial machinery, aerospace, defense, farm/construction
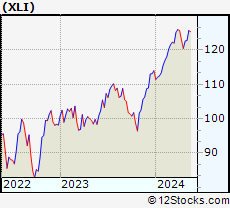
and industrial services subsectors. Industrial sector, as represented by XLI, an exchange-traded fund [ETF] that holds basket of Industrial stocks (e.g, Caterpillar, Boeing) is up by 8.7% and is currently outperforming the overall market by 1.15% year-to-date. Below is a quick view of Technical charts and trends: |
|
 XLI Weekly Chart |
|
| Long Term Trend: Good | |
| Medium Term Trend: Good | |
 XLI Daily Chart |
|
| Short Term Trend: Very Good | |
| Overall Trend Score: 85 | |
| YTD Performance: 8.7% | |
| **Trend Scores & Views Are Only For Educational Purposes And Not For Investing | |
| 12Stocks.com: Top Performing Industrial Sector Stocks | ||||||||||||||||||||||||||||||||||||||||||||||||
 The top performing Industrial sector stocks year to date are
Now, more recently, over last week, the top performing Industrial sector stocks on the move are


|
||||||||||||||||||||||||||||||||||||||||||||||||
| 12Stocks.com: Investing in Industrial Sector using Exchange Traded Funds | |
|
The following table shows list of key exchange traded funds (ETF) that
help investors track Industrial Index. For detailed view, check out our ETF Funds section of our website. Quick View: Move mouse or cursor over ETF symbol (ticker) to view short-term Technical chart and over ETF name to view long term chart. Click on ticker or stock name for detailed view. Click on to add stock symbol to your watchlist and to view watchlist. |
12Stocks.com List of ETFs that track Industrial Index
| Ticker | ETF Name | Watchlist | Recent Price | Smart Investing & Trading Score | Change % | Week % | Year-to-date % |
| XLI | Industrial | | 123.91 | 85 | 0.92 | 0.92 | 8.7% |
| UXI | Industrials | | 32.75 | 85 | 0.00 | 0 | 13.74% |
| PPA | Aerospace & Defense | | 103.91 | 95 | 0.95 | 0.95 | 12.75% |
| ITA | Aerospace & Defense | | 133.64 | 100 | 0.81 | 0.81 | 5.56% |
| ITB | Home Construction | | 108.59 | 90 | 1.14 | 1.14 | 6.74% |
| XHB | Homebuilders | | 106.64 | 90 | 1.35 | 1.35 | 11.48% |
| SIJ | Short Industrials | | 9.71 | 10 | -1.52 | -1.52 | -14.37% |
| IYJ | Industrials | | 122.27 | 60 | 0.90 | 0.9 | 6.92% |
| EXI | Global Industrials | | 138.21 | 85 | 0.64 | 0.64 | 8.46% |
| VIS | Industrials | | 239.76 | 73 | 0.96 | 0.96 | 8.77% |
| PSCI | SmallCap Industrials | | 120.82 | 53 | -0.07 | -0.07 | 4.19% |
| XAR | Aerospace & Defense | | 141.22 | 95 | 1.25 | 1.25 | 4.28% |
| ARKQ | ARK Industrial Innovation | | 54.95 | 82 | 1.55 | 1.55 | -4.77% |
| 12Stocks.com: Charts, Trends, Fundamental Data and Performances of Industrial Stocks | |
|
We now take in-depth look at all Industrial stocks including charts, multi-period performances and overall trends (as measured by Smart Investing & Trading Score). One can sort Industrial stocks (click link to choose) by Daily, Weekly and by Year-to-Date performances. Also, one can sort by size of the company or by market capitalization. |
| Select Your Default Chart Type: | |||||
| |||||
| Click on stock symbol or name for detailed view. Click on to add stock symbol to your watchlist and to view watchlist. Quick View: Move mouse or cursor over "Daily" to quickly view daily Technical stock chart and over "Weekly" to view weekly Technical stock chart. | |||||

 | USLM United States Lime & Minerals, Inc. |
| Sector: Industrials | |
| SubSector: General Building Materials | |
| MarketCap: 427.653 Millions | |
| Recent Price: 347.32 Smart Investing & Trading Score: 100 | |
| Day Percent Change: 2.10% Day Change: 7.13 | |
| Week Change: 2.1% Year-to-date Change: 50.8% | |
| USLM Links: Profile News Message Board | |
| Charts:- Daily , Weekly | |
| Add USLM to Watchlist: View: Get Complete USLM Trend Analysis ➞ | |
 | LEV The Lion Electric Company |
| Sector: Industrials | |
| SubSector: Farm & Heavy Construction Machinery | |
| MarketCap: 414 Millions | |
| Recent Price: 1.05 Smart Investing & Trading Score: 54 | |
| Day Percent Change: 4.46% Day Change: 0.04 | |
| Week Change: 4.46% Year-to-date Change: -40.6% | |
| LEV Links: Profile News Message Board | |
| Charts:- Daily , Weekly | |
| Add LEV to Watchlist: View: Get Complete LEV Trend Analysis ➞ | |
 | LOMA Loma Negra Compania Industrial Argentina Sociedad Anonima |
| Sector: Industrials | |
| SubSector: General Building Materials | |
| MarketCap: 408.853 Millions | |
| Recent Price: 7.63 Smart Investing & Trading Score: 100 | |
| Day Percent Change: 2.83% Day Change: 0.21 | |
| Week Change: 2.83% Year-to-date Change: 7.6% | |
| LOMA Links: Profile News Message Board | |
| Charts:- Daily , Weekly | |
| Add LOMA to Watchlist: View: Get Complete LOMA Trend Analysis ➞ | |
 | LXFR Luxfer Holdings PLC |
| Sector: Industrials | |
| SubSector: Diversified Machinery | |
| MarketCap: 406.716 Millions | |
| Recent Price: 11.75 Smart Investing & Trading Score: 100 | |
| Day Percent Change: 0.43% Day Change: 0.05 | |
| Week Change: 0.43% Year-to-date Change: 31.4% | |
| LXFR Links: Profile News Message Board | |
| Charts:- Daily , Weekly | |
| Add LXFR to Watchlist: View: Get Complete LXFR Trend Analysis ➞ | |
 | MYRG MYR Group Inc. |
| Sector: Industrials | |
| SubSector: General Contractors | |
| MarketCap: 405.363 Millions | |
| Recent Price: 146.69 Smart Investing & Trading Score: 0 | |
| Day Percent Change: 1.92% Day Change: 2.77 | |
| Week Change: 1.92% Year-to-date Change: 1.4% | |
| MYRG Links: Profile News Message Board | |
| Charts:- Daily , Weekly | |
| Add MYRG to Watchlist: View: Get Complete MYRG Trend Analysis ➞ | |
 | EVTL Vertical Aerospace Ltd. |
| Sector: Industrials | |
| SubSector: Aerospace & Defense | |
| MarketCap: 403 Millions | |
| Recent Price: 0.78 Smart Investing & Trading Score: 68 | |
| Day Percent Change: 0.91% Day Change: 0.01 | |
| Week Change: 0.91% Year-to-date Change: 13.9% | |
| EVTL Links: Profile News Message Board | |
| Charts:- Daily , Weekly | |
| Add EVTL to Watchlist: View: Get Complete EVTL Trend Analysis ➞ | |
 | SWIM Latham Group, Inc. |
| Sector: Industrials | |
| SubSector: Building Products & Equipment | |
| MarketCap: 388 Millions | |
| Recent Price: 2.87 Smart Investing & Trading Score: 22 | |
| Day Percent Change: 5.13% Day Change: 0.14 | |
| Week Change: 5.13% Year-to-date Change: 8.7% | |
| SWIM Links: Profile News Message Board | |
| Charts:- Daily , Weekly | |
| Add SWIM to Watchlist: View: Get Complete SWIM Trend Analysis ➞ | |
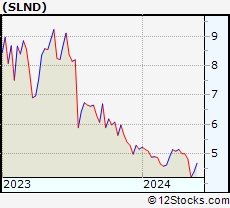 | SLND Southland Holdings, Inc. |
| Sector: Industrials | |
| SubSector: Engineering & Construction | |
| MarketCap: 388 Millions | |
| Recent Price: 4.31 Smart Investing & Trading Score: 27 | |
| Day Percent Change: -1.82% Day Change: -0.08 | |
| Week Change: -1.82% Year-to-date Change: -16.5% | |
| SLND Links: Profile News Message Board | |
| Charts:- Daily , Weekly | |
| Add SLND to Watchlist: View: Get Complete SLND Trend Analysis ➞ | |
 | TPC Tutor Perini Corporation |
| Sector: Industrials | |
| SubSector: Heavy Construction | |
| MarketCap: 382.595 Millions | |
| Recent Price: 18.51 Smart Investing & Trading Score: 100 | |
| Day Percent Change: 2.89% Day Change: 0.52 | |
| Week Change: 2.89% Year-to-date Change: 103.4% | |
| TPC Links: Profile News Message Board | |
| Charts:- Daily , Weekly | |
| Add TPC to Watchlist: View: Get Complete TPC Trend Analysis ➞ | |
 | IESC IES Holdings, Inc. |
| Sector: Industrials | |
| SubSector: General Contractors | |
| MarketCap: 380.963 Millions | |
| Recent Price: 170.47 Smart Investing & Trading Score: 100 | |
| Day Percent Change: 5.63% Day Change: 9.08 | |
| Week Change: 5.63% Year-to-date Change: 115.2% | |
| IESC Links: Profile News Message Board | |
| Charts:- Daily , Weekly | |
| Add IESC to Watchlist: View: Get Complete IESC Trend Analysis ➞ | |
 | REX REX American Resources Corporation |
| Sector: Industrials | |
| SubSector: Conglomerates | |
| MarketCap: 373.748 Millions | |
| Recent Price: 57.60 Smart Investing & Trading Score: 78 | |
| Day Percent Change: 0.82% Day Change: 0.47 | |
| Week Change: 0.82% Year-to-date Change: 21.8% | |
| REX Links: Profile News Message Board | |
| Charts:- Daily , Weekly | |
| Add REX to Watchlist: View: Get Complete REX Trend Analysis ➞ | |
 | MTW The Manitowoc Company, Inc. |
| Sector: Industrials | |
| SubSector: Farm & Construction Machinery | |
| MarketCap: 373.707 Millions | |
| Recent Price: 12.61 Smart Investing & Trading Score: 42 | |
| Day Percent Change: 1.45% Day Change: 0.18 | |
| Week Change: 1.45% Year-to-date Change: -24.5% | |
| MTW Links: Profile News Message Board | |
| Charts:- Daily , Weekly | |
| Add MTW to Watchlist: View: Get Complete MTW Trend Analysis ➞ | |
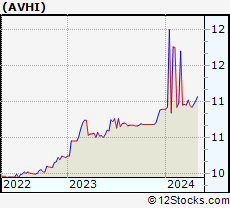 | AVHI AV Homes, Inc. |
| Sector: Industrials | |
| SubSector: Residential Construction | |
| MarketCap: 369.18 Millions | |
| Recent Price: 11.07 Smart Investing & Trading Score: 57 | |
| Day Percent Change: 0.00% Day Change: 0.00 | |
| Week Change: 0% Year-to-date Change: 1.7% | |
| AVHI Links: Profile News Message Board | |
| Charts:- Daily , Weekly | |
| Add AVHI to Watchlist: View: Get Complete AVHI Trend Analysis ➞ | |
 | FIP FTAI Infrastructure Inc. |
| Sector: Industrials | |
| SubSector: Industrials | |
| MarketCap: 368 Millions | |
| Recent Price: 7.39 Smart Investing & Trading Score: 71 | |
| Day Percent Change: 1.44% Day Change: 0.10 | |
| Week Change: 1.44% Year-to-date Change: 90.1% | |
| FIP Links: Profile News Message Board | |
| Charts:- Daily , Weekly | |
| Add FIP to Watchlist: View: Get Complete FIP Trend Analysis ➞ | |
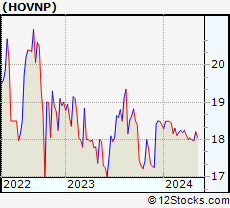 | HOVNP Hovnanian Enterprises, Inc. PFD DEP1/1000A |
| Sector: Industrials | |
| SubSector: Residential Construction | |
| MarketCap: 361.006 Millions | |
| Recent Price: 18.21 Smart Investing & Trading Score: 67 | |
| Day Percent Change: 0.00% Day Change: 0.00 | |
| Week Change: 0% Year-to-date Change: -1.0% | |
| HOVNP Links: Profile News Message Board | |
| Charts:- Daily , Weekly | |
| Add HOVNP to Watchlist: View: Get Complete HOVNP Trend Analysis ➞ | |
 | BOOM DMC Global Inc. |
| Sector: Industrials | |
| SubSector: Metal Fabrication | |
| MarketCap: 359.15 Millions | |
| Recent Price: 13.32 Smart Investing & Trading Score: 0 | |
| Day Percent Change: -2.35% Day Change: -0.32 | |
| Week Change: -2.35% Year-to-date Change: -29.2% | |
| BOOM Links: Profile News Message Board | |
| Charts:- Daily , Weekly | |
| Add BOOM to Watchlist: View: Get Complete BOOM Trend Analysis ➞ | |
 | TGI Triumph Group, Inc. |
| Sector: Industrials | |
| SubSector: Aerospace/Defense Products & Services | |
| MarketCap: 358.901 Millions | |
| Recent Price: 14.43 Smart Investing & Trading Score: 90 | |
| Day Percent Change: 4.38% Day Change: 0.61 | |
| Week Change: 4.38% Year-to-date Change: -13.0% | |
| TGI Links: Profile News Message Board | |
| Charts:- Daily , Weekly | |
| Add TGI to Watchlist: View: Get Complete TGI Trend Analysis ➞ | |
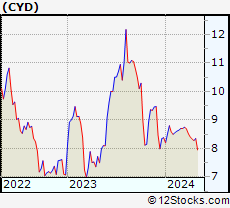 | CYD China Yuchai International Limited |
| Sector: Industrials | |
| SubSector: Diversified Machinery | |
| MarketCap: 357.416 Millions | |
| Recent Price: 8.24 Smart Investing & Trading Score: 22 | |
| Day Percent Change: 0.12% Day Change: 0.01 | |
| Week Change: 0.12% Year-to-date Change: -1.7% | |
| CYD Links: Profile News Message Board | |
| Charts:- Daily , Weekly | |
| Add CYD to Watchlist: View: Get Complete CYD Trend Analysis ➞ | |
 | WTTR Select Energy Services, Inc. |
| Sector: Industrials | |
| SubSector: Pollution & Treatment Controls | |
| MarketCap: 347.075 Millions | |
| Recent Price: 9.23 Smart Investing & Trading Score: 61 | |
| Day Percent Change: 0.76% Day Change: 0.07 | |
| Week Change: 0.76% Year-to-date Change: 21.6% | |
| WTTR Links: Profile News Message Board | |
| Charts:- Daily , Weekly | |
| Add WTTR to Watchlist: View: Get Complete WTTR Trend Analysis ➞ | |
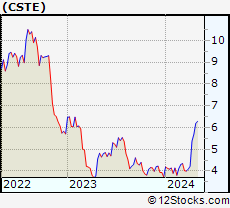 | CSTE Caesarstone Ltd. |
| Sector: Industrials | |
| SubSector: General Building Materials | |
| MarketCap: 338.653 Millions | |
| Recent Price: 6.53 Smart Investing & Trading Score: 85 | |
| Day Percent Change: 2.19% Day Change: 0.14 | |
| Week Change: 2.19% Year-to-date Change: 74.6% | |
| CSTE Links: Profile News Message Board | |
| Charts:- Daily , Weekly | |
| Add CSTE to Watchlist: View: Get Complete CSTE Trend Analysis ➞ | |
 | ADSE ADS-TEC Energy PLC |
| Sector: Industrials | |
| SubSector: Electrical Equipment & Parts | |
| MarketCap: 329 Millions | |
| Recent Price: 10.92 Smart Investing & Trading Score: 34 | |
| Day Percent Change: 3.41% Day Change: 0.36 | |
| Week Change: 3.41% Year-to-date Change: 53.2% | |
| ADSE Links: Profile News Message Board | |
| Charts:- Daily , Weekly | |
| Add ADSE to Watchlist: View: Get Complete ADSE Trend Analysis ➞ | |
 | NVX Novonix Limited |
| Sector: Industrials | |
| SubSector: Electrical Equipment & Parts | |
| MarketCap: 316 Millions | |
| Recent Price: 2.23 Smart Investing & Trading Score: 54 | |
| Day Percent Change: -1.98% Day Change: -0.04 | |
| Week Change: -1.98% Year-to-date Change: 14.4% | |
| NVX Links: Profile News Message Board | |
| Charts:- Daily , Weekly | |
| Add NVX to Watchlist: View: Get Complete NVX Trend Analysis ➞ | |
 | NX Quanex Building Products Corporation |
| Sector: Industrials | |
| SubSector: General Building Materials | |
| MarketCap: 315.453 Millions | |
| Recent Price: 35.53 Smart Investing & Trading Score: 52 | |
| Day Percent Change: 2.16% Day Change: 0.75 | |
| Week Change: 2.16% Year-to-date Change: 16.2% | |
| NX Links: Profile News Message Board | |
| Charts:- Daily , Weekly | |
| Add NX to Watchlist: View: Get Complete NX Trend Analysis ➞ | |
 | LEGH Legacy Housing Corporation |
| Sector: Industrials | |
| SubSector: Residential Construction | |
| MarketCap: 298.006 Millions | |
| Recent Price: 21.45 Smart Investing & Trading Score: 64 | |
| Day Percent Change: 0.85% Day Change: 0.18 | |
| Week Change: 0.85% Year-to-date Change: -15.0% | |
| LEGH Links: Profile News Message Board | |
| Charts:- Daily , Weekly | |
| Add LEGH to Watchlist: View: Get Complete LEGH Trend Analysis ➞ | |
 | ATRO Astronics Corporation |
| Sector: Industrials | |
| SubSector: Aerospace/Defense Products & Services | |
| MarketCap: 287.201 Millions | |
| Recent Price: 19.01 Smart Investing & Trading Score: 64 | |
| Day Percent Change: 3.48% Day Change: 0.64 | |
| Week Change: 3.48% Year-to-date Change: 9.1% | |
| ATRO Links: Profile News Message Board | |
| Charts:- Daily , Weekly | |
| Add ATRO to Watchlist: View: Get Complete ATRO Trend Analysis ➞ | |
| For tabular summary view of above stock list: Summary View ➞ 0 - 25 , 25 - 50 , 50 - 75 , 75 - 100 , 100 - 125 , 125 - 150 , 150 - 175 , 175 - 200 , 200 - 225 , 225 - 250 , 250 - 275 , 275 - 300 | ||
| Click To Change The Sort Order: By Market Cap or Company Size Performance: Year-to-date, Week and Day | |
| Select Chart Type: | ||
|
Best Stocks Today 12Stocks.com |
© 2024 12Stocks.com Terms & Conditions Privacy Contact Us
All Information Provided Only For Education And Not To Be Used For Investing or Trading. See Terms & Conditions


One More Thing ... Get Best Stocks Delivered Daily!
Never Ever Miss A Move With Our Top Ten Stocks Lists
Find Best Stocks In Any Market - Bull or Bear Market
Take A Peek At Our Top Ten Stocks Lists: Daily, Weekly, Year-to-Date & Top Trends
Find Best Stocks In Any Market - Bull or Bear Market
Take A Peek At Our Top Ten Stocks Lists: Daily, Weekly, Year-to-Date & Top Trends
Industrial Stocks With Best Up Trends [0-bearish to 100-bullish]: TPI Composites[100], IES [100], MasTec [100], Solid Power[100], Tutor Perini[100], Granite Construction[100], Woodward [100], Loma Negra[100], Carrier Global[100], Clean Harbors[100], AeroVironment [100]
Best Industrial Stocks Year-to-Date:
Intuitive Machines[133.74%], IES [115.19%], Tutor Perini[103.41%], FTAI Infrastructure[90.1%], Powell Industries[89.8%], NuScale Power[88.06%], Caesarstone [74.6%], EMCOR [73.81%], Comfort Systems[61.47%], Masonite [56.8%], ADS-TEC Energy[53.16%] Best Industrial Stocks This Week:
Virgin Galactic[11.81%], EHang [9.18%], BiomX [8.47%], Lilium N.V[7.69%], ZIM Integrated[7.66%], TPI Composites[7.49%], Intuitive Machines[6.67%], Amprius Technologies[5.8%], IES [5.63%], Comfort Systems[5.42%], Latham [5.13%] Best Industrial Stocks Daily:
Virgin Galactic[11.81%], EHang [9.18%], BiomX [8.47%], Lilium N.V[7.69%], ZIM Integrated[7.66%], TPI Composites[7.49%], Intuitive Machines[6.67%], Amprius Technologies[5.80%], IES [5.63%], Comfort Systems[5.42%], Latham [5.13%]