
 Login Sign Up


| |||||
 |  | ||||

| 12Stocks.com Market Intelligence |
Best Industrial Stocks
| In a hurry? Industrial Stocks Lists: Performance Trends Table, Stock Charts
Sort Industrial stocks: Daily, Weekly, Year-to-Date, Market Cap & Trends. Filter Industrial stocks list by size:All Industrial Large Mid-Range Small |
| 12Stocks.com Industrial Stocks Performances & Trends Daily | |||||||||
|
|  The overall Smart Investing & Trading Score is 30 (0-bearish to 100-bullish) which puts Industrial sector in short term bearish to neutral trend. The Smart Investing & Trading Score from previous trading session is 60 and hence a deterioration of trend.
| ||||||||
Here are the Smart Investing & Trading Scores of the most requested Industrial stocks at 12Stocks.com (click stock name for detailed review):
|


| 12Stocks.com: Investing in Industrial sector with Stocks | |
|
The following table helps investors and traders sort through current performance and trends (as measured by Smart Investing & Trading Score) of various
stocks in the Industrial sector. Quick View: Move mouse or cursor over stock symbol (ticker) to view short-term Technical chart and over stock name to view long term chart. Click on  to add stock symbol to your watchlist and to add stock symbol to your watchlist and  to view watchlist. Click on any ticker or stock name for detailed market intelligence report for that stock. to view watchlist. Click on any ticker or stock name for detailed market intelligence report for that stock. |
12Stocks.com Performance of Stocks in Industrial Sector
| Ticker | Stock Name | Watchlist | Category | Recent Price | Smart Investing & Trading Score | Change % | YTD Change% |
| ATI | Allegheny Technologies |   | Fabrication | 72.46 | 0 | 53.08% | 36.85% |
| EME | EMCOR | | Contractors | 605.62 | 30 | 2.67% | 36.09% |
| NPO | EnPro Industries | | Equipment | 222.87 | 60 | 27.24% | 34.74% |
| MTZ | MasTec | | Heavy Construction | 177.80 | 20 | 2.17% | 33.38% |
| PCT | PureCycle Technologies | | Pollution & Treatment Controls | 13.30 | 40 | -0.17% | 32.39% |
| LECO | Loln Electric | | Small Tools & Accessories | 237.27 | 50 | 1.60% | 31.92% |
| SPXC | SPX | | Machinery | 186.39 | 50 | 2.78% | 31.86% |
| BA | Boeing | | Aerospace/Defense | 235.26 | 90 | -26.50% | 31.85% |
| HEI | HEICO | | Aerospace/Defense | 307.91 | 20 | 0.34% | 31.74% |
| REX | REX American | | Conglomerates | 55.17 | 90 | 4.03% | 31.47% |
| ROAD | Construction Partners | | Heavy Construction | 107.57 | 50 | 90.54% | 31.30% |
| CR | Crane Co | | Machinery | 189.19 | 20 | 2.63% | 31.14% |
| GNRC | Generac | | Machinery | 198.80 | 80 | 44.78% | 30.83% |
| TWI | Titan | | Machinery | 8.51 | 70 | 6.70% | 30.78% |
| EOSE | Eos Energy | | Electrical Equipment & Parts | 5.86 | 30 | -4.07% | 30.45% |
| GMS | GMS | | Building Materials | 109.42 | 30 | 2.97% | 29.19% |
| CNM | Core & Main | | Industrial Distribution | 64.12 | 40 | 2.66% | 28.97% |
| AIR | AAR | | Aerospace/Defense | 75.38 | 40 | 1.64% | 28.39% |
| GVA | Granite Construction | | Heavy Construction | 109.25 | 70 | 74.15% | 27.28% |
| MIR | Mirion Technologies | | Specialty Industrial Machinery | 20.55 | 30 | 1.01% | 26.82% |
| SATL | Satellogic | | Aerospace & Defense | 3.71 | 90 | 2.94% | 26.67% |
| RYI | Ryerson Holding | | Fabrication | 21.79 | 50 | -28.23% | 25.96% |
| PRLB | Proto Labs | | Machine Tools | 48.15 | 100 | 6.69% | 25.86% |
| ALG | Alamo | | Machinery | 222.28 | 50 | 3.44% | 25.62% |
| MYRG | MYR | | Contractors | 181.01 | 20 | 0.36% | 25.45% |
| For chart view version of above stock list: Chart View ➞ 0 - 25 , 25 - 50 , 50 - 75 , 75 - 100 , 100 - 125 , 125 - 150 , 150 - 175 , 175 - 200 , 200 - 225 , 225 - 250 , 250 - 275 , 275 - 300 | ||
 | Click To Change The Sort Order: By Market Cap or Company Size Performance: Year-to-date, Week and Day |  |
|
Get the most comprehensive stock market coverage daily at 12Stocks.com ➞ Best Stocks Today ➞ Best Stocks Weekly ➞ Best Stocks Year-to-Date ➞ Best Stocks Trends ➞  Best Stocks Today 12Stocks.com Best Nasdaq Stocks ➞ Best S&P 500 Stocks ➞ Best Tech Stocks ➞ Best Biotech Stocks ➞ |
| Detailed Overview of Industrial Stocks |
| Industrial Technical Overview, Leaders & Laggards, Top Industrial ETF Funds & Detailed Industrial Stocks List, Charts, Trends & More |
| Industrial Sector: Technical Analysis, Trends & YTD Performance | |
| Industrial sector is composed of stocks
from industrial machinery, aerospace, defense, farm/construction
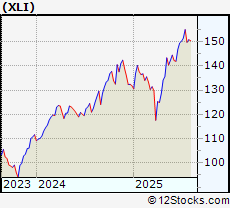
and industrial services subsectors. Industrial sector, as represented by XLI, an exchange-traded fund [ETF] that holds basket of Industrial stocks (e.g, Caterpillar, Boeing) is up by 16.43% and is currently outperforming the overall market by 6.1% year-to-date. Below is a quick view of Technical charts and trends: |
|
 XLI Weekly Chart |
|
| Long Term Trend: Very Good | |
| Medium Term Trend: Deteriorating | |
 XLI Daily Chart |
|
| Short Term Trend: Not Good | |
| Overall Trend Score: 30 | |
| YTD Performance: 16.43% | |
| **Trend Scores & Views Are Only For Educational Purposes And Not For Investing | |
| 12Stocks.com: Top Performing Industrial Sector Stocks | ||||||||||||||||||||||||||||||||||||||||||||||||
 The top performing Industrial sector stocks year to date are
Now, more recently, over last week, the top performing Industrial sector stocks on the move are


|
||||||||||||||||||||||||||||||||||||||||||||||||
| 12Stocks.com: Investing in Industrial Sector using Exchange Traded Funds | |
|
The following table shows list of key exchange traded funds (ETF) that
help investors track Industrial Index. For detailed view, check out our ETF Funds section of our website. Quick View: Move mouse or cursor over ETF symbol (ticker) to view short-term Technical chart and over ETF name to view long term chart. Click on ticker or stock name for detailed view. Click on to add stock symbol to your watchlist and to view watchlist. |
12Stocks.com List of ETFs that track Industrial Index
| Ticker | ETF Name | Watchlist | Recent Price | Smart Investing & Trading Score | Change % | Week % | Year-to-date % |
| XLI | Industrial | | 150.44 | 30 | 1.17 | 1.03 | 16.43% |
| UXI | Industrials | | 44.33 | 30 | 31.9 | 2 | 26.16% |
| PPA | Aerospace & Defense | | 146.23 | 20 | 0.64 | 0.39 | 29.15% |
| ITA | Aerospace & Defense | | 195.08 | 20 | 0.67 | -0.3 | 35.76% |
| ITB | Home Construction | | 109.62 | 100 | 4.39 | 7.99 | 9.08% |
| XHB | Homebuilders | | 113.34 | 100 | 4.45 | 8.64 | 11.28% |
| SIJ | Short Industrials | | 12.29 | 70 | -1.1 | -1.91 | -27.73% |
| IYJ | Industrials | | 143.75 | 30 | 1.02 | 1.74 | 9.55% |
| EXI | Global Industrials | | 169.04 | 50 | 1.32 | 1.47 | 21.49% |
| VIS | Industrials | | 288.11 | 30 | 19.27 | 1.49 | 15.62% |
| PSCI | SmallCap Industrials | | 145.06 | 60 | 2.89 | 5.67 | 11.45% |
| XAR | Aerospace & Defense | | 215.51 | 30 | 0.99 | 0.99 | 32.3% |
| ARKQ | ARK Industrial Innovation | | 99.95 | 80 | 2.92 | 3.86 | 32.12% |
| 12Stocks.com: Charts, Trends, Fundamental Data and Performances of Industrial Stocks | |
|
We now take in-depth look at all Industrial stocks including charts, multi-period performances and overall trends (as measured by Smart Investing & Trading Score). One can sort Industrial stocks (click link to choose) by Daily, Weekly and by Year-to-Date performances. Also, one can sort by size of the company or by market capitalization. |
| Select Your Default Chart Type: | |||||
| |||||
| Click on stock symbol or name for detailed view. Click on to add stock symbol to your watchlist and to view watchlist. Quick View: Move mouse or cursor over "Daily" to quickly view daily Technical stock chart and over "Weekly" to view weekly Technical stock chart. | |||||

 | ATI Allegheny Technologies Incorporated |
| Sector: Industrials | |
| SubSector: Metal Fabrication | |
| MarketCap: 913.35 Millions | |
| Recent Price: 72.46 Smart Investing & Trading Score: 0 | |
| Day Percent Change: 53.08% Day Change: 23.29 | |
| Week Change: 1.14% Year-to-date Change: 36.9% | |
| ATI Links: Profile News Message Board | |
| Charts:- Daily , Weekly | |
| Add ATI to Watchlist: View: Get Complete ATI Trend Analysis ➞ | |
 | EME EMCOR Group, Inc. |
| Sector: Industrials | |
| SubSector: General Contractors | |
| MarketCap: 3417.83 Millions | |
| Recent Price: 605.62 Smart Investing & Trading Score: 30 | |
| Day Percent Change: 2.67% Day Change: 9.93 | |
| Week Change: -0.89% Year-to-date Change: 36.1% | |
| EME Links: Profile News Message Board | |
| Charts:- Daily , Weekly | |
| Add EME to Watchlist: View: Get Complete EME Trend Analysis ➞ | |
 | NPO EnPro Industries, Inc. |
| Sector: Industrials | |
| SubSector: Industrial Equipment & Components | |
| MarketCap: 734.309 Millions | |
| Recent Price: 222.87 Smart Investing & Trading Score: 60 | |
| Day Percent Change: 27.24% Day Change: 34.33 | |
| Week Change: 4.83% Year-to-date Change: 34.7% | |
| NPO Links: Profile News Message Board | |
| Charts:- Daily , Weekly | |
| Add NPO to Watchlist: View: Get Complete NPO Trend Analysis ➞ | |
 | MTZ MasTec, Inc. |
| Sector: Industrials | |
| SubSector: Heavy Construction | |
| MarketCap: 2596.95 Millions | |
| Recent Price: 177.80 Smart Investing & Trading Score: 20 | |
| Day Percent Change: 2.17% Day Change: 2.38 | |
| Week Change: -0.83% Year-to-date Change: 33.4% | |
| MTZ Links: Profile News Message Board | |
| Charts:- Daily , Weekly | |
| Add MTZ to Watchlist: View: Get Complete MTZ Trend Analysis ➞ | |
 | PCT PureCycle Technologies, Inc. |
| Sector: Industrials | |
| SubSector: Pollution & Treatment Controls | |
| MarketCap: 1610 Millions | |
| Recent Price: 13.30 Smart Investing & Trading Score: 40 | |
| Day Percent Change: -0.17% Day Change: -0.01 | |
| Week Change: 4.38% Year-to-date Change: 32.4% | |
| PCT Links: Profile News Message Board | |
| Charts:- Daily , Weekly | |
| Add PCT to Watchlist: View: Get Complete PCT Trend Analysis ➞ | |
 | LECO Lincoln Electric Holdings, Inc. |
| Sector: Industrials | |
| SubSector: Small Tools & Accessories | |
| MarketCap: 4085.06 Millions | |
| Recent Price: 237.27 Smart Investing & Trading Score: 50 | |
| Day Percent Change: 1.6% Day Change: 3.11 | |
| Week Change: 1.45% Year-to-date Change: 31.9% | |
| LECO Links: Profile News Message Board | |
| Charts:- Daily , Weekly | |
| Add LECO to Watchlist: View: Get Complete LECO Trend Analysis ➞ | |
 | SPXC SPX Corporation |
| Sector: Industrials | |
| SubSector: Diversified Machinery | |
| MarketCap: 1415.56 Millions | |
| Recent Price: 186.39 Smart Investing & Trading Score: 50 | |
| Day Percent Change: 2.78% Day Change: 4.27 | |
| Week Change: -5.72% Year-to-date Change: 31.9% | |
| SPXC Links: Profile News Message Board | |
| Charts:- Daily , Weekly | |
| Add SPXC to Watchlist: View: Get Complete SPXC Trend Analysis ➞ | |
 | BA The Boeing Company |
| Sector: Industrials | |
| SubSector: Aerospace/Defense Products & Services | |
| MarketCap: 65336.4 Millions | |
| Recent Price: 235.26 Smart Investing & Trading Score: 90 | |
| Day Percent Change: -26.5% Day Change: -63.08 | |
| Week Change: 3.7% Year-to-date Change: 31.9% | |
| BA Links: Profile News Message Board | |
| Charts:- Daily , Weekly | |
| Add BA to Watchlist: View: Get Complete BA Trend Analysis ➞ | |
 | HEI HEICO Corporation |
| Sector: Industrials | |
| SubSector: Aerospace/Defense Products & Services | |
| MarketCap: 10023.1 Millions | |
| Recent Price: 307.91 Smart Investing & Trading Score: 20 | |
| Day Percent Change: 0.34% Day Change: 0.84 | |
| Week Change: -1.14% Year-to-date Change: 31.7% | |
| HEI Links: Profile News Message Board | |
| Charts:- Daily , Weekly | |
| Add HEI to Watchlist: View: Get Complete HEI Trend Analysis ➞ | |
 | REX REX American Resources Corporation |
| Sector: Industrials | |
| SubSector: Conglomerates | |
| MarketCap: 373.748 Millions | |
| Recent Price: 55.17 Smart Investing & Trading Score: 90 | |
| Day Percent Change: 4.03% Day Change: 1.85 | |
| Week Change: 6.49% Year-to-date Change: 31.5% | |
| REX Links: Profile News Message Board | |
| Charts:- Daily , Weekly | |
| Add REX to Watchlist: View: Get Complete REX Trend Analysis ➞ | |
 | ROAD Construction Partners, Inc. |
| Sector: Industrials | |
| SubSector: Heavy Construction | |
| MarketCap: 903.095 Millions | |
| Recent Price: 107.57 Smart Investing & Trading Score: 50 | |
| Day Percent Change: 90.54% Day Change: 30.73 | |
| Week Change: 24.32% Year-to-date Change: 31.3% | |
| ROAD Links: Profile News Message Board | |
| Charts:- Daily , Weekly | |
| Add ROAD to Watchlist: View: Get Complete ROAD Trend Analysis ➞ | |
 | CR Crane Co. |
| Sector: Industrials | |
| SubSector: Diversified Machinery | |
| MarketCap: 2715.16 Millions | |
| Recent Price: 189.19 Smart Investing & Trading Score: 20 | |
| Day Percent Change: 2.63% Day Change: 3.97 | |
| Week Change: 2.07% Year-to-date Change: 31.1% | |
| CR Links: Profile News Message Board | |
| Charts:- Daily , Weekly | |
| Add CR to Watchlist: View: Get Complete CR Trend Analysis ➞ | |
 | GNRC Generac Holdings Inc. |
| Sector: Industrials | |
| SubSector: Diversified Machinery | |
| MarketCap: 5736.26 Millions | |
| Recent Price: 198.80 Smart Investing & Trading Score: 80 | |
| Day Percent Change: 44.78% Day Change: 48.51 | |
| Week Change: 4.61% Year-to-date Change: 30.8% | |
| GNRC Links: Profile News Message Board | |
| Charts:- Daily , Weekly | |
| Add GNRC to Watchlist: View: Get Complete GNRC Trend Analysis ➞ | |
 | TWI Titan International, Inc. |
| Sector: Industrials | |
| SubSector: Farm & Construction Machinery | |
| MarketCap: 104.607 Millions | |
| Recent Price: 8.51 Smart Investing & Trading Score: 70 | |
| Day Percent Change: 6.7% Day Change: 0.52 | |
| Week Change: 5.34% Year-to-date Change: 30.8% | |
| TWI Links: Profile News Message Board | |
| Charts:- Daily , Weekly | |
| Add TWI to Watchlist: View: Get Complete TWI Trend Analysis ➞ | |
 | EOSE Eos Energy Enterprises, Inc. |
| Sector: Industrials | |
| SubSector: Electrical Equipment & Parts | |
| MarketCap: 76627 Millions | |
| Recent Price: 5.86 Smart Investing & Trading Score: 30 | |
| Day Percent Change: -4.07% Day Change: -0.1 | |
| Week Change: -1.86% Year-to-date Change: 30.5% | |
| EOSE Links: Profile News Message Board | |
| Charts:- Daily , Weekly | |
| Add EOSE to Watchlist: View: Get Complete EOSE Trend Analysis ➞ | |
 | GMS GMS Inc. |
| Sector: Industrials | |
| SubSector: General Building Materials | |
| MarketCap: 587.753 Millions | |
| Recent Price: 109.42 Smart Investing & Trading Score: 30 | |
| Day Percent Change: 2.97% Day Change: 2.75 | |
| Week Change: 0.08% Year-to-date Change: 29.2% | |
| GMS Links: Profile News Message Board | |
| Charts:- Daily , Weekly | |
| Add GMS to Watchlist: View: Get Complete GMS Trend Analysis ➞ | |
 | CNM Core & Main, Inc. |
| Sector: Industrials | |
| SubSector: Industrial Distribution | |
| MarketCap: 7150 Millions | |
| Recent Price: 64.12 Smart Investing & Trading Score: 40 | |
| Day Percent Change: 2.66% Day Change: 1.37 | |
| Week Change: 3.34% Year-to-date Change: 29.0% | |
| CNM Links: Profile News Message Board | |
| Charts:- Daily , Weekly | |
| Add CNM to Watchlist: View: Get Complete CNM Trend Analysis ➞ | |
 | AIR AAR Corp. |
| Sector: Industrials | |
| SubSector: Aerospace/Defense Products & Services | |
| MarketCap: 591.701 Millions | |
| Recent Price: 75.38 Smart Investing & Trading Score: 40 | |
| Day Percent Change: 1.64% Day Change: 1.05 | |
| Week Change: 9.16% Year-to-date Change: 28.4% | |
| AIR Links: Profile News Message Board | |
| Charts:- Daily , Weekly | |
| Add AIR to Watchlist: View: Get Complete AIR Trend Analysis ➞ | |
 | GVA Granite Construction Incorporated |
| Sector: Industrials | |
| SubSector: Heavy Construction | |
| MarketCap: 725.895 Millions | |
| Recent Price: 109.25 Smart Investing & Trading Score: 70 | |
| Day Percent Change: 74.15% Day Change: 31.38 | |
| Week Change: 19.23% Year-to-date Change: 27.3% | |
| GVA Links: Profile News Message Board | |
| Charts:- Daily , Weekly | |
| Add GVA to Watchlist: View: Get Complete GVA Trend Analysis ➞ | |
 | MIR Mirion Technologies, Inc. |
| Sector: Industrials | |
| SubSector: Specialty Industrial Machinery | |
| MarketCap: 1920 Millions | |
| Recent Price: 20.55 Smart Investing & Trading Score: 30 | |
| Day Percent Change: 1.01% Day Change: 0.11 | |
| Week Change: 2.74% Year-to-date Change: 26.8% | |
| MIR Links: Profile News Message Board | |
| Charts:- Daily , Weekly | |
| Add MIR to Watchlist: View: Get Complete MIR Trend Analysis ➞ | |
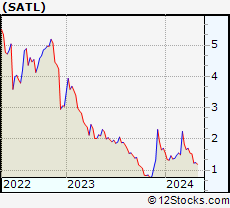 | SATL Satellogic Inc. |
| Sector: Industrials | |
| SubSector: Aerospace & Defense | |
| MarketCap: 170 Millions | |
| Recent Price: 3.71 Smart Investing & Trading Score: 90 | |
| Day Percent Change: 2.94% Day Change: 0.03 | |
| Week Change: 4.94% Year-to-date Change: 26.7% | |
| SATL Links: Profile News Message Board | |
| Charts:- Daily , Weekly | |
| Add SATL to Watchlist: View: Get Complete SATL Trend Analysis ➞ | |
 | RYI Ryerson Holding Corporation |
| Sector: Industrials | |
| SubSector: Metal Fabrication | |
| MarketCap: 202.55 Millions | |
| Recent Price: 21.79 Smart Investing & Trading Score: 50 | |
| Day Percent Change: -28.23% Day Change: -7.97 | |
| Week Change: 10.18% Year-to-date Change: 26.0% | |
| RYI Links: Profile News Message Board | |
| Charts:- Daily , Weekly | |
| Add RYI to Watchlist: View: Get Complete RYI Trend Analysis ➞ | |
 | PRLB Proto Labs, Inc. |
| Sector: Industrials | |
| SubSector: Machine Tools & Accessories | |
| MarketCap: 1944.78 Millions | |
| Recent Price: 48.15 Smart Investing & Trading Score: 100 | |
| Day Percent Change: 6.69% Day Change: 1.92 | |
| Week Change: 9.43% Year-to-date Change: 25.9% | |
| PRLB Links: Profile News Message Board | |
| Charts:- Daily , Weekly | |
| Add PRLB to Watchlist: View: Get Complete PRLB Trend Analysis ➞ | |
 | ALG Alamo Group Inc. |
| Sector: Industrials | |
| SubSector: Farm & Construction Machinery | |
| MarketCap: 964.107 Millions | |
| Recent Price: 222.28 Smart Investing & Trading Score: 50 | |
| Day Percent Change: 3.44% Day Change: 6.13 | |
| Week Change: 3.4% Year-to-date Change: 25.6% | |
| ALG Links: Profile News Message Board | |
| Charts:- Daily , Weekly | |
| Add ALG to Watchlist: View: Get Complete ALG Trend Analysis ➞ | |
 | MYRG MYR Group Inc. |
| Sector: Industrials | |
| SubSector: General Contractors | |
| MarketCap: 405.363 Millions | |
| Recent Price: 181.01 Smart Investing & Trading Score: 20 | |
| Day Percent Change: 0.36% Day Change: 0.37 | |
| Week Change: 0.5% Year-to-date Change: 25.5% | |
| MYRG Links: Profile News Message Board | |
| Charts:- Daily , Weekly | |
| Add MYRG to Watchlist: View: Get Complete MYRG Trend Analysis ➞ | |
| For tabular summary view of above stock list: Summary View ➞ 0 - 25 , 25 - 50 , 50 - 75 , 75 - 100 , 100 - 125 , 125 - 150 , 150 - 175 , 175 - 200 , 200 - 225 , 225 - 250 , 250 - 275 , 275 - 300 | ||
| Click To Change The Sort Order: By Market Cap or Company Size Performance: Year-to-date, Week and Day | |
| Select Chart Type: | ||
|
Best Stocks Today 12Stocks.com |
© 2025 12Stocks.com Terms & Conditions Privacy Contact Us
All Information Provided Only For Education And Not To Be Used For Investing or Trading. See Terms & Conditions


One More Thing ... Get Best Stocks Delivered Daily!
Never Ever Miss A Move With Our Top Ten Stocks Lists
Find Best Stocks In Any Market - Bull or Bear Market
Take A Peek At Our Top Ten Stocks Lists: Daily, Weekly, Year-to-Date & Top Trends
Find Best Stocks In Any Market - Bull or Bear Market
Take A Peek At Our Top Ten Stocks Lists: Daily, Weekly, Year-to-Date & Top Trends
Industrial Stocks With Best Up Trends [0-bearish to 100-bullish]: Toll Brothers[100], Pulte [100], Taylor Morrison[100], Century Communities[100], Masco [100], Legacy Housing[100], Evolv Technologies[100], Solid Power[100], Meritage Homes[100], Proto Labs[100], Installed Building[100]
Best Industrial Stocks Year-to-Date:
China Yuchai[215.15%], Amprius Technologies[173.93%], Solid Power[155.03%], Tutor Perini[138.64%], Symbotic [126.4%], American Superconductor[119.61%], Joby Aviation[118.82%], Astronics [114.6%], NuScale Power[108.03%], Evolv Technologies[89.62%], Elbit Systems[79.41%] Best Industrial Stocks This Week:
Solid Power[40.52%], Frontier [37.7%], Hillenbrand [34.71%], CompoSecure [34.1%], Installed Building[28.67%], LegalZoom.com [25.35%], Construction Partners[24.32%], China Yuchai[24.26%], Montrose Environmental[23.35%], Sun Country[22.92%], Tutor Perini[22.14%] Best Industrial Stocks Daily:
Embraer S.A[128.34%], Virgin Galactic[105.78%], Graham [92.69%], Argan [92.17%], AeroVironment [91.63%], Construction Partners[90.54%], Comfort Systems[86.98%], Toll Brothers[84.15%], Granite Construction[74.15%], Eastern [68.24%], Armstrong World[62.49%]