
 Login Sign Up


| |||||
 |  | ||||

| 12Stocks.com Market Intelligence |
Best Industrial Stocks
| In a hurry? Industrial Stocks Lists: Performance Trends Table, Stock Charts
Sort Industrial stocks: Daily, Weekly, Year-to-Date, Market Cap & Trends. Filter Industrial stocks list by size:All Industrial Large Mid-Range Small |
| 12Stocks.com Industrial Stocks Performances & Trends Daily | |||||||||
|
|  The overall Smart Investing & Trading Score is 30 (0-bearish to 100-bullish) which puts Industrial sector in short term bearish to neutral trend. The Smart Investing & Trading Score from previous trading session is 40 and hence a deterioration of trend.
| ||||||||
Here are the Smart Investing & Trading Scores of the most requested Industrial stocks at 12Stocks.com (click stock name for detailed review):
|


| 12Stocks.com: Investing in Industrial sector with Stocks | |
|
The following table helps investors and traders sort through current performance and trends (as measured by Smart Investing & Trading Score) of various
stocks in the Industrial sector. Quick View: Move mouse or cursor over stock symbol (ticker) to view short-term Technical chart and over stock name to view long term chart. Click on  to add stock symbol to your watchlist and to add stock symbol to your watchlist and  to view watchlist. Click on any ticker or stock name for detailed market intelligence report for that stock. to view watchlist. Click on any ticker or stock name for detailed market intelligence report for that stock. |
12Stocks.com Performance of Stocks in Industrial Sector
| Ticker | Stock Name | Watchlist | Category | Recent Price | Smart Investing & Trading Score | Change % | YTD Change% |
| ATRO | Astronics |   | Aerospace/Defense | 36.37 | 70 | 3.46% | 123.06% |
| BWMN | Bowman Consulting | | Engineering & Construction | 42.73 | 70 | 3.37% | 59.60% |
| TPC | Tutor Perini | | Heavy Construction | 58.94 | 70 | 1.84% | 135.62% |
| ERJ | Embraer S.A | | Aerospace/Defense | 56.33 | 70 | 1.11% | 53.59% |
| NVR | NVR | | Residential | 8179.47 | 70 | 0.76% | 2.04% |
| ATI | Allegheny Technologies | | Fabrication | 77.54 | 70 | 0.64% | 30.45% |
| SPR | Spirit AeroSystems | | Aerospace/Defense | 41.59 | 70 | 0.48% | 16.87% |
| BOOM | DMC Global | | Fabrication | 6.70 | 70 | 0.30% | -9.93% |
| TTC | Toro | | Small Tools & Accessories | 81.06 | 70 | -0.05% | -4.13% |
| SMR | NuScale Power | | Specialty Industrial Machinery | 34.65 | 70 | -0.89% | 86.78% |
| TILE | Interface | | Textile Industrial | 26.72 | 70 | -1.10% | 7.54% |
| GENC | Gencor Industries | | Machinery | 16.26 | 70 | -1.20% | -11.67% |
| HSHP | Himalaya Shipping | | Marine Shipping | 7.57 | 66 | 1.90% | 58.85% |
| TWIN | Twin Disc | | Machinery | 12.64 | 60 | 30.05% | -3.69% |
| NVX | Novonix | | Electrical Equipment & Parts | 1.49 | 60 | 7.08% | -28.61% |
| SST | System1 | | Specialty | 7.12 | 60 | 4.83% | -25.06% |
| LEGH | Legacy Housing | | Residential | 27.95 | 60 | 2.44% | 12.28% |
| FIX | Comfort Systems | | Contractors | 703.38 | 60 | 1.90% | 64.02% |
| PRTH | Priority Technology | | Conglomerates | 8.37 | 60 | 1.66% | -32.09% |
| USLM | United States | | Building Materials | 125.92 | 60 | 1.65% | -13.80% |
| CMPO | CompoSecure | | Fabrication | 19.12 | 60 | 1.37% | 51.42% |
| AGX | Argan | | Heavy Construction | 228.22 | 60 | 1.11% | 60.37% |
| ROAD | Construction Partners | | Heavy Construction | 119.90 | 60 | 1.05% | 31.11% |
| PRIM | Primoris Services | | Heavy Construction | 118.55 | 60 | 1.01% | 46.56% |
| TRS | TriMas | | Equipment | 38.67 | 60 | 0.86% | 53.92% |
| For chart view version of above stock list: Chart View ➞ 0 - 25 , 25 - 50 , 50 - 75 , 75 - 100 , 100 - 125 , 125 - 150 , 150 - 175 , 175 - 200 , 200 - 225 , 225 - 250 , 250 - 275 , 275 - 300 | ||
 | Click To Change The Sort Order: By Market Cap or Company Size Performance: Year-to-date, Week and Day |  |
|
Get the most comprehensive stock market coverage daily at 12Stocks.com ➞ Best Stocks Today ➞ Best Stocks Weekly ➞ Best Stocks Year-to-Date ➞ Best Stocks Trends ➞  Best Stocks Today 12Stocks.com Best Nasdaq Stocks ➞ Best S&P 500 Stocks ➞ Best Tech Stocks ➞ Best Biotech Stocks ➞ |
| Detailed Overview of Industrial Stocks |
| Industrial Technical Overview, Leaders & Laggards, Top Industrial ETF Funds & Detailed Industrial Stocks List, Charts, Trends & More |
| Industrial Sector: Technical Analysis, Trends & YTD Performance | |
| Industrial sector is composed of stocks
from industrial machinery, aerospace, defense, farm/construction
and industrial services subsectors. Industrial sector, as represented by XLI, an exchange-traded fund [ETF] that holds basket of Industrial stocks (e.g, Caterpillar, Boeing) is up by 11.44% and is currently outperforming the overall market by 4.92% year-to-date. Below is a quick view of Technical charts and trends: |
|
 XLI Weekly Chart |
|
| Long Term Trend: Very Good | |
| Medium Term Trend: Very Good | |
 XLI Daily Chart |
|
| Short Term Trend: Not Good | |
| Overall Trend Score: 30 | |
| YTD Performance: 11.44% | |
| **Trend Scores & Views Are Only For Educational Purposes And Not For Investing | |
| 12Stocks.com: Top Performing Industrial Sector Stocks | ||||||||||||||||||||||||||||||||||||||||||||||||
 The top performing Industrial sector stocks year to date are
Now, more recently, over last week, the top performing Industrial sector stocks on the move are


|
||||||||||||||||||||||||||||||||||||||||||||||||
| 12Stocks.com: Investing in Industrial Sector using Exchange Traded Funds | |
|
The following table shows list of key exchange traded funds (ETF) that
help investors track Industrial Index. For detailed view, check out our ETF Funds section of our website. Quick View: Move mouse or cursor over ETF symbol (ticker) to view short-term Technical chart and over ETF name to view long term chart. Click on ticker or stock name for detailed view. Click on to add stock symbol to your watchlist and to view watchlist. |
12Stocks.com List of ETFs that track Industrial Index
| Ticker | ETF Name | Watchlist | Recent Price | Smart Investing & Trading Score | Change % | Week % | Year-to-date % |
| XLI | Industrial | | 152.01 | 30 | 1.7 | 1.86 | 11.44% |
| UXI | Industrials | | 45.12 | 20 | 3.19 | 3.54 | 16.37% |
| PPA | Aerospace & Defense | | 147.97 | 50 | 0.88 | 0.4 | 21.93% |
| ITA | Aerospace & Defense | | 198.42 | 50 | 0.53 | 0.47 | 25.5% |
| ITB | Home Construction | | 110.70 | 60 | 5.42 | 3.17 | 6.94% |
| XHB | Homebuilders | | 113.0 | 40 | -0.88 | -0.88 | 4.75% |
| SIJ | Short Industrials | | 11.97 | 70 | -3.12 | -3.42 | -20.76% |
| IYJ | Industrials | | 146.17 | 30 | -0.24 | -0.58 | 8.12% |
| EXI | Global Industrials | | 168.86 | 20 | -0.42 | -0.57 | 20.04% |
| VIS | Industrials | | 291.31 | 30 | -0.33 | -0.59 | 13.79% |
| PSCI | SmallCap Industrials | | 147.86 | 50 | -0.02 | -1.17 | 7.75% |
| XAR | Aerospace & Defense | | 217.44 | 40 | 0.62 | -1.47 | 28.91% |
| ARKQ | ARK Industrial Innovation | | 97.96 | 20 | 0.08 | -5.38 | 23.44% |
| 12Stocks.com: Charts, Trends, Fundamental Data and Performances of Industrial Stocks | |
|
We now take in-depth look at all Industrial stocks including charts, multi-period performances and overall trends (as measured by Smart Investing & Trading Score). One can sort Industrial stocks (click link to choose) by Daily, Weekly and by Year-to-Date performances. Also, one can sort by size of the company or by market capitalization. |
| Select Your Default Chart Type: | |||||
| |||||
| Click on stock symbol or name for detailed view. Click on to add stock symbol to your watchlist and to view watchlist. Quick View: Move mouse or cursor over "Daily" to quickly view daily Technical stock chart and over "Weekly" to view weekly Technical stock chart. | |||||

 | ATRO Astronics Corporation |
| Sector: Industrials | |
| SubSector: Aerospace/Defense Products & Services | |
| MarketCap: 287.201 Millions | |
| Recent Price: 36.37 Smart Investing & Trading Score: 70 | |
| Day Percent Change: 3.46% Day Change: 1.19 | |
| Week Change: 8.27% Year-to-date Change: 123.1% | |
| ATRO Links: Profile News Message Board | |
| Charts:- Daily , Weekly | |
| Add ATRO to Watchlist: View: Get Complete ATRO Trend Analysis ➞ | |
 | BWMN Bowman Consulting Group Ltd. |
| Sector: Industrials | |
| SubSector: Engineering & Construction | |
| MarketCap: 443 Millions | |
| Recent Price: 42.73 Smart Investing & Trading Score: 70 | |
| Day Percent Change: 3.37% Day Change: 1.3 | |
| Week Change: 0.89% Year-to-date Change: 59.6% | |
| BWMN Links: Profile News Message Board | |
| Charts:- Daily , Weekly | |
| Add BWMN to Watchlist: View: Get Complete BWMN Trend Analysis ➞ | |
 | TPC Tutor Perini Corporation |
| Sector: Industrials | |
| SubSector: Heavy Construction | |
| MarketCap: 382.595 Millions | |
| Recent Price: 58.94 Smart Investing & Trading Score: 70 | |
| Day Percent Change: 1.84% Day Change: 1.03 | |
| Week Change: -0.4% Year-to-date Change: 135.6% | |
| TPC Links: Profile News Message Board | |
| Charts:- Daily , Weekly | |
| Add TPC to Watchlist: View: Get Complete TPC Trend Analysis ➞ | |
 | ERJ Embraer S.A. |
| Sector: Industrials | |
| SubSector: Aerospace/Defense Products & Services | |
| MarketCap: 1623.71 Millions | |
| Recent Price: 56.33 Smart Investing & Trading Score: 70 | |
| Day Percent Change: 1.11% Day Change: 0.62 | |
| Week Change: -5.85% Year-to-date Change: 53.6% | |
| ERJ Links: Profile News Message Board | |
| Charts:- Daily , Weekly | |
| Add ERJ to Watchlist: View: Get Complete ERJ Trend Analysis ➞ | |
 | NVR NVR, Inc. |
| Sector: Industrials | |
| SubSector: Residential Construction | |
| MarketCap: 9912.56 Millions | |
| Recent Price: 8179.47 Smart Investing & Trading Score: 70 | |
| Day Percent Change: 0.76% Day Change: 61.82 | |
| Week Change: 0.76% Year-to-date Change: 2.0% | |
| NVR Links: Profile News Message Board | |
| Charts:- Daily , Weekly | |
| Add NVR to Watchlist: View: Get Complete NVR Trend Analysis ➞ | |
 | ATI Allegheny Technologies Incorporated |
| Sector: Industrials | |
| SubSector: Metal Fabrication | |
| MarketCap: 913.35 Millions | |
| Recent Price: 77.54 Smart Investing & Trading Score: 70 | |
| Day Percent Change: 0.64% Day Change: 0.46 | |
| Week Change: -3% Year-to-date Change: 30.5% | |
| ATI Links: Profile News Message Board | |
| Charts:- Daily , Weekly | |
| Add ATI to Watchlist: View: Get Complete ATI Trend Analysis ➞ | |
 | SPR Spirit AeroSystems Holdings, Inc. |
| Sector: Industrials | |
| SubSector: Aerospace/Defense Products & Services | |
| MarketCap: 2283.01 Millions | |
| Recent Price: 41.59 Smart Investing & Trading Score: 70 | |
| Day Percent Change: 0.48% Day Change: 0.19 | |
| Week Change: -2.59% Year-to-date Change: 16.9% | |
| SPR Links: Profile News Message Board | |
| Charts:- Daily , Weekly | |
| Add SPR to Watchlist: View: Get Complete SPR Trend Analysis ➞ | |
 | BOOM DMC Global Inc. |
| Sector: Industrials | |
| SubSector: Metal Fabrication | |
| MarketCap: 359.15 Millions | |
| Recent Price: 6.70 Smart Investing & Trading Score: 70 | |
| Day Percent Change: 0.3% Day Change: 0.02 | |
| Week Change: 6.43% Year-to-date Change: -9.9% | |
| BOOM Links: Profile News Message Board | |
| Charts:- Daily , Weekly | |
| Add BOOM to Watchlist: View: Get Complete BOOM Trend Analysis ➞ | |
 | TTC The Toro Company |
| Sector: Industrials | |
| SubSector: Small Tools & Accessories | |
| MarketCap: 6426.96 Millions | |
| Recent Price: 81.06 Smart Investing & Trading Score: 70 | |
| Day Percent Change: -0.05% Day Change: -0.04 | |
| Week Change: -2.64% Year-to-date Change: -4.1% | |
| TTC Links: Profile News Message Board | |
| Charts:- Daily , Weekly | |
| Add TTC to Watchlist: View: Get Complete TTC Trend Analysis ➞ | |
 | SMR NuScale Power Corporation |
| Sector: Industrials | |
| SubSector: Specialty Industrial Machinery | |
| MarketCap: 1510 Millions | |
| Recent Price: 34.65 Smart Investing & Trading Score: 70 | |
| Day Percent Change: -0.89% Day Change: -0.3 | |
| Week Change: -6.79% Year-to-date Change: 86.8% | |
| SMR Links: Profile News Message Board | |
| Charts:- Daily , Weekly | |
| Add SMR to Watchlist: View: Get Complete SMR Trend Analysis ➞ | |
 | TILE Interface, Inc. |
| Sector: Industrials | |
| SubSector: Textile Industrial | |
| MarketCap: 478 Millions | |
| Recent Price: 26.72 Smart Investing & Trading Score: 70 | |
| Day Percent Change: -1.1% Day Change: -0.29 | |
| Week Change: -2.17% Year-to-date Change: 7.5% | |
| TILE Links: Profile News Message Board | |
| Charts:- Daily , Weekly | |
| Add TILE to Watchlist: View: Get Complete TILE Trend Analysis ➞ | |
 | GENC Gencor Industries, Inc. |
| Sector: Industrials | |
| SubSector: Farm & Construction Machinery | |
| MarketCap: 147.607 Millions | |
| Recent Price: 16.26 Smart Investing & Trading Score: 70 | |
| Day Percent Change: -1.2% Day Change: -0.19 | |
| Week Change: 2.36% Year-to-date Change: -11.7% | |
| GENC Links: Profile News Message Board | |
| Charts:- Daily , Weekly | |
| Add GENC to Watchlist: View: Get Complete GENC Trend Analysis ➞ | |
 | HSHP Himalaya Shipping Ltd. |
| Sector: Industrials | |
| SubSector: Marine Shipping | |
| MarketCap: 179 Millions | |
| Recent Price: 7.57 Smart Investing & Trading Score: 66 | |
| Day Percent Change: 1.9% Day Change: 0.14 | |
| Week Change: 1.35% Year-to-date Change: 58.9% | |
| HSHP Links: Profile News Message Board | |
| Charts:- Daily , Weekly | |
| Add HSHP to Watchlist: View: Get Complete HSHP Trend Analysis ➞ | |
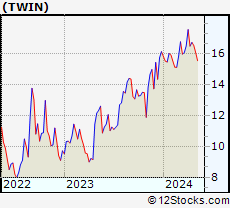 | TWIN Twin Disc, Incorporated |
| Sector: Industrials | |
| SubSector: Diversified Machinery | |
| MarketCap: 120.416 Millions | |
| Recent Price: 12.64 Smart Investing & Trading Score: 60 | |
| Day Percent Change: 30.05% Day Change: 2.59 | |
| Week Change: 25.39% Year-to-date Change: -3.7% | |
| TWIN Links: Profile News Message Board | |
| Charts:- Daily , Weekly | |
| Add TWIN to Watchlist: View: Get Complete TWIN Trend Analysis ➞ | |
 | NVX Novonix Limited |
| Sector: Industrials | |
| SubSector: Electrical Equipment & Parts | |
| MarketCap: 316 Millions | |
| Recent Price: 1.49 Smart Investing & Trading Score: 60 | |
| Day Percent Change: 7.08% Day Change: 0.09 | |
| Week Change: -0.77% Year-to-date Change: -28.6% | |
| NVX Links: Profile News Message Board | |
| Charts:- Daily , Weekly | |
| Add NVX to Watchlist: View: Get Complete NVX Trend Analysis ➞ | |
 | SST System1, Inc. |
| Sector: Industrials | |
| SubSector: Specialty Business Services | |
| MarketCap: 504 Millions | |
| Recent Price: 7.12 Smart Investing & Trading Score: 60 | |
| Day Percent Change: 4.83% Day Change: 0.31 | |
| Week Change: 11.61% Year-to-date Change: -25.1% | |
| SST Links: Profile News Message Board | |
| Charts:- Daily , Weekly | |
| Add SST to Watchlist: View: Get Complete SST Trend Analysis ➞ | |
 | LEGH Legacy Housing Corporation |
| Sector: Industrials | |
| SubSector: Residential Construction | |
| MarketCap: 298.006 Millions | |
| Recent Price: 27.95 Smart Investing & Trading Score: 60 | |
| Day Percent Change: 2.44% Day Change: 0.66 | |
| Week Change: 2.78% Year-to-date Change: 12.3% | |
| LEGH Links: Profile News Message Board | |
| Charts:- Daily , Weekly | |
| Add LEGH to Watchlist: View: Get Complete LEGH Trend Analysis ➞ | |
 | FIX Comfort Systems USA, Inc. |
| Sector: Industrials | |
| SubSector: General Contractors | |
| MarketCap: 1440.63 Millions | |
| Recent Price: 703.38 Smart Investing & Trading Score: 60 | |
| Day Percent Change: 1.9% Day Change: 12.92 | |
| Week Change: 0.6% Year-to-date Change: 64.0% | |
| FIX Links: Profile News Message Board | |
| Charts:- Daily , Weekly | |
| Add FIX to Watchlist: View: Get Complete FIX Trend Analysis ➞ | |
 | PRTH Priority Technology Holdings, Inc. |
| Sector: Industrials | |
| SubSector: Conglomerates | |
| MarketCap: 116.548 Millions | |
| Recent Price: 8.37 Smart Investing & Trading Score: 60 | |
| Day Percent Change: 1.66% Day Change: 0.13 | |
| Week Change: 2.97% Year-to-date Change: -32.1% | |
| PRTH Links: Profile News Message Board | |
| Charts:- Daily , Weekly | |
| Add PRTH to Watchlist: View: Get Complete PRTH Trend Analysis ➞ | |
 | USLM United States Lime & Minerals, Inc. |
| Sector: Industrials | |
| SubSector: General Building Materials | |
| MarketCap: 427.653 Millions | |
| Recent Price: 125.92 Smart Investing & Trading Score: 60 | |
| Day Percent Change: 1.65% Day Change: 1.85 | |
| Week Change: -6% Year-to-date Change: -13.8% | |
| USLM Links: Profile News Message Board | |
| Charts:- Daily , Weekly | |
| Add USLM to Watchlist: View: Get Complete USLM Trend Analysis ➞ | |
 | CMPO CompoSecure, Inc. |
| Sector: Industrials | |
| SubSector: Metal Fabrication | |
| MarketCap: 535 Millions | |
| Recent Price: 19.12 Smart Investing & Trading Score: 60 | |
| Day Percent Change: 1.37% Day Change: 0.26 | |
| Week Change: -0.87% Year-to-date Change: 51.4% | |
| CMPO Links: Profile News Message Board | |
| Charts:- Daily , Weekly | |
| Add CMPO to Watchlist: View: Get Complete CMPO Trend Analysis ➞ | |
 | AGX Argan, Inc. |
| Sector: Industrials | |
| SubSector: Heavy Construction | |
| MarketCap: 664.095 Millions | |
| Recent Price: 228.22 Smart Investing & Trading Score: 60 | |
| Day Percent Change: 1.11% Day Change: 2.4 | |
| Week Change: -2.78% Year-to-date Change: 60.4% | |
| AGX Links: Profile News Message Board | |
| Charts:- Daily , Weekly | |
| Add AGX to Watchlist: View: Get Complete AGX Trend Analysis ➞ | |
 | ROAD Construction Partners, Inc. |
| Sector: Industrials | |
| SubSector: Heavy Construction | |
| MarketCap: 903.095 Millions | |
| Recent Price: 119.90 Smart Investing & Trading Score: 60 | |
| Day Percent Change: 1.05% Day Change: 1.2 | |
| Week Change: 2.98% Year-to-date Change: 31.1% | |
| ROAD Links: Profile News Message Board | |
| Charts:- Daily , Weekly | |
| Add ROAD to Watchlist: View: Get Complete ROAD Trend Analysis ➞ | |
 | PRIM Primoris Services Corporation |
| Sector: Industrials | |
| SubSector: Heavy Construction | |
| MarketCap: 931.895 Millions | |
| Recent Price: 118.55 Smart Investing & Trading Score: 60 | |
| Day Percent Change: 1.01% Day Change: 1.12 | |
| Week Change: 0.52% Year-to-date Change: 46.6% | |
| PRIM Links: Profile News Message Board | |
| Charts:- Daily , Weekly | |
| Add PRIM to Watchlist: View: Get Complete PRIM Trend Analysis ➞ | |
 | TRS TriMas Corporation |
| Sector: Industrials | |
| SubSector: Industrial Equipment & Components | |
| MarketCap: 963.509 Millions | |
| Recent Price: 38.67 Smart Investing & Trading Score: 60 | |
| Day Percent Change: 0.86% Day Change: 0.32 | |
| Week Change: 1.89% Year-to-date Change: 53.9% | |
| TRS Links: Profile News Message Board | |
| Charts:- Daily , Weekly | |
| Add TRS to Watchlist: View: Get Complete TRS Trend Analysis ➞ | |
| For tabular summary view of above stock list: Summary View ➞ 0 - 25 , 25 - 50 , 50 - 75 , 75 - 100 , 100 - 125 , 125 - 150 , 150 - 175 , 175 - 200 , 200 - 225 , 225 - 250 , 250 - 275 , 275 - 300 | ||
| Click To Change The Sort Order: By Market Cap or Company Size Performance: Year-to-date, Week and Day | |
| Select Chart Type: | ||
|
Best Stocks Today 12Stocks.com |
© 2025 12Stocks.com Terms & Conditions Privacy Contact Us
All Information Provided Only For Education And Not To Be Used For Investing or Trading. See Terms & Conditions


One More Thing ... Get Best Stocks Delivered Daily!
Never Ever Miss A Move With Our Top Ten Stocks Lists
Find Best Stocks In Any Market - Bull or Bear Market
Take A Peek At Our Top Ten Stocks Lists: Daily, Weekly, Year-to-Date & Top Trends
Find Best Stocks In Any Market - Bull or Bear Market
Take A Peek At Our Top Ten Stocks Lists: Daily, Weekly, Year-to-Date & Top Trends
Industrial Stocks With Best Up Trends [0-bearish to 100-bullish]: Kanzhun [100], Xometry [100], Cementos Pacasmayo[100], Barnes [100], Hexcel [100], National Energy[100], Montrose Environmental[100], Seaboard [100], CEMEX S.A.B.[100], REX American[100], Eos Energy[100]
Best Industrial Stocks Year-to-Date:
LanzaTech Global[1484.67%], China Yuchai[231.9%], Amprius Technologies[142.5%], Tutor Perini[135.62%], Solid Power[128.57%], Astronics [123.06%], Evolv Technologies[98.23%], American Superconductor[97.28%], NuScale Power[86.78%], Symbotic [85.15%], Elbit Systems[78.5%] Best Industrial Stocks This Week:
LanzaTech Global[5701.71%], Twin Disc[25.39%], National Energy[23.8%], System1 [11.61%], Target Hospitality[10.9%], Kanzhun [10.41%], China Yuchai[8.53%], Astronics [8.27%], Barnes [8.09%], BiomX [7.55%], Cool [6.45%] Best Industrial Stocks Daily:
Twin Disc[30.05%], Bioceres Crop[8.89%], Novonix [7.08%], Kanzhun [6.61%], James Hardie[6.12%], Satellogic [5.65%], Solid Power[4.85%], System1 [4.83%], Xometry [4.58%], BiomX [4.06%], Astronics [3.46%]