
 Login Sign Up


| |||||
 |  | ||||

| 12Stocks.com Market Intelligence |
Best Industrial Stocks
| In a hurry? Industrial Stocks Lists: Performance Trends Table, Stock Charts
Sort Industrial stocks: Daily, Weekly, Year-to-Date, Market Cap & Trends. Filter Industrial stocks list by size:All Industrial Large Mid-Range Small |
| 12Stocks.com Industrial Stocks Performances & Trends Daily | |||||||||
|
|  The overall Smart Investing & Trading Score is 31 (0-bearish to 100-bullish) which puts Industrial sector in short term bearish to neutral trend. The Smart Investing & Trading Score from previous trading session is 26 and hence an improvement of trend.
| ||||||||
Here are the Smart Investing & Trading Scores of the most requested Industrial stocks at 12Stocks.com (click stock name for detailed review):
|


| 12Stocks.com: Investing in Industrial sector with Stocks | |
|
The following table helps investors and traders sort through current performance and trends (as measured by Smart Investing & Trading Score) of various
stocks in the Industrial sector. Quick View: Move mouse or cursor over stock symbol (ticker) to view short-term Technical chart and over stock name to view long term chart. Click on  to add stock symbol to your watchlist and to add stock symbol to your watchlist and  to view watchlist. Click on any ticker or stock name for detailed market intelligence report for that stock. to view watchlist. Click on any ticker or stock name for detailed market intelligence report for that stock. |
12Stocks.com Performance of Stocks in Industrial Sector
| Ticker | Stock Name | Watchlist | Category | Recent Price | Smart Investing & Trading Score | Change % | YTD Change% |
| POWL | Powell Industries |   | Machinery | 123.44 | 36 | -1.56% | 39.64% |
| PCT | PureCycle Technologies | | Pollution & Treatment Controls | 5.13 | 36 | -1.54% | 26.51% |
| BECN | Beacon Roofing | | Building Materials | 93.18 | 36 | -1.53% | 7.08% |
| EMR | Emerson Electric | | Electrical Equipment | 109.81 | 36 | -1.51% | 12.82% |
| LECO | Loln Electric | | Small Tools & Accessories | 236.61 | 36 | -1.21% | 8.81% |
| CMI | Cummins | | Machinery | 291.36 | 36 | -1.09% | 21.62% |
| HII | Huntington Ingalls | | Aerospace/Defense | 271.22 | 36 | -1.01% | 4.46% |
| TRS | TriMas | | Equipment | 25.04 | 36 | -0.67% | -1.14% |
| SRCL | Stericycle | | Waste Mgmt | 48.70 | 36 | -0.45% | -1.74% |
| CAT | Caterpillar | | Machinery | 358.32 | 36 | -0.43% | 21.19% |
| GTLS | Chart Industries | | Fabrication | 147.59 | 36 | -0.38% | 8.26% |
| VMC | Vulcan Materials | | Building Materials | 258.26 | 36 | -0.11% | 13.77% |
| WTTR | Select Energy | | Pollution & Treatment Controls | 8.98 | 36 | -0.11% | 18.31% |
| NPK | National Presto | | Aerospace/Defense | 79.37 | 36 | 0.29% | -1.13% |
| BA | Boeing | | Aerospace/Defense | 170.21 | 35 | -0.20% | -34.70% |
| AZEK | AZEK | | Building Products & Equipment | 45.64 | 33 | -1.21% | 19.32% |
| TKR | Timken | | Machine Tools | 83.83 | 33 | -1.11% | 4.59% |
| GRC | Gorman-Rupp | | Machinery | 36.01 | 33 | -1.04% | 1.35% |
| PHM | Pulte | | Residential | 106.15 | 33 | -0.66% | 2.84% |
| LEN | Lennar | | Residential | 151.88 | 33 | -0.46% | 1.91% |
| GWH | ESS Tech | | Electrical Equipment & Parts | 0.67 | 32 | 0.27% | -41.91% |
| KMT | Kennametal | | Machine Tools | 23.83 | 32 | 0.25% | -7.60% |
| MEC | Mayville Engineering | | Fabrication | 13.39 | 31 | -3.32% | -7.14% |
| RDW | Redwire | | Aerospace & Defense | 3.41 | 31 | -3.13% | 19.65% |
| HLMN | Hillman | | Tools & Accessories | 9.40 | 31 | -2.59% | 1.68% |
| For chart view version of above stock list: Chart View ➞ 0 - 25 , 25 - 50 , 50 - 75 , 75 - 100 , 100 - 125 , 125 - 150 , 150 - 175 , 175 - 200 , 200 - 225 , 225 - 250 , 250 - 275 , 275 - 300 | ||
 | Click To Change The Sort Order: By Market Cap or Company Size Performance: Year-to-date, Week and Day |  |
|
Get the most comprehensive stock market coverage daily at 12Stocks.com ➞ Best Stocks Today ➞ Best Stocks Weekly ➞ Best Stocks Year-to-Date ➞ Best Stocks Trends ➞  Best Stocks Today 12Stocks.com Best Nasdaq Stocks ➞ Best S&P 500 Stocks ➞ Best Tech Stocks ➞ Best Biotech Stocks ➞ |
| Detailed Overview of Industrial Stocks |
| Industrial Technical Overview, Leaders & Laggards, Top Industrial ETF Funds & Detailed Industrial Stocks List, Charts, Trends & More |
| Industrial Sector: Technical Analysis, Trends & YTD Performance | |
| Industrial sector is composed of stocks
from industrial machinery, aerospace, defense, farm/construction
and industrial services subsectors. Industrial sector, as represented by XLI, an exchange-traded fund [ETF] that holds basket of Industrial stocks (e.g, Caterpillar, Boeing) is up by 6.25% and is currently outperforming the overall market by 1.84% year-to-date. Below is a quick view of Technical charts and trends: |
|
 XLI Weekly Chart |
|
| Long Term Trend: Good | |
| Medium Term Trend: Not Good | |
 XLI Daily Chart |
|
| Short Term Trend: Not Good | |
| Overall Trend Score: 31 | |
| YTD Performance: 6.25% | |
| **Trend Scores & Views Are Only For Educational Purposes And Not For Investing | |
| 12Stocks.com: Top Performing Industrial Sector Stocks | ||||||||||||||||||||||||||||||||||||||||||||||||
 The top performing Industrial sector stocks year to date are
Now, more recently, over last week, the top performing Industrial sector stocks on the move are


|
||||||||||||||||||||||||||||||||||||||||||||||||
| 12Stocks.com: Investing in Industrial Sector using Exchange Traded Funds | |
|
The following table shows list of key exchange traded funds (ETF) that
help investors track Industrial Index. For detailed view, check out our ETF Funds section of our website. Quick View: Move mouse or cursor over ETF symbol (ticker) to view short-term Technical chart and over ETF name to view long term chart. Click on ticker or stock name for detailed view. Click on to add stock symbol to your watchlist and to view watchlist. |
12Stocks.com List of ETFs that track Industrial Index
| Ticker | ETF Name | Watchlist | Recent Price | Smart Investing & Trading Score | Change % | Week % | Year-to-date % |
| XLI | Industrial | | 121.11 | 31 | -0.52 | -1.46 | 6.25% |
| UXI | Industrials | | 31.78 | 31 | -2.03 | -3.3 | 10.37% |
| PPA | Aerospace & Defense | | 98.28 | 48 | -0.44 | -0.81 | 6.64% |
| ITA | Aerospace & Defense | | 127.51 | 51 | -0.12 | -0.16 | 0.72% |
| ITB | Home Construction | | 102.93 | 26 | -0.63 | -4.04 | 1.18% |
| XHB | Homebuilders | | 100.78 | 33 | -0.77 | -3.32 | 5.35% |
| SIJ | Short Industrials | | 10.14 | 64 | 1.45 | 3.25 | -10.63% |
| IYJ | Industrials | | 119.77 | 31 | -0.52 | -1.61 | 4.73% |
| EXI | Global Industrials | | 133.82 | 26 | -0.54 | -1.5 | 5.01% |
| VIS | Industrials | | 233.08 | 31 | -0.71 | -1.84 | 5.74% |
| PSCI | SmallCap Industrials | | 118.57 | 26 | -1.01 | -2.23 | 2.25% |
| XAR | Aerospace & Defense | | 132.11 | 43 | -0.83 | -1.22 | -2.44% |
| ARKQ | ARK Industrial Innovation | | 50.36 | 0 | -1.21 | -4.08 | -12.72% |
| 12Stocks.com: Charts, Trends, Fundamental Data and Performances of Industrial Stocks | |
|
We now take in-depth look at all Industrial stocks including charts, multi-period performances and overall trends (as measured by Smart Investing & Trading Score). One can sort Industrial stocks (click link to choose) by Daily, Weekly and by Year-to-Date performances. Also, one can sort by size of the company or by market capitalization. |
| Select Your Default Chart Type: | |||||
| |||||
| Click on stock symbol or name for detailed view. Click on to add stock symbol to your watchlist and to view watchlist. Quick View: Move mouse or cursor over "Daily" to quickly view daily Technical stock chart and over "Weekly" to view weekly Technical stock chart. | |||||

 | POWL Powell Industries, Inc. |
| Sector: Industrials | |
| SubSector: Diversified Machinery | |
| MarketCap: 257.216 Millions | |
| Recent Price: 123.44 Smart Investing & Trading Score: 36 | |
| Day Percent Change: -1.56% Day Change: -1.95 | |
| Week Change: -1.99% Year-to-date Change: 39.6% | |
| POWL Links: Profile News Message Board | |
| Charts:- Daily , Weekly | |
| Add POWL to Watchlist: View: Get Complete POWL Trend Analysis ➞ | |
 | PCT PureCycle Technologies, Inc. |
| Sector: Industrials | |
| SubSector: Pollution & Treatment Controls | |
| MarketCap: 1610 Millions | |
| Recent Price: 5.13 Smart Investing & Trading Score: 36 | |
| Day Percent Change: -1.54% Day Change: -0.08 | |
| Week Change: -9.52% Year-to-date Change: 26.5% | |
| PCT Links: Profile News Message Board | |
| Charts:- Daily , Weekly | |
| Add PCT to Watchlist: View: Get Complete PCT Trend Analysis ➞ | |
 | BECN Beacon Roofing Supply, Inc. |
| Sector: Industrials | |
| SubSector: General Building Materials | |
| MarketCap: 1210.13 Millions | |
| Recent Price: 93.18 Smart Investing & Trading Score: 36 | |
| Day Percent Change: -1.53% Day Change: -1.45 | |
| Week Change: -4.08% Year-to-date Change: 7.1% | |
| BECN Links: Profile News Message Board | |
| Charts:- Daily , Weekly | |
| Add BECN to Watchlist: View: Get Complete BECN Trend Analysis ➞ | |
 | EMR Emerson Electric Co. |
| Sector: Industrials | |
| SubSector: Industrial Electrical Equipment | |
| MarketCap: 30457.9 Millions | |
| Recent Price: 109.81 Smart Investing & Trading Score: 36 | |
| Day Percent Change: -1.51% Day Change: -1.68 | |
| Week Change: -2.52% Year-to-date Change: 12.8% | |
| EMR Links: Profile News Message Board | |
| Charts:- Daily , Weekly | |
| Add EMR to Watchlist: View: Get Complete EMR Trend Analysis ➞ | |
 | LECO Lincoln Electric Holdings, Inc. |
| Sector: Industrials | |
| SubSector: Small Tools & Accessories | |
| MarketCap: 4085.06 Millions | |
| Recent Price: 236.61 Smart Investing & Trading Score: 36 | |
| Day Percent Change: -1.21% Day Change: -2.90 | |
| Week Change: -0.83% Year-to-date Change: 8.8% | |
| LECO Links: Profile News Message Board | |
| Charts:- Daily , Weekly | |
| Add LECO to Watchlist: View: Get Complete LECO Trend Analysis ➞ | |
 | CMI Cummins Inc. |
| Sector: Industrials | |
| SubSector: Diversified Machinery | |
| MarketCap: 19127.1 Millions | |
| Recent Price: 291.36 Smart Investing & Trading Score: 36 | |
| Day Percent Change: -1.09% Day Change: -3.22 | |
| Week Change: -2.43% Year-to-date Change: 21.6% | |
| CMI Links: Profile News Message Board | |
| Charts:- Daily , Weekly | |
| Add CMI to Watchlist: View: Get Complete CMI Trend Analysis ➞ | |
 | HII Huntington Ingalls Industries, Inc. |
| Sector: Industrials | |
| SubSector: Aerospace/Defense Products & Services | |
| MarketCap: 7276.11 Millions | |
| Recent Price: 271.22 Smart Investing & Trading Score: 36 | |
| Day Percent Change: -1.01% Day Change: -2.78 | |
| Week Change: -1.63% Year-to-date Change: 4.5% | |
| HII Links: Profile News Message Board | |
| Charts:- Daily , Weekly | |
| Add HII to Watchlist: View: Get Complete HII Trend Analysis ➞ | |
 | TRS TriMas Corporation |
| Sector: Industrials | |
| SubSector: Industrial Equipment & Components | |
| MarketCap: 963.509 Millions | |
| Recent Price: 25.04 Smart Investing & Trading Score: 36 | |
| Day Percent Change: -0.67% Day Change: -0.17 | |
| Week Change: -1.22% Year-to-date Change: -1.1% | |
| TRS Links: Profile News Message Board | |
| Charts:- Daily , Weekly | |
| Add TRS to Watchlist: View: Get Complete TRS Trend Analysis ➞ | |
 | SRCL Stericycle, Inc. |
| Sector: Industrials | |
| SubSector: Waste Management | |
| MarketCap: 4285.78 Millions | |
| Recent Price: 48.70 Smart Investing & Trading Score: 36 | |
| Day Percent Change: -0.45% Day Change: -0.22 | |
| Week Change: -1.14% Year-to-date Change: -1.7% | |
| SRCL Links: Profile News Message Board | |
| Charts:- Daily , Weekly | |
| Add SRCL to Watchlist: View: Get Complete SRCL Trend Analysis ➞ | |
 | CAT Caterpillar Inc. |
| Sector: Industrials | |
| SubSector: Farm & Construction Machinery | |
| MarketCap: 58636 Millions | |
| Recent Price: 358.32 Smart Investing & Trading Score: 36 | |
| Day Percent Change: -0.43% Day Change: -1.56 | |
| Week Change: -2% Year-to-date Change: 21.2% | |
| CAT Links: Profile News Message Board | |
| Charts:- Daily , Weekly | |
| Add CAT to Watchlist: View: Get Complete CAT Trend Analysis ➞ | |
 | GTLS Chart Industries, Inc. |
| Sector: Industrials | |
| SubSector: Metal Fabrication | |
| MarketCap: 751.15 Millions | |
| Recent Price: 147.59 Smart Investing & Trading Score: 36 | |
| Day Percent Change: -0.38% Day Change: -0.57 | |
| Week Change: -4.35% Year-to-date Change: 8.3% | |
| GTLS Links: Profile News Message Board | |
| Charts:- Daily , Weekly | |
| Add GTLS to Watchlist: View: Get Complete GTLS Trend Analysis ➞ | |
 | VMC Vulcan Materials Company |
| Sector: Industrials | |
| SubSector: General Building Materials | |
| MarketCap: 12304.7 Millions | |
| Recent Price: 258.26 Smart Investing & Trading Score: 36 | |
| Day Percent Change: -0.11% Day Change: -0.28 | |
| Week Change: -1.72% Year-to-date Change: 13.8% | |
| VMC Links: Profile News Message Board | |
| Charts:- Daily , Weekly | |
| Add VMC to Watchlist: View: Get Complete VMC Trend Analysis ➞ | |
 | WTTR Select Energy Services, Inc. |
| Sector: Industrials | |
| SubSector: Pollution & Treatment Controls | |
| MarketCap: 347.075 Millions | |
| Recent Price: 8.98 Smart Investing & Trading Score: 36 | |
| Day Percent Change: -0.11% Day Change: -0.01 | |
| Week Change: -2.39% Year-to-date Change: 18.3% | |
| WTTR Links: Profile News Message Board | |
| Charts:- Daily , Weekly | |
| Add WTTR to Watchlist: View: Get Complete WTTR Trend Analysis ➞ | |
 | NPK National Presto Industries, Inc. |
| Sector: Industrials | |
| SubSector: Aerospace/Defense Products & Services | |
| MarketCap: 540.401 Millions | |
| Recent Price: 79.37 Smart Investing & Trading Score: 36 | |
| Day Percent Change: 0.29% Day Change: 0.23 | |
| Week Change: -0.28% Year-to-date Change: -1.1% | |
| NPK Links: Profile News Message Board | |
| Charts:- Daily , Weekly | |
| Add NPK to Watchlist: View: Get Complete NPK Trend Analysis ➞ | |
 | BA The Boeing Company |
| Sector: Industrials | |
| SubSector: Aerospace/Defense Products & Services | |
| MarketCap: 65336.4 Millions | |
| Recent Price: 170.21 Smart Investing & Trading Score: 35 | |
| Day Percent Change: -0.20% Day Change: -0.34 | |
| Week Change: 0.39% Year-to-date Change: -34.7% | |
| BA Links: Profile News Message Board | |
| Charts:- Daily , Weekly | |
| Add BA to Watchlist: View: Get Complete BA Trend Analysis ➞ | |
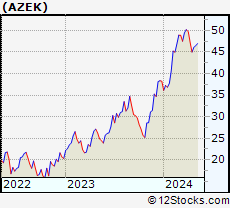 | AZEK The AZEK Company Inc. |
| Sector: Industrials | |
| SubSector: Building Products & Equipment | |
| MarketCap: 55127 Millions | |
| Recent Price: 45.64 Smart Investing & Trading Score: 33 | |
| Day Percent Change: -1.21% Day Change: -0.56 | |
| Week Change: -3.49% Year-to-date Change: 19.3% | |
| AZEK Links: Profile News Message Board | |
| Charts:- Daily , Weekly | |
| Add AZEK to Watchlist: View: Get Complete AZEK Trend Analysis ➞ | |
 | TKR The Timken Company |
| Sector: Industrials | |
| SubSector: Machine Tools & Accessories | |
| MarketCap: 2277.48 Millions | |
| Recent Price: 83.83 Smart Investing & Trading Score: 33 | |
| Day Percent Change: -1.11% Day Change: -0.94 | |
| Week Change: -1.14% Year-to-date Change: 4.6% | |
| TKR Links: Profile News Message Board | |
| Charts:- Daily , Weekly | |
| Add TKR to Watchlist: View: Get Complete TKR Trend Analysis ➞ | |
 | GRC The Gorman-Rupp Company |
| Sector: Industrials | |
| SubSector: Diversified Machinery | |
| MarketCap: 729.616 Millions | |
| Recent Price: 36.01 Smart Investing & Trading Score: 33 | |
| Day Percent Change: -1.04% Day Change: -0.38 | |
| Week Change: -1.83% Year-to-date Change: 1.4% | |
| GRC Links: Profile News Message Board | |
| Charts:- Daily , Weekly | |
| Add GRC to Watchlist: View: Get Complete GRC Trend Analysis ➞ | |
 | PHM PulteGroup, Inc. |
| Sector: Industrials | |
| SubSector: Residential Construction | |
| MarketCap: 6186.46 Millions | |
| Recent Price: 106.15 Smart Investing & Trading Score: 33 | |
| Day Percent Change: -0.66% Day Change: -0.71 | |
| Week Change: -4.27% Year-to-date Change: 2.8% | |
| PHM Links: Profile News Message Board | |
| Charts:- Daily , Weekly | |
| Add PHM to Watchlist: View: Get Complete PHM Trend Analysis ➞ | |
 | LEN Lennar Corporation |
| Sector: Industrials | |
| SubSector: Residential Construction | |
| MarketCap: 11926.6 Millions | |
| Recent Price: 151.88 Smart Investing & Trading Score: 33 | |
| Day Percent Change: -0.46% Day Change: -0.70 | |
| Week Change: -5.02% Year-to-date Change: 1.9% | |
| LEN Links: Profile News Message Board | |
| Charts:- Daily , Weekly | |
| Add LEN to Watchlist: View: Get Complete LEN Trend Analysis ➞ | |
 | GWH ESS Tech, Inc. |
| Sector: Industrials | |
| SubSector: Electrical Equipment & Parts | |
| MarketCap: 239 Millions | |
| Recent Price: 0.67 Smart Investing & Trading Score: 32 | |
| Day Percent Change: 0.27% Day Change: 0.00 | |
| Week Change: -1.25% Year-to-date Change: -41.9% | |
| GWH Links: Profile News Message Board | |
| Charts:- Daily , Weekly | |
| Add GWH to Watchlist: View: Get Complete GWH Trend Analysis ➞ | |
 | KMT Kennametal Inc. |
| Sector: Industrials | |
| SubSector: Machine Tools & Accessories | |
| MarketCap: 1486.48 Millions | |
| Recent Price: 23.83 Smart Investing & Trading Score: 32 | |
| Day Percent Change: 0.25% Day Change: 0.06 | |
| Week Change: 1.4% Year-to-date Change: -7.6% | |
| KMT Links: Profile News Message Board | |
| Charts:- Daily , Weekly | |
| Add KMT to Watchlist: View: Get Complete KMT Trend Analysis ➞ | |
 | MEC Mayville Engineering Company, Inc. |
| Sector: Industrials | |
| SubSector: Metal Fabrication | |
| MarketCap: 143.55 Millions | |
| Recent Price: 13.39 Smart Investing & Trading Score: 31 | |
| Day Percent Change: -3.32% Day Change: -0.46 | |
| Week Change: -1.33% Year-to-date Change: -7.1% | |
| MEC Links: Profile News Message Board | |
| Charts:- Daily , Weekly | |
| Add MEC to Watchlist: View: Get Complete MEC Trend Analysis ➞ | |
 | RDW Redwire Corporation |
| Sector: Industrials | |
| SubSector: Aerospace & Defense | |
| MarketCap: 160 Millions | |
| Recent Price: 3.41 Smart Investing & Trading Score: 31 | |
| Day Percent Change: -3.13% Day Change: -0.11 | |
| Week Change: -11.66% Year-to-date Change: 19.7% | |
| RDW Links: Profile News Message Board | |
| Charts:- Daily , Weekly | |
| Add RDW to Watchlist: View: Get Complete RDW Trend Analysis ➞ | |
 | HLMN Hillman Solutions Corp. |
| Sector: Industrials | |
| SubSector: Tools & Accessories | |
| MarketCap: 1720 Millions | |
| Recent Price: 9.40 Smart Investing & Trading Score: 31 | |
| Day Percent Change: -2.59% Day Change: -0.25 | |
| Week Change: -4.47% Year-to-date Change: 1.7% | |
| HLMN Links: Profile News Message Board | |
| Charts:- Daily , Weekly | |
| Add HLMN to Watchlist: View: Get Complete HLMN Trend Analysis ➞ | |
| For tabular summary view of above stock list: Summary View ➞ 0 - 25 , 25 - 50 , 50 - 75 , 75 - 100 , 100 - 125 , 125 - 150 , 150 - 175 , 175 - 200 , 200 - 225 , 225 - 250 , 250 - 275 , 275 - 300 | ||
| Click To Change The Sort Order: By Market Cap or Company Size Performance: Year-to-date, Week and Day | |
| Select Chart Type: | ||
|
Best Stocks Today 12Stocks.com |
© 2024 12Stocks.com Terms & Conditions Privacy Contact Us
All Information Provided Only For Education And Not To Be Used For Investing or Trading. See Terms & Conditions


One More Thing ... Get Best Stocks Delivered Daily!
Never Ever Miss A Move With Our Top Ten Stocks Lists
Find Best Stocks In Any Market - Bull or Bear Market
Take A Peek At Our Top Ten Stocks Lists: Daily, Weekly, Year-to-Date & Top Trends
Find Best Stocks In Any Market - Bull or Bear Market
Take A Peek At Our Top Ten Stocks Lists: Daily, Weekly, Year-to-Date & Top Trends
Industrial Stocks With Best Up Trends [0-bearish to 100-bullish]: HEICO [100], ADS-TEC Energy[90], Argan [88], Lockheed Martin[86], Caesarstone [83], AAR [83], Sun Country[78], Himalaya Shipping[76], Carpenter Technology[76], Masonite [75], L.S. Starrett[75]
Best Industrial Stocks Year-to-Date:
Tritium DCFC[1593.07%], Intuitive Machines[107.41%], Kaman [91.52%], FTAI Infrastructure[68.12%], EMCOR [57.45%], Masonite [55.15%], NuScale Power[52.87%], ADS-TEC Energy[50.14%], Graham [48.76%], TDCX [48.18%], Caesarstone [47.86%] Best Industrial Stocks This Week:
TPI Composites[4.98%], HEICO [3.02%], NET Power[2.96%], ADS-TEC Energy[2.93%], Caesarstone [2.79%], Alpha Pro[2.68%], Frontier [2.53%], EHang [2.49%], Twin Disc[2.24%], Shengfeng Development[2.22%], Sun Country[2.17%] Best Industrial Stocks Daily:
Lilium N.V[6.60%], Frontier [6.00%], EHang [5.81%], Vertical Aerospace[5.23%], REX American[4.57%], Tritium DCFC[4.18%], NET Power[3.88%], Sun Country[2.97%], Terran Orbital[2.84%], Symbotic [2.67%], Amprius Technologies[2.37%]