
 Login Sign Up


| |||||
 |  | ||||

| 12Stocks.com Market Intelligence |
Best Industrial Stocks
| In a hurry? Industrial Stocks Lists: Performance Trends Table, Stock Charts
Sort Industrial stocks: Daily, Weekly, Year-to-Date, Market Cap & Trends. Filter Industrial stocks list by size:All Industrial Large Mid-Range Small |
| 12Stocks.com Industrial Stocks Performances & Trends Daily | |||||||||
|
|  The overall Smart Investing & Trading Score is 63 (0-bearish to 100-bullish) which puts Industrial sector in short term neutral to bullish trend. The Smart Investing & Trading Score from previous trading session is 56 and an improvement of trend continues.
| ||||||||
Here are the Smart Investing & Trading Scores of the most requested Industrial stocks at 12Stocks.com (click stock name for detailed review):
|


| 12Stocks.com: Investing in Industrial sector with Stocks | |
|
The following table helps investors and traders sort through current performance and trends (as measured by Smart Investing & Trading Score) of various
stocks in the Industrial sector. Quick View: Move mouse or cursor over stock symbol (ticker) to view short-term Technical chart and over stock name to view long term chart. Click on  to add stock symbol to your watchlist and to add stock symbol to your watchlist and  to view watchlist. Click on any ticker or stock name for detailed market intelligence report for that stock. to view watchlist. Click on any ticker or stock name for detailed market intelligence report for that stock. |
12Stocks.com Performance of Stocks in Industrial Sector
| Ticker | Stock Name | Watchlist | Category | Recent Price | Smart Investing & Trading Score | Change % | YTD Change% |
| MIR | Mirion Technologies |   | Specialty Industrial Machinery | 11.06 | 88 | -1.07% | 7.80% |
| RGR | Sturm Ruger | | Aerospace/Defense | 46.59 | 88 | -0.65% | 2.50% |
| TRS | TriMas | | Equipment | 26.13 | 88 | -0.48% | 3.14% |
| TDG | TransDigm | | Aerospace/Defense | 1226.72 | 85 | -1.26% | 21.27% |
| ASPN | Aspen Aerogels | | Building Materials | 16.50 | 85 | -0.75% | 4.59% |
| OSIS | OSI Systems | | Electrical Equipment | 140.58 | 85 | -0.17% | 8.93% |
| MEC | Mayville Engineering | | Fabrication | 13.70 | 83 | -0.87% | -4.99% |
| CWST | Casella Waste | | Waste Mgmt | 94.89 | 83 | -0.57% | 11.03% |
| RSG | Republic Services | | Waste Mgmt | 191.13 | 83 | 0.27% | 15.90% |
| EML | Eastern | | Small Tools & Accessories | 31.64 | 83 | -1.17% | 43.80% |
| USLM | United States | | Building Materials | 301.00 | 83 | -1.08% | 30.67% |
| AOS | A. O. | | Electrical Equipment | 87.13 | 83 | -0.90% | 5.69% |
| FELE | Franklin Electric | | Electrical Equipment | 103.09 | 83 | -0.51% | 6.66% |
| BZ | Kanzhun | | Staffing & Employment | 18.98 | 81 | 1.01% | 14.83% |
| OC | Owens Corning | | Building Materials | 162.85 | 80 | -2.85% | 9.86% |
| TPH | TRI Pointe | | Residential | 36.45 | 80 | -0.59% | 2.95% |
| PHM | Pulte | | Residential | 112.46 | 80 | -0.27% | 8.95% |
| LUNR | Intuitive Machines | | Aerospace & Defense | 5.38 | 76 | -2.18% | 121.60% |
| B | Barnes | | Equipment | 35.78 | 76 | -1.32% | 9.65% |
| WTS | Watts Water | | Equipment | 204.71 | 76 | -0.92% | -1.74% |
| IESC | IES | | Contractors | 130.21 | 75 | 2.01% | 64.37% |
| SMR | NuScale Power | | Specialty Industrial Machinery | 5.55 | 75 | 1.28% | 72.09% |
| ETN | Eaton | | Machinery | 316.66 | 75 | 1.22% | 31.49% |
| AAON | AAON | | Building Materials | 89.26 | 75 | 0.79% | 20.83% |
| BV | BrightView | | Contractors | 11.57 | 75 | 0.43% | 37.41% |
| For chart view version of above stock list: Chart View ➞ 0 - 25 , 25 - 50 , 50 - 75 , 75 - 100 , 100 - 125 , 125 - 150 , 150 - 175 , 175 - 200 , 200 - 225 , 225 - 250 , 250 - 275 , 275 - 300 | ||
 | Click To Change The Sort Order: By Market Cap or Company Size Performance: Year-to-date, Week and Day |  |
|
Get the most comprehensive stock market coverage daily at 12Stocks.com ➞ Best Stocks Today ➞ Best Stocks Weekly ➞ Best Stocks Year-to-Date ➞ Best Stocks Trends ➞  Best Stocks Today 12Stocks.com Best Nasdaq Stocks ➞ Best S&P 500 Stocks ➞ Best Tech Stocks ➞ Best Biotech Stocks ➞ |
| Detailed Overview of Industrial Stocks |
| Industrial Technical Overview, Leaders & Laggards, Top Industrial ETF Funds & Detailed Industrial Stocks List, Charts, Trends & More |
| Industrial Sector: Technical Analysis, Trends & YTD Performance | |
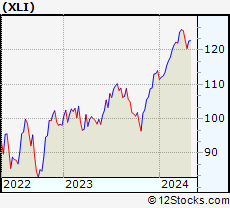
| Industrial sector is composed of stocks
from industrial machinery, aerospace, defense, farm/construction
and industrial services subsectors. Industrial sector, as represented by XLI, an exchange-traded fund [ETF] that holds basket of Industrial stocks (e.g, Caterpillar, Boeing) is up by 6.68% and is currently outperforming the overall market by 1.34% year-to-date. Below is a quick view of Technical charts and trends: |
|
 XLI Weekly Chart |
|
| Long Term Trend: Very Good | |
| Medium Term Trend: Not Good | |
 XLI Daily Chart |
|
| Short Term Trend: Very Good | |
| Overall Trend Score: 63 | |
| YTD Performance: 6.68% | |
| **Trend Scores & Views Are Only For Educational Purposes And Not For Investing | |
| 12Stocks.com: Top Performing Industrial Sector Stocks | ||||||||||||||||||||||||||||||||||||||||||||||||
 The top performing Industrial sector stocks year to date are
Now, more recently, over last week, the top performing Industrial sector stocks on the move are


|
||||||||||||||||||||||||||||||||||||||||||||||||
| 12Stocks.com: Investing in Industrial Sector using Exchange Traded Funds | |
|
The following table shows list of key exchange traded funds (ETF) that
help investors track Industrial Index. For detailed view, check out our ETF Funds section of our website. Quick View: Move mouse or cursor over ETF symbol (ticker) to view short-term Technical chart and over ETF name to view long term chart. Click on ticker or stock name for detailed view. Click on to add stock symbol to your watchlist and to view watchlist. |
12Stocks.com List of ETFs that track Industrial Index
| Ticker | ETF Name | Watchlist | Recent Price | Smart Investing & Trading Score | Change % | Week % | Year-to-date % |
| XLI | Industrial | | 121.61 | 63 | -1.19 | 0.95 | 6.68% |
| UXI | Industrials | | 32.88 | 68 | -0.18 | 4.21 | 14.19% |
| PPA | Aerospace & Defense | | 99.41 | 70 | -1.04 | 1.12 | 7.87% |
| ITA | Aerospace & Defense | | 128.54 | 70 | -0.64 | 0.42 | 1.53% |
| ITB | Home Construction | | 104.82 | 58 | -1.11 | 2.4 | 3.04% |
| XHB | Homebuilders | | 102.58 | 58 | -1.00 | 2.42 | 7.23% |
| SIJ | Short Industrials | | 9.96 | 32 | 1.22 | -2.67 | -12.17% |
| 12Stocks.com: Charts, Trends, Fundamental Data and Performances of Industrial Stocks | |
|
We now take in-depth look at all Industrial stocks including charts, multi-period performances and overall trends (as measured by Smart Investing & Trading Score). One can sort Industrial stocks (click link to choose) by Daily, Weekly and by Year-to-Date performances. Also, one can sort by size of the company or by market capitalization. |
| Select Your Default Chart Type: | |||||
| |||||
| Click on stock symbol or name for detailed view. Click on to add stock symbol to your watchlist and to view watchlist. Quick View: Move mouse or cursor over "Daily" to quickly view daily Technical stock chart and over "Weekly" to view weekly Technical stock chart. | |||||

 | MIR Mirion Technologies, Inc. |
| Sector: Industrials | |
| SubSector: Specialty Industrial Machinery | |
| MarketCap: 1920 Millions | |
| Recent Price: 11.06 Smart Investing & Trading Score: 88 | |
| Day Percent Change: -1.07% Day Change: -0.12 | |
| Week Change: 0.73% Year-to-date Change: 7.8% | |
| MIR Links: Profile News Message Board | |
| Charts:- Daily , Weekly | |
| Add MIR to Watchlist: View: Get Complete MIR Trend Analysis ➞ | |
 | RGR Sturm, Ruger & Company, Inc. |
| Sector: Industrials | |
| SubSector: Aerospace/Defense Products & Services | |
| MarketCap: 752 Millions | |
| Recent Price: 46.59 Smart Investing & Trading Score: 88 | |
| Day Percent Change: -0.65% Day Change: -0.30 | |
| Week Change: -0.35% Year-to-date Change: 2.5% | |
| RGR Links: Profile News Message Board | |
| Charts:- Daily , Weekly | |
| Add RGR to Watchlist: View: Get Complete RGR Trend Analysis ➞ | |
 | TRS TriMas Corporation |
| Sector: Industrials | |
| SubSector: Industrial Equipment & Components | |
| MarketCap: 963.509 Millions | |
| Recent Price: 26.13 Smart Investing & Trading Score: 88 | |
| Day Percent Change: -0.48% Day Change: -0.13 | |
| Week Change: 0.25% Year-to-date Change: 3.1% | |
| TRS Links: Profile News Message Board | |
| Charts:- Daily , Weekly | |
| Add TRS to Watchlist: View: Get Complete TRS Trend Analysis ➞ | |
 | TDG TransDigm Group Incorporated |
| Sector: Industrials | |
| SubSector: Aerospace/Defense Products & Services | |
| MarketCap: 18441 Millions | |
| Recent Price: 1226.72 Smart Investing & Trading Score: 85 | |
| Day Percent Change: -1.26% Day Change: -15.68 | |
| Week Change: 3.29% Year-to-date Change: 21.3% | |
| TDG Links: Profile News Message Board | |
| Charts:- Daily , Weekly | |
| Add TDG to Watchlist: View: Get Complete TDG Trend Analysis ➞ | |
 | ASPN Aspen Aerogels, Inc. |
| Sector: Industrials | |
| SubSector: General Building Materials | |
| MarketCap: 150.153 Millions | |
| Recent Price: 16.50 Smart Investing & Trading Score: 85 | |
| Day Percent Change: -0.75% Day Change: -0.13 | |
| Week Change: 10.33% Year-to-date Change: 4.6% | |
| ASPN Links: Profile News Message Board | |
| Charts:- Daily , Weekly | |
| Add ASPN to Watchlist: View: Get Complete ASPN Trend Analysis ➞ | |
 | OSIS OSI Systems, Inc. |
| Sector: Industrials | |
| SubSector: Industrial Electrical Equipment | |
| MarketCap: 1100.39 Millions | |
| Recent Price: 140.58 Smart Investing & Trading Score: 85 | |
| Day Percent Change: -0.17% Day Change: -0.24 | |
| Week Change: 3.72% Year-to-date Change: 8.9% | |
| OSIS Links: Profile News Message Board | |
| Charts:- Daily , Weekly | |
| Add OSIS to Watchlist: View: Get Complete OSIS Trend Analysis ➞ | |
 | MEC Mayville Engineering Company, Inc. |
| Sector: Industrials | |
| SubSector: Metal Fabrication | |
| MarketCap: 143.55 Millions | |
| Recent Price: 13.70 Smart Investing & Trading Score: 83 | |
| Day Percent Change: -0.87% Day Change: -0.12 | |
| Week Change: -1.3% Year-to-date Change: -5.0% | |
| MEC Links: Profile News Message Board | |
| Charts:- Daily , Weekly | |
| Add MEC to Watchlist: View: Get Complete MEC Trend Analysis ➞ | |
 | CWST Casella Waste Systems, Inc. |
| Sector: Industrials | |
| SubSector: Waste Management | |
| MarketCap: 2093.38 Millions | |
| Recent Price: 94.89 Smart Investing & Trading Score: 83 | |
| Day Percent Change: -0.57% Day Change: -0.54 | |
| Week Change: 1.56% Year-to-date Change: 11.0% | |
| CWST Links: Profile News Message Board | |
| Charts:- Daily , Weekly | |
| Add CWST to Watchlist: View: Get Complete CWST Trend Analysis ➞ | |
 | RSG Republic Services, Inc. |
| Sector: Industrials | |
| SubSector: Waste Management | |
| MarketCap: 26178.6 Millions | |
| Recent Price: 191.13 Smart Investing & Trading Score: 83 | |
| Day Percent Change: 0.27% Day Change: 0.52 | |
| Week Change: 0.72% Year-to-date Change: 15.9% | |
| RSG Links: Profile News Message Board | |
| Charts:- Daily , Weekly | |
| Add RSG to Watchlist: View: Get Complete RSG Trend Analysis ➞ | |
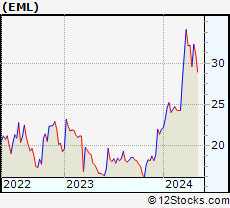 | EML The Eastern Company |
| Sector: Industrials | |
| SubSector: Small Tools & Accessories | |
| MarketCap: 140.356 Millions | |
| Recent Price: 31.64 Smart Investing & Trading Score: 83 | |
| Day Percent Change: -1.17% Day Change: -0.37 | |
| Week Change: 6.88% Year-to-date Change: 43.8% | |
| EML Links: Profile News Message Board | |
| Charts:- Daily , Weekly | |
| Add EML to Watchlist: View: Get Complete EML Trend Analysis ➞ | |
 | USLM United States Lime & Minerals, Inc. |
| Sector: Industrials | |
| SubSector: General Building Materials | |
| MarketCap: 427.653 Millions | |
| Recent Price: 301.00 Smart Investing & Trading Score: 83 | |
| Day Percent Change: -1.08% Day Change: -3.28 | |
| Week Change: 1.43% Year-to-date Change: 30.7% | |
| USLM Links: Profile News Message Board | |
| Charts:- Daily , Weekly | |
| Add USLM to Watchlist: View: Get Complete USLM Trend Analysis ➞ | |
 | AOS A. O. Smith Corporation |
| Sector: Industrials | |
| SubSector: Industrial Electrical Equipment | |
| MarketCap: 5809.89 Millions | |
| Recent Price: 87.13 Smart Investing & Trading Score: 83 | |
| Day Percent Change: -0.90% Day Change: -0.79 | |
| Week Change: 1.23% Year-to-date Change: 5.7% | |
| AOS Links: Profile News Message Board | |
| Charts:- Daily , Weekly | |
| Add AOS to Watchlist: View: Get Complete AOS Trend Analysis ➞ | |
 | FELE Franklin Electric Co., Inc. |
| Sector: Industrials | |
| SubSector: Industrial Electrical Equipment | |
| MarketCap: 2397.89 Millions | |
| Recent Price: 103.09 Smart Investing & Trading Score: 83 | |
| Day Percent Change: -0.51% Day Change: -0.53 | |
| Week Change: 1.63% Year-to-date Change: 6.7% | |
| FELE Links: Profile News Message Board | |
| Charts:- Daily , Weekly | |
| Add FELE to Watchlist: View: Get Complete FELE Trend Analysis ➞ | |
 | BZ Kanzhun Limited |
| Sector: Industrials | |
| SubSector: Staffing & Employment Services | |
| MarketCap: 6680 Millions | |
| Recent Price: 18.98 Smart Investing & Trading Score: 81 | |
| Day Percent Change: 1.01% Day Change: 0.19 | |
| Week Change: 6.36% Year-to-date Change: 14.8% | |
| BZ Links: Profile News Message Board | |
| Charts:- Daily , Weekly | |
| Add BZ to Watchlist: View: Get Complete BZ Trend Analysis ➞ | |
 | OC Owens Corning |
| Sector: Industrials | |
| SubSector: General Building Materials | |
| MarketCap: 3686.73 Millions | |
| Recent Price: 162.85 Smart Investing & Trading Score: 80 | |
| Day Percent Change: -2.85% Day Change: -4.77 | |
| Week Change: 1.71% Year-to-date Change: 9.9% | |
| OC Links: Profile News Message Board | |
| Charts:- Daily , Weekly | |
| Add OC to Watchlist: View: Get Complete OC Trend Analysis ➞ | |
 | TPH TRI Pointe Group, Inc. |
| Sector: Industrials | |
| SubSector: Residential Construction | |
| MarketCap: 1140.06 Millions | |
| Recent Price: 36.45 Smart Investing & Trading Score: 80 | |
| Day Percent Change: -0.59% Day Change: -0.21 | |
| Week Change: 4.34% Year-to-date Change: 3.0% | |
| TPH Links: Profile News Message Board | |
| Charts:- Daily , Weekly | |
| Add TPH to Watchlist: View: Get Complete TPH Trend Analysis ➞ | |
 | PHM PulteGroup, Inc. |
| Sector: Industrials | |
| SubSector: Residential Construction | |
| MarketCap: 6186.46 Millions | |
| Recent Price: 112.46 Smart Investing & Trading Score: 80 | |
| Day Percent Change: -0.27% Day Change: -0.30 | |
| Week Change: 6.67% Year-to-date Change: 9.0% | |
| PHM Links: Profile News Message Board | |
| Charts:- Daily , Weekly | |
| Add PHM to Watchlist: View: Get Complete PHM Trend Analysis ➞ | |
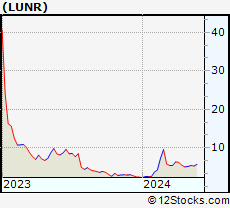 | LUNR Intuitive Machines, Inc. |
| Sector: Industrials | |
| SubSector: Aerospace & Defense | |
| MarketCap: 714 Millions | |
| Recent Price: 5.38 Smart Investing & Trading Score: 76 | |
| Day Percent Change: -2.18% Day Change: -0.12 | |
| Week Change: 3.56% Year-to-date Change: 121.6% | |
| LUNR Links: Profile News Message Board | |
| Charts:- Daily , Weekly | |
| Add LUNR to Watchlist: View: Get Complete LUNR Trend Analysis ➞ | |
 | B Barnes Group Inc. |
| Sector: Industrials | |
| SubSector: Industrial Equipment & Components | |
| MarketCap: 2189.79 Millions | |
| Recent Price: 35.78 Smart Investing & Trading Score: 76 | |
| Day Percent Change: -1.32% Day Change: -0.48 | |
| Week Change: 0.06% Year-to-date Change: 9.7% | |
| B Links: Profile News Message Board | |
| Charts:- Daily , Weekly | |
| Add B to Watchlist: View: Get Complete B Trend Analysis ➞ | |
 | WTS Watts Water Technologies, Inc. |
| Sector: Industrials | |
| SubSector: Industrial Equipment & Components | |
| MarketCap: 2903.29 Millions | |
| Recent Price: 204.71 Smart Investing & Trading Score: 76 | |
| Day Percent Change: -0.92% Day Change: -1.91 | |
| Week Change: 0.74% Year-to-date Change: -1.7% | |
| WTS Links: Profile News Message Board | |
| Charts:- Daily , Weekly | |
| Add WTS to Watchlist: View: Get Complete WTS Trend Analysis ➞ | |
 | IESC IES Holdings, Inc. |
| Sector: Industrials | |
| SubSector: General Contractors | |
| MarketCap: 380.963 Millions | |
| Recent Price: 130.21 Smart Investing & Trading Score: 75 | |
| Day Percent Change: 2.01% Day Change: 2.56 | |
| Week Change: 12.73% Year-to-date Change: 64.4% | |
| IESC Links: Profile News Message Board | |
| Charts:- Daily , Weekly | |
| Add IESC to Watchlist: View: Get Complete IESC Trend Analysis ➞ | |
 | SMR NuScale Power Corporation |
| Sector: Industrials | |
| SubSector: Specialty Industrial Machinery | |
| MarketCap: 1510 Millions | |
| Recent Price: 5.55 Smart Investing & Trading Score: 75 | |
| Day Percent Change: 1.28% Day Change: 0.07 | |
| Week Change: 14.43% Year-to-date Change: 72.1% | |
| SMR Links: Profile News Message Board | |
| Charts:- Daily , Weekly | |
| Add SMR to Watchlist: View: Get Complete SMR Trend Analysis ➞ | |
 | ETN Eaton Corporation plc |
| Sector: Industrials | |
| SubSector: Diversified Machinery | |
| MarketCap: 29829.4 Millions | |
| Recent Price: 316.66 Smart Investing & Trading Score: 75 | |
| Day Percent Change: 1.22% Day Change: 3.82 | |
| Week Change: 4.5% Year-to-date Change: 31.5% | |
| ETN Links: Profile News Message Board | |
| Charts:- Daily , Weekly | |
| Add ETN to Watchlist: View: Get Complete ETN Trend Analysis ➞ | |
 | AAON AAON, Inc. |
| Sector: Industrials | |
| SubSector: General Building Materials | |
| MarketCap: 2533.63 Millions | |
| Recent Price: 89.26 Smart Investing & Trading Score: 75 | |
| Day Percent Change: 0.79% Day Change: 0.70 | |
| Week Change: 4.51% Year-to-date Change: 20.8% | |
| AAON Links: Profile News Message Board | |
| Charts:- Daily , Weekly | |
| Add AAON to Watchlist: View: Get Complete AAON Trend Analysis ➞ | |
 | BV BrightView Holdings, Inc. |
| Sector: Industrials | |
| SubSector: General Contractors | |
| MarketCap: 973.763 Millions | |
| Recent Price: 11.57 Smart Investing & Trading Score: 75 | |
| Day Percent Change: 0.43% Day Change: 0.05 | |
| Week Change: 4.61% Year-to-date Change: 37.4% | |
| BV Links: Profile News Message Board | |
| Charts:- Daily , Weekly | |
| Add BV to Watchlist: View: Get Complete BV Trend Analysis ➞ | |
| For tabular summary view of above stock list: Summary View ➞ 0 - 25 , 25 - 50 , 50 - 75 , 75 - 100 , 100 - 125 , 125 - 150 , 150 - 175 , 175 - 200 , 200 - 225 , 225 - 250 , 250 - 275 , 275 - 300 | ||
| Click To Change The Sort Order: By Market Cap or Company Size Performance: Year-to-date, Week and Day | |
| Select Chart Type: | ||
|
Best Stocks Today 12Stocks.com |
© 2024 12Stocks.com Terms & Conditions Privacy Contact Us
All Information Provided Only For Education And Not To Be Used For Investing or Trading. See Terms & Conditions


One More Thing ... Get Best Stocks Delivered Daily!
Never Ever Miss A Move With Our Top Ten Stocks Lists
Find Best Stocks In Any Market - Bull or Bear Market
Take A Peek At Our Top Ten Stocks Lists: Daily, Weekly, Year-to-Date & Top Trends
Find Best Stocks In Any Market - Bull or Bear Market
Take A Peek At Our Top Ten Stocks Lists: Daily, Weekly, Year-to-Date & Top Trends
Industrial Stocks With Best Up Trends [0-bearish to 100-bullish]: Mueller Industries[100], Crane Co[100], Generac [100], Mueller Water[100], AAR [100], AeroVironment [100], Northrop Grumman[100], HEICO [100], CSW s[100], Hillenbrand [100], AZZ [100]
Best Industrial Stocks Year-to-Date:
Intuitive Machines[121.6%], FTAI Infrastructure[91.65%], Caesarstone [80.21%], NuScale Power[72.09%], Powell Industries[70.4%], IES [64.37%], EMCOR [58.22%], Masonite [55.34%], Graham [52.55%], Tutor Perini[51.54%], Comfort Systems[51.31%] Best Industrial Stocks This Week:
Caesarstone [18.45%], Powell Industries[15.57%], NuScale Power[14.43%], ZIM Integrated[13.72%], Mueller Industries[13.28%], BiomX [13.18%], IES [12.73%], FTAI Infrastructure[11.77%], Vertical Aerospace[11.53%], Aspen Aerogels[10.33%], Crane Co[9.97%] Best Industrial Stocks Daily:
Novonix [5.52%], Powell Industries[5.05%], MingZhu Logistics[4.18%], Caesarstone [4.17%], Satellogic [4.17%], Mueller Industries[3.11%], Crane Co[3.10%], Freightos [2.71%], Ambipar Emergency[2.61%], EHang [2.28%], Hertz Global[2.11%]