
 Login Sign Up


| |||||
 |  | ||||

| 12Stocks.com Market Intelligence |
Best Industrial Stocks
| In a hurry? Industrial Stocks Lists: Performance Trends Table, Stock Charts
Sort Industrial stocks: Daily, Weekly, Year-to-Date, Market Cap & Trends. Filter Industrial stocks list by size:All Industrial Large Mid-Range Small |
| 12Stocks.com Industrial Stocks Performances & Trends Daily | |||||||||
|
|  The overall Smart Investing & Trading Score is 70 (0-bearish to 100-bullish) which puts Industrial sector in short term neutral to bullish trend. The Smart Investing & Trading Score from previous trading session is 60 and an improvement of trend continues.
| ||||||||
Here are the Smart Investing & Trading Scores of the most requested Industrial stocks at 12Stocks.com (click stock name for detailed review):
|


| 12Stocks.com: Investing in Industrial sector with Stocks | |
|
The following table helps investors and traders sort through current performance and trends (as measured by Smart Investing & Trading Score) of various
stocks in the Industrial sector. Quick View: Move mouse or cursor over stock symbol (ticker) to view short-term Technical chart and over stock name to view long term chart. Click on  to add stock symbol to your watchlist and to add stock symbol to your watchlist and  to view watchlist. Click on any ticker or stock name for detailed market intelligence report for that stock. to view watchlist. Click on any ticker or stock name for detailed market intelligence report for that stock. |
12Stocks.com Performance of Stocks in Industrial Sector
| Ticker | Stock Name | Watchlist | Category | Recent Price | Smart Investing & Trading Score | Change % | YTD Change% |
| GASS | StealthGas |   | Marine Shipping | 7.29 | 30 | -0.14 | 21.70% |
| RSG | Republic Services | | Waste Mgmt | 228.14 | 30 | -0.15 | 14.56% |
| ESP | Espey | | Electrical Equipment & Parts | 52.46 | 100 | -0.15 | 81.42% |
| DGI | DigitalGlobe | | Aerospace/Defense | 52.96 | 10 | -0.15 | 0.00% |
| TKR | Timken Co | | Tools & Accessories | 77.38 | 70 | -0.17 | 11.79% |
| BMCH | BMC Stock | | Building Materials | 5.53 | 10 | -0.18 | 0.00% |
| AME | Ametek | | Specialty Industrial Machinery | 189.56 | 60 | -0.19 | 6.67% |
| ACA | Arcosa | | Engineering & Construction | 95.02 | 30 | -0.20 | -1.53% |
| KNX | Knight-Swift Transportation | | Trucking | 41.60 | 10 | -0.22 | -20.50% |
| MAS | Masco Corp | | Building Products & Equipment | 73.46 | 60 | -0.23 | 3.96% |
| OA | Orbital ATK | | Aerospace/Defense | 96.73 | 80 | -0.23 | 0.00% |
| NOC | Northrop Grumman | | Aerospace & Defense | 574.54 | 30 | -0.25 | 23.90% |
| WAB | Westinghouse Air | | Railroads | 188.34 | 0 | -0.25 | -0.08% |
| ACCO | Acco Brands | | Equipment & Supplies | 4.00 | 70 | -0.25 | -20.04% |
| PBI | Pitney Bowes | | Integrated Freight & Logistics | 11.38 | 30 | -0.26 | 60.84% |
| GENC | Gencor Industries | | Farm & Heavy Construction Machinery | 15.24 | 20 | -0.26 | -9.98% |
| PNR | Pentair | | Specialty Industrial Machinery | 110.65 | 60 | -0.27 | 11.08% |
| LZ | LegalZoom.com | | Specialty | 10.53 | 60 | -0.28 | 39.29% |
| WCN | Waste Connections | | Waste Mgmt | 175.57 | 10 | -0.28 | 3.86% |
| ULBI | Ultralife Corp | | Electrical Equipment & Parts | 6.83 | 40 | -0.29 | -7.58% |
| DE | Deere & Co | | Farm & Heavy Construction Machinery | 469.11 | 0 | -0.30 | 12.93% |
| MIDD | Middleby Corp | | Specialty Industrial Machinery | 134.19 | 0 | -0.30 | 0.19% |
| PCAR | Paccar | | Farm & Heavy Construction Machinery | 102.17 | 80 | -0.33 | -0.56% |
| LLL | L3 Technologies | | Aerospace/Defense | 16.91 | 70 | -0.35 | 0.00% |
| RBA | RB Global | | Specialty | 116.74 | 60 | -0.35 | 29.97% |
| For chart view version of above stock list: Chart View ➞ 0 - 25 , 25 - 50 , 50 - 75 , 75 - 100 , 100 - 125 , 125 - 150 , 150 - 175 , 175 - 200 , 200 - 225 , 225 - 250 , 250 - 275 , 275 - 300 , 300 - 325 , 325 - 350 , 350 - 375 , 375 - 400 , 400 - 425 , 425 - 450 , 450 - 475 , 475 - 500 , 500 - 525 | ||
 | Click To Change The Sort Order: By Market Cap or Company Size Performance: Year-to-date, Week and Day |  |
|
Get the most comprehensive stock market coverage daily at 12Stocks.com ➞ Best Stocks Today ➞ Best Stocks Weekly ➞ Best Stocks Year-to-Date ➞ Best Stocks Trends ➞  Best Stocks Today 12Stocks.com Best Nasdaq Stocks ➞ Best S&P 500 Stocks ➞ Best Tech Stocks ➞ Best Biotech Stocks ➞ |
| Detailed Overview of Industrial Stocks |
| Industrial Technical Overview, Leaders & Laggards, Top Industrial ETF Funds & Detailed Industrial Stocks List, Charts, Trends & More |
| Industrial Sector: Technical Analysis, Trends & YTD Performance | |
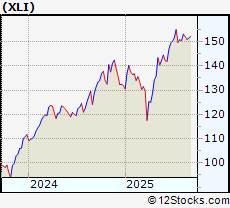
| Industrial sector is composed of stocks
from industrial machinery, aerospace, defense, farm/construction
and industrial services subsectors. Industrial sector, as represented by XLI, an exchange-traded fund [ETF] that holds basket of Industrial stocks (e.g, Caterpillar, Boeing) is up by 16.6888% and is currently outperforming the overall market by 3.288% year-to-date. Below is a quick view of Technical charts and trends: |
|
 XLI Weekly Chart |
|
| Long Term Trend: Good | |
| Medium Term Trend: Good | |
 XLI Daily Chart |
|
| Short Term Trend: Very Good | |
| Overall Trend Score: 70 | |
| YTD Performance: 16.6888% | |
| **Trend Scores & Views Are Only For Educational Purposes And Not For Investing | |
| 12Stocks.com: Top Performing Industrial Sector Stocks | ||||||||||||||||||||||||||||||||||||||||||||||||
 The top performing Industrial sector stocks year to date are
Now, more recently, over last week, the top performing Industrial sector stocks on the move are


|
||||||||||||||||||||||||||||||||||||||||||||||||
| 12Stocks.com: Investing in Industrial Sector using Exchange Traded Funds | |
|
The following table shows list of key exchange traded funds (ETF) that
help investors track Industrial Index. For detailed view, check out our ETF Funds section of our website. Quick View: Move mouse or cursor over ETF symbol (ticker) to view short-term Technical chart and over ETF name to view long term chart. Click on ticker or stock name for detailed view. Click on to add stock symbol to your watchlist and to view watchlist. |
12Stocks.com List of ETFs that track Industrial Index
| Ticker | ETF Name | Watchlist | Recent Price | Smart Investing & Trading Score | Change % | Week % | Year-to-date % |
| CHII | China Industrials | | 9.80 | 20 | 0 | -0.0509944 | 0% |
| 12Stocks.com: Charts, Trends, Fundamental Data and Performances of Industrial Stocks | |
|
We now take in-depth look at all Industrial stocks including charts, multi-period performances and overall trends (as measured by Smart Investing & Trading Score). One can sort Industrial stocks (click link to choose) by Daily, Weekly and by Year-to-Date performances. Also, one can sort by size of the company or by market capitalization. |
| Select Your Default Chart Type: | |||||
| |||||
| Click on stock symbol or name for detailed view. Click on to add stock symbol to your watchlist and to view watchlist. Quick View: Move mouse or cursor over "Daily" to quickly view daily Technical stock chart and over "Weekly" to view weekly Technical stock chart. | |||||

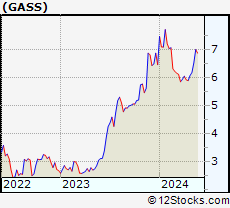 | GASS StealthGas Inc |
| Sector: Industrials | |
| SubSector: Marine Shipping | |
| MarketCap: 274.75 Millions | |
| Recent Price: 7.29 Smart Investing & Trading Score: 30 | |
| Day Percent Change: -0.136986% Day Change: 0.19 | |
| Week Change: -1.88425% Year-to-date Change: 21.7% | |
| GASS Links: Profile News Message Board | |
| Charts:- Daily , Weekly | |
| Add GASS to Watchlist: View: Get Complete GASS Trend Analysis ➞ | |
 | RSG Republic Services, Inc |
| Sector: Industrials | |
| SubSector: Waste Management | |
| MarketCap: 71725.3 Millions | |
| Recent Price: 228.14 Smart Investing & Trading Score: 30 | |
| Day Percent Change: -0.14881% Day Change: -0.46 | |
| Week Change: -0.692117% Year-to-date Change: 14.6% | |
| RSG Links: Profile News Message Board | |
| Charts:- Daily , Weekly | |
| Add RSG to Watchlist: View: Get Complete RSG Trend Analysis ➞ | |
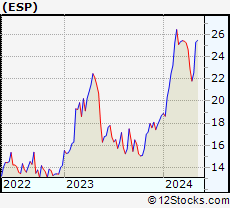 | ESP Espey Manufacturing & Electronics Corp |
| Sector: Industrials | |
| SubSector: Electrical Equipment & Parts | |
| MarketCap: 141.91 Millions | |
| Recent Price: 52.46 Smart Investing & Trading Score: 100 | |
| Day Percent Change: -0.152265% Day Change: 0.56 | |
| Week Change: 4.6688% Year-to-date Change: 81.4% | |
| ESP Links: Profile News Message Board | |
| Charts:- Daily , Weekly | |
| Add ESP to Watchlist: View: Get Complete ESP Trend Analysis ➞ | |
 | DGI DigitalGlobe, Inc. |
| Sector: Industrials | |
| SubSector: Aerospace/Defense Products & Services | |
| MarketCap: 1969.98 Millions | |
| Recent Price: 52.96 Smart Investing & Trading Score: 10 | |
| Day Percent Change: -0.15083% Day Change: -9999 | |
| Week Change: -42.9802% Year-to-date Change: 0.0% | |
| DGI Links: Profile News Message Board | |
| Charts:- Daily , Weekly | |
| Add DGI to Watchlist: View: Get Complete DGI Trend Analysis ➞ | |
 | TKR Timken Co |
| Sector: Industrials | |
| SubSector: Tools & Accessories | |
| MarketCap: 5416.83 Millions | |
| Recent Price: 77.38 Smart Investing & Trading Score: 70 | |
| Day Percent Change: -0.16772% Day Change: -0.19 | |
| Week Change: -0.514271% Year-to-date Change: 11.8% | |
| TKR Links: Profile News Message Board | |
| Charts:- Daily , Weekly | |
| Add TKR to Watchlist: View: Get Complete TKR Trend Analysis ➞ | |
 | BMCH BMC Stock Holdings, Inc. |
| Sector: Industrials | |
| SubSector: General Building Materials | |
| MarketCap: 1216.93 Millions | |
| Recent Price: 5.53 Smart Investing & Trading Score: 10 | |
| Day Percent Change: -0.180505% Day Change: -9999 | |
| Week Change: -20.7736% Year-to-date Change: 0.0% | |
| BMCH Links: Profile News Message Board | |
| Charts:- Daily , Weekly | |
| Add BMCH to Watchlist: View: Get Complete BMCH Trend Analysis ➞ | |
 | AME Ametek Inc |
| Sector: Industrials | |
| SubSector: Specialty Industrial Machinery | |
| MarketCap: 43292.3 Millions | |
| Recent Price: 189.56 Smart Investing & Trading Score: 60 | |
| Day Percent Change: -0.194809% Day Change: 0.12 | |
| Week Change: 1.12563% Year-to-date Change: 6.7% | |
| AME Links: Profile News Message Board | |
| Charts:- Daily , Weekly | |
| Add AME to Watchlist: View: Get Complete AME Trend Analysis ➞ | |
 | ACA Arcosa Inc |
| Sector: Industrials | |
| SubSector: Engineering & Construction | |
| MarketCap: 4788.74 Millions | |
| Recent Price: 95.02 Smart Investing & Trading Score: 30 | |
| Day Percent Change: -0.199559% Day Change: -0.37 | |
| Week Change: -2.68333% Year-to-date Change: -1.5% | |
| ACA Links: Profile News Message Board | |
| Charts:- Daily , Weekly | |
| Add ACA to Watchlist: View: Get Complete ACA Trend Analysis ➞ | |
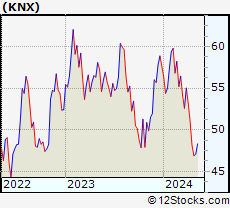 | KNX Knight-Swift Transportation Holdings Inc |
| Sector: Industrials | |
| SubSector: Trucking | |
| MarketCap: 6996.84 Millions | |
| Recent Price: 41.60 Smart Investing & Trading Score: 10 | |
| Day Percent Change: -0.215879% Day Change: -0.21 | |
| Week Change: -3.50267% Year-to-date Change: -20.5% | |
| KNX Links: Profile News Message Board | |
| Charts:- Daily , Weekly | |
| Add KNX to Watchlist: View: Get Complete KNX Trend Analysis ➞ | |
 | MAS Masco Corp |
| Sector: Industrials | |
| SubSector: Building Products & Equipment | |
| MarketCap: 15926.3 Millions | |
| Recent Price: 73.46 Smart Investing & Trading Score: 60 | |
| Day Percent Change: -0.230884% Day Change: -0.19 | |
| Week Change: -3.43105% Year-to-date Change: 4.0% | |
| MAS Links: Profile News Message Board | |
| Charts:- Daily , Weekly | |
| Add MAS to Watchlist: View: Get Complete MAS Trend Analysis ➞ | |
 | OA Orbital ATK, Inc. |
| Sector: Industrials | |
| SubSector: Aerospace/Defense Products & Services | |
| MarketCap: 5933.38 Millions | |
| Recent Price: 96.73 Smart Investing & Trading Score: 80 | |
| Day Percent Change: -0.226921% Day Change: -9999 | |
| Week Change: 5.1756% Year-to-date Change: 0.0% | |
| OA Links: Profile News Message Board | |
| Charts:- Daily , Weekly | |
| Add OA to Watchlist: View: Get Complete OA Trend Analysis ➞ | |
 | NOC Northrop Grumman Corp |
| Sector: Industrials | |
| SubSector: Aerospace & Defense | |
| MarketCap: 83160.7 Millions | |
| Recent Price: 574.54 Smart Investing & Trading Score: 30 | |
| Day Percent Change: -0.246545% Day Change: -1.43 | |
| Week Change: -1.07782% Year-to-date Change: 23.9% | |
| NOC Links: Profile News Message Board | |
| Charts:- Daily , Weekly | |
| Add NOC to Watchlist: View: Get Complete NOC Trend Analysis ➞ | |
 | WAB Westinghouse Air Brake Technologies Corp |
| Sector: Industrials | |
| SubSector: Railroads | |
| MarketCap: 33024.7 Millions | |
| Recent Price: 188.34 Smart Investing & Trading Score: 0 | |
| Day Percent Change: -0.25421% Day Change: 0.23 | |
| Week Change: -2.50544% Year-to-date Change: -0.1% | |
| WAB Links: Profile News Message Board | |
| Charts:- Daily , Weekly | |
| Add WAB to Watchlist: View: Get Complete WAB Trend Analysis ➞ | |
 | ACCO Acco Brands Corporation |
| Sector: Industrials | |
| SubSector: Business Equipment & Supplies | |
| MarketCap: 364.14 Millions | |
| Recent Price: 4.00 Smart Investing & Trading Score: 70 | |
| Day Percent Change: -0.249377% Day Change: 0.04 | |
| Week Change: -0.990099% Year-to-date Change: -20.0% | |
| ACCO Links: Profile News Message Board | |
| Charts:- Daily , Weekly | |
| Add ACCO to Watchlist: View: Get Complete ACCO Trend Analysis ➞ | |
 | PBI Pitney Bowes, Inc |
| Sector: Industrials | |
| SubSector: Integrated Freight & Logistics | |
| MarketCap: 2113.67 Millions | |
| Recent Price: 11.38 Smart Investing & Trading Score: 30 | |
| Day Percent Change: -0.262927% Day Change: -0.04 | |
| Week Change: -7.32899% Year-to-date Change: 60.8% | |
| PBI Links: Profile News Message Board | |
| Charts:- Daily , Weekly | |
| Add PBI to Watchlist: View: Get Complete PBI Trend Analysis ➞ | |
 | GENC Gencor Industries, Inc |
| Sector: Industrials | |
| SubSector: Farm & Heavy Construction Machinery | |
| MarketCap: 236.58 Millions | |
| Recent Price: 15.24 Smart Investing & Trading Score: 20 | |
| Day Percent Change: -0.26178% Day Change: -0.19 | |
| Week Change: -5.57621% Year-to-date Change: -10.0% | |
| GENC Links: Profile News Message Board | |
| Charts:- Daily , Weekly | |
| Add GENC to Watchlist: View: Get Complete GENC Trend Analysis ➞ | |
 | PNR Pentair plc |
| Sector: Industrials | |
| SubSector: Specialty Industrial Machinery | |
| MarketCap: 18137.3 Millions | |
| Recent Price: 110.65 Smart Investing & Trading Score: 60 | |
| Day Percent Change: -0.270392% Day Change: -0.07 | |
| Week Change: 0.00903832% Year-to-date Change: 11.1% | |
| PNR Links: Profile News Message Board | |
| Charts:- Daily , Weekly | |
| Add PNR to Watchlist: View: Get Complete PNR Trend Analysis ➞ | |
 | LZ LegalZoom.com Inc |
| Sector: Industrials | |
| SubSector: Specialty Business Services | |
| MarketCap: 1860.17 Millions | |
| Recent Price: 10.53 Smart Investing & Trading Score: 60 | |
| Day Percent Change: -0.284091% Day Change: 0.16 | |
| Week Change: 2.03488% Year-to-date Change: 39.3% | |
| LZ Links: Profile News Message Board | |
| Charts:- Daily , Weekly | |
| Add LZ to Watchlist: View: Get Complete LZ Trend Analysis ➞ | |
 | WCN Waste Connections Inc |
| Sector: Industrials | |
| SubSector: Waste Management | |
| MarketCap: 46164.4 Millions | |
| Recent Price: 175.57 Smart Investing & Trading Score: 10 | |
| Day Percent Change: -0.283978% Day Change: 0.68 | |
| Week Change: -2.08031% Year-to-date Change: 3.9% | |
| WCN Links: Profile News Message Board | |
| Charts:- Daily , Weekly | |
| Add WCN to Watchlist: View: Get Complete WCN Trend Analysis ➞ | |
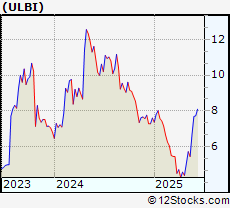 | ULBI Ultralife Corp |
| Sector: Industrials | |
| SubSector: Electrical Equipment & Parts | |
| MarketCap: 118.5 Millions | |
| Recent Price: 6.83 Smart Investing & Trading Score: 40 | |
| Day Percent Change: -0.291971% Day Change: 0.06 | |
| Week Change: -4.07303% Year-to-date Change: -7.6% | |
| ULBI Links: Profile News Message Board | |
| Charts:- Daily , Weekly | |
| Add ULBI to Watchlist: View: Get Complete ULBI Trend Analysis ➞ | |
 | DE Deere & Co |
| Sector: Industrials | |
| SubSector: Farm & Heavy Construction Machinery | |
| MarketCap: 127936 Millions | |
| Recent Price: 469.11 Smart Investing & Trading Score: 0 | |
| Day Percent Change: -0.297549% Day Change: -2.1 | |
| Week Change: -0.876896% Year-to-date Change: 12.9% | |
| DE Links: Profile News Message Board | |
| Charts:- Daily , Weekly | |
| Add DE to Watchlist: View: Get Complete DE Trend Analysis ➞ | |
 | MIDD Middleby Corp |
| Sector: Industrials | |
| SubSector: Specialty Industrial Machinery | |
| MarketCap: 7320.06 Millions | |
| Recent Price: 134.19 Smart Investing & Trading Score: 0 | |
| Day Percent Change: -0.297199% Day Change: -0.63 | |
| Week Change: -7.08994% Year-to-date Change: 0.2% | |
| MIDD Links: Profile News Message Board | |
| Charts:- Daily , Weekly | |
| Add MIDD to Watchlist: View: Get Complete MIDD Trend Analysis ➞ | |
 | PCAR Paccar Inc |
| Sector: Industrials | |
| SubSector: Farm & Heavy Construction Machinery | |
| MarketCap: 52011.5 Millions | |
| Recent Price: 102.17 Smart Investing & Trading Score: 80 | |
| Day Percent Change: -0.331675% Day Change: 0.07 | |
| Week Change: 3.14992% Year-to-date Change: -0.6% | |
| PCAR Links: Profile News Message Board | |
| Charts:- Daily , Weekly | |
| Add PCAR to Watchlist: View: Get Complete PCAR Trend Analysis ➞ | |
 | LLL L3 Technologies, Inc. |
| Sector: Industrials | |
| SubSector: Aerospace/Defense Products & Services | |
| MarketCap: 13215.6 Millions | |
| Recent Price: 16.91 Smart Investing & Trading Score: 70 | |
| Day Percent Change: -0.353565% Day Change: -9999 | |
| Week Change: 1915.25% Year-to-date Change: 0.0% | |
| LLL Links: Profile News Message Board | |
| Charts:- Daily , Weekly | |
| Add LLL to Watchlist: View: Get Complete LLL Trend Analysis ➞ | |
 | RBA RB Global Inc |
| Sector: Industrials | |
| SubSector: Specialty Business Services | |
| MarketCap: 21353.3 Millions | |
| Recent Price: 116.74 Smart Investing & Trading Score: 60 | |
| Day Percent Change: -0.349979% Day Change: -0.1 | |
| Week Change: 1.46893% Year-to-date Change: 30.0% | |
| RBA Links: Profile News Message Board | |
| Charts:- Daily , Weekly | |
| Add RBA to Watchlist: View: Get Complete RBA Trend Analysis ➞ | |
| For tabular summary view of above stock list: Summary View ➞ 0 - 25 , 25 - 50 , 50 - 75 , 75 - 100 , 100 - 125 , 125 - 150 , 150 - 175 , 175 - 200 , 200 - 225 , 225 - 250 , 250 - 275 , 275 - 300 , 300 - 325 , 325 - 350 , 350 - 375 , 375 - 400 , 400 - 425 , 425 - 450 , 450 - 475 , 475 - 500 , 500 - 525 | ||
| Click To Change The Sort Order: By Market Cap or Company Size Performance: Year-to-date, Week and Day | |
| Select Chart Type: | ||
|
Best Stocks Today 12Stocks.com |
© 2025 12Stocks.com Terms & Conditions Privacy Contact Us
All Information Provided Only For Education And Not To Be Used For Investing or Trading. See Terms & Conditions


One More Thing ... Get Best Stocks Delivered Daily!
Never Ever Miss A Move With Our Top Ten Stocks Lists
Find Best Stocks In Any Market - Bull or Bear Market
Take A Peek At Our Top Ten Stocks Lists: Daily, Weekly, Year-to-Date & Top Trends
Find Best Stocks In Any Market - Bull or Bear Market
Take A Peek At Our Top Ten Stocks Lists: Daily, Weekly, Year-to-Date & Top Trends
Industrial Stocks With Best Up Trends [0-bearish to 100-bullish]: Brooge [100], Babcock & Wilcox Enterprises[100], Radiant Logistics[100], Ameresco [100], Ardmore Shipping[100], TAT Technologies[100], Powell Industries[100], Ballard Power[100], NAPCO Security[100], Comfort Systems[100], PICO [100]
Best Industrial Stocks Year-to-Date:
Triumph [1388.91%], GrafTech [509.884%], Tecogen [486.452%], Power [226.805%], Lightbridge Corp[205.49%], Bloom Energy[186.778%], ESGL [170.593%], Kratos Defense[168.158%], Tutor Perini[165.811%], Willdan [162.049%], Astronics Corp[153.325%] Best Industrial Stocks This Week:
TRC [10149.1%], Advanced Emissions[3571.78%], L3 Technologies[1915.25%], Forterra [1845.47%], KLX [437.488%], Allegro Merger[402.182%], LMI Aerospace[291.621%], Chicago Bridge[205.472%], Covanta Holding[148.617%], MOOG [148.377%], Altra [103.372%] Best Industrial Stocks Daily:
Brooge [29.5547%], Enovix [12.285%], Lightbridge Corp[11.5247%], Tecogen [10.989%], B/E Aerospace[8.86381%], Symbotic [7.62304%], NuScale Power[7.56742%], Zim Integrated[7.26339%], Babcock & Wilcox Enterprises[6.11511%], Radiant Logistics[5.52147%], Graham Corp[5.27823%]