
 Login Sign Up


| |||||
 |  | ||||

| 12Stocks.com Market Intelligence |
Best Industrial Stocks
| In a hurry? Industrial Stocks Lists: Performance Trends Table, Stock Charts
Sort Industrial stocks: Daily, Weekly, Year-to-Date, Market Cap & Trends. Filter Industrial stocks list by size:All Industrial Large Mid-Range Small |
| 12Stocks.com Industrial Stocks Performances & Trends Daily | |||||||||
|
|  The overall Smart Investing & Trading Score is 50 (0-bearish to 100-bullish) which puts Industrial sector in short term neutral trend. The Smart Investing & Trading Score from previous trading session is 50 and an improvement of trend continues.
| ||||||||
Here are the Smart Investing & Trading Scores of the most requested Industrial stocks at 12Stocks.com (click stock name for detailed review):
|

| 12Stocks.com: Investing in Industrial sector with Stocks | |
|
The following table helps investors and traders sort through current performance and trends (as measured by Smart Investing & Trading Score) of various
stocks in the Industrial sector. Quick View: Move mouse or cursor over stock symbol (ticker) to view short-term Technical chart and over stock name to view long term chart. Click on  to add stock symbol to your watchlist and to add stock symbol to your watchlist and  to view watchlist. Click on any ticker or stock name for detailed market intelligence report for that stock. to view watchlist. Click on any ticker or stock name for detailed market intelligence report for that stock. |
12Stocks.com Performance of Stocks in Industrial Sector
| Ticker | Stock Name | Watchlist | Category | Recent Price | Smart Investing & Trading Score | Change % | YTD Change% |
| THR | Thermon |   | Specialty Industrial Machinery | 25.56 | 10 | -3.00% | -10.32% |
| NX | Quanex Building | | Building Products & Equipment | 18.18 | 10 | -13.06% | -22.07% |
| BLVD | Boulevard Acquisition | | Conglomerates | 66.86 | 70 | 0.30% | 0.00% |
| HRT | HireRight | | Staffing & Employment | 14.36 | 30 | 0.00% | 0.00% |
| WBT | Welbilt | | Machinery | 24.01 | 20 | 0.00% | 0.00% |
| GLDD | Great Lakes | | Engineering & Construction | 11.73 | 20 | 0.51% | 0.60% |
| FPAC | Far Point | | Conglomerates | 10.21 | 30 | 0.00% | 0.00% |
| NPK | National Presto | | Aerospace & Defense | 109.39 | 90 | 0.57% | 14.37% |
| BRSS | Global Brass | | Fabrication | 42.97 | 30 | 2.02% | 0.00% |
| ERII | Energy Recovery | | Pollution & Treatment Controls | 14.42 | 90 | 0.77% | -3.16% |
| MATW | Matthews | | Conglomerates | 24.90 | 70 | 0.04% | -4.84% |
| GNK | Genco Shipping | | Marine Shipping | 17.80 | 100 | 2.24% | 26.20% |
| RYI | Ryerson Holding | | Fabrication | 23.50 | 100 | 2.40% | 34.18% |
| IIIN | Insteel Industries | | Fabrication | 38.88 | 80 | -0.13% | 48.52% |
| TRNS | Transcat | | Specialty | 78.18 | 20 | 0.68% | -26.29% |
| KE | Kimball Electronics | | Electrical Equipment & Parts | 29.90 | 90 | 0.47% | 62.59% |
| VLRS | Controladora Vuela | | Airlines | 6.15 | 70 | 0.65% | -16.89% |
| BWMN | Bowman Consulting | | Engineering & Construction | 40.79 | 50 | -2.86% | 63.49% |
| SNCY | Sun Country | | Airlines | 13.17 | 60 | 1.62% | -9.36% |
| KRNT | Kornit Digital | | Specialty Industrial Machinery | 15.33 | 60 | 4.21% | -50.15% |
| BXC | Bluelinx Hldgs | | Industrial Distribution | 86.16 | 100 | 1.64% | -13.72% |
| ULH | Universal Logistics | | Trucking | 25.55 | 70 | 1.63% | -41.12% |
| HOLI | Hollysys Automation | | Electrical Equipment | 31.23 | 100 | 0.71% | 0.00% |
| HY | Hyster Yale | | Farm & Heavy Construction Machinery | 37.70 | 60 | 1.56% | -23.80% |
| CCX | Churchill Capital | | Conglomerates | 122.00 | 20 | 0.99% | 0.00% |
| For chart view version of above stock list: Chart View ➞ 0 - 25 , 25 - 50 , 50 - 75 , 75 - 100 , 100 - 125 , 125 - 150 , 150 - 175 , 175 - 200 , 200 - 225 , 225 - 250 , 250 - 275 , 275 - 300 , 300 - 325 , 325 - 350 , 350 - 375 , 375 - 400 , 400 - 425 , 425 - 450 , 450 - 475 , 475 - 500 , 500 - 525 | ||
 | Click To Change The Sort Order: By Market Cap or Company Size Performance: Year-to-date, Week and Day |  |
|
Get the most comprehensive stock market coverage daily at 12Stocks.com ➞ Best Stocks Today ➞ Best Stocks Weekly ➞ Best Stocks Year-to-Date ➞ Best Stocks Trends ➞  Best Stocks Today 12Stocks.com Best Nasdaq Stocks ➞ Best S&P 500 Stocks ➞ Best Tech Stocks ➞ Best Biotech Stocks ➞ |
| Detailed Overview of Industrial Stocks |
| Industrial Technical Overview, Leaders & Laggards, Top Industrial ETF Funds & Detailed Industrial Stocks List, Charts, Trends & More |
| Industrial Sector: Technical Analysis, Trends & YTD Performance | |
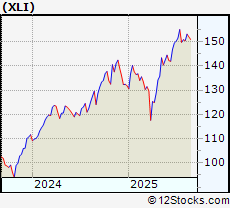
| Industrial sector is composed of stocks
from industrial machinery, aerospace, defense, farm/construction
and industrial services subsectors. Industrial sector, as represented by XLI, an exchange-traded fund [ETF] that holds basket of Industrial stocks (e.g, Caterpillar, Boeing) is up by 15.6543% and is currently outperforming the overall market by 4.4597% year-to-date. Below is a quick view of Technical charts and trends: |
|
 XLI Weekly Chart |
|
| Long Term Trend: Good | |
| Medium Term Trend: Good | |
 XLI Daily Chart |
|
| Short Term Trend: Good | |
| Overall Trend Score: 50 | |
| YTD Performance: 15.6543% | |
| **Trend Scores & Views Are Only For Educational Purposes And Not For Investing | |
| 12Stocks.com: Top Performing Industrial Sector Stocks | ||||||||||||||||||||||||||||||||||||||||||||||||
 The top performing Industrial sector stocks year to date are
Now, more recently, over last week, the top performing Industrial sector stocks on the move are


|
||||||||||||||||||||||||||||||||||||||||||||||||
| 12Stocks.com: Investing in Industrial Sector using Exchange Traded Funds | |
|
The following table shows list of key exchange traded funds (ETF) that
help investors track Industrial Index. For detailed view, check out our ETF Funds section of our website. Quick View: Move mouse or cursor over ETF symbol (ticker) to view short-term Technical chart and over ETF name to view long term chart. Click on ticker or stock name for detailed view. Click on to add stock symbol to your watchlist and to view watchlist. |
12Stocks.com List of ETFs that track Industrial Index
| Ticker | ETF Name | Watchlist | Recent Price | Smart Investing & Trading Score | Change % | Week % | Year-to-date % |
| CHII | China Industrials | | 9.80 | 20 | 0 | -0.0509944 | 0% |
| 12Stocks.com: Charts, Trends, Fundamental Data and Performances of Industrial Stocks | |
|
We now take in-depth look at all Industrial stocks including charts, multi-period performances and overall trends (as measured by Smart Investing & Trading Score). One can sort Industrial stocks (click link to choose) by Daily, Weekly and by Year-to-Date performances. Also, one can sort by size of the company or by market capitalization. |
| Select Your Default Chart Type: | |||||
| |||||
| Click on stock symbol or name for detailed view. Click on to add stock symbol to your watchlist and to view watchlist. Quick View: Move mouse or cursor over "Daily" to quickly view daily Technical stock chart and over "Weekly" to view weekly Technical stock chart. | |||||

 | THR Thermon Group Holdings Inc |
| Sector: Industrials | |
| SubSector: Specialty Industrial Machinery | |
| MarketCap: 845.14 Millions | |
| Recent Price: 25.56 Smart Investing & Trading Score: 10 | |
| Day Percent Change: -2.9981% Day Change: 0.02 | |
| Week Change: -4.80447% Year-to-date Change: -10.3% | |
| THR Links: Profile News Message Board | |
| Charts:- Daily , Weekly | |
| Add THR to Watchlist: View: Get Complete THR Trend Analysis ➞ | |
 | NX Quanex Building Products Corp |
| Sector: Industrials | |
| SubSector: Building Products & Equipment | |
| MarketCap: 835.79 Millions | |
| Recent Price: 18.18 Smart Investing & Trading Score: 10 | |
| Day Percent Change: -13.056% Day Change: -0.13 | |
| Week Change: -17.0242% Year-to-date Change: -22.1% | |
| NX Links: Profile News Message Board | |
| Charts:- Daily , Weekly | |
| Add NX to Watchlist: View: Get Complete NX Trend Analysis ➞ | |
 | BLVD Boulevard Acquisition Corp. II |
| Sector: Industrials | |
| SubSector: Conglomerates | |
| MarketCap: 823.58 Millions | |
| Recent Price: 66.86 Smart Investing & Trading Score: 70 | |
| Day Percent Change: 0.30003% Day Change: -9999 | |
| Week Change: 24.2058% Year-to-date Change: 0.0% | |
| BLVD Links: Profile News Message Board | |
| Charts:- Daily , Weekly | |
| Add BLVD to Watchlist: View: Get Complete BLVD Trend Analysis ➞ | |
 | HRT HireRight Holdings Corporation |
| Sector: Industrials | |
| SubSector: Staffing & Employment Services | |
| MarketCap: 823 Millions | |
| Recent Price: 14.36 Smart Investing & Trading Score: 30 | |
| Day Percent Change: 0% Day Change: -9999 | |
| Week Change: 0.13947% Year-to-date Change: 0.0% | |
| HRT Links: Profile News Message Board | |
| Charts:- Daily , Weekly | |
| Add HRT to Watchlist: View: Get Complete HRT Trend Analysis ➞ | |
 | WBT Welbilt, Inc. |
| Sector: Industrials | |
| SubSector: Diversified Machinery | |
| MarketCap: 799.116 Millions | |
| Recent Price: 24.01 Smart Investing & Trading Score: 20 | |
| Day Percent Change: 0% Day Change: -9999 | |
| Week Change: 0% Year-to-date Change: 0.0% | |
| WBT Links: Profile News Message Board | |
| Charts:- Daily , Weekly | |
| Add WBT to Watchlist: View: Get Complete WBT Trend Analysis ➞ | |
 | GLDD Great Lakes Dredge & Dock Corporation |
| Sector: Industrials | |
| SubSector: Engineering & Construction | |
| MarketCap: 797.58 Millions | |
| Recent Price: 11.73 Smart Investing & Trading Score: 20 | |
| Day Percent Change: 0.514139% Day Change: 0.04 | |
| Week Change: -1.26263% Year-to-date Change: 0.6% | |
| GLDD Links: Profile News Message Board | |
| Charts:- Daily , Weekly | |
| Add GLDD to Watchlist: View: Get Complete GLDD Trend Analysis ➞ | |
 | FPAC Far Point Acquisition Corporation |
| Sector: Industrials | |
| SubSector: Conglomerates | |
| MarketCap: 793.348 Millions | |
| Recent Price: 10.21 Smart Investing & Trading Score: 30 | |
| Day Percent Change: 0% Day Change: -9999 | |
| Week Change: 0% Year-to-date Change: 0.0% | |
| FPAC Links: Profile News Message Board | |
| Charts:- Daily , Weekly | |
| Add FPAC to Watchlist: View: Get Complete FPAC Trend Analysis ➞ | |
 | NPK National Presto Industries, Inc |
| Sector: Industrials | |
| SubSector: Aerospace & Defense | |
| MarketCap: 782.09 Millions | |
| Recent Price: 109.39 Smart Investing & Trading Score: 90 | |
| Day Percent Change: 0.57001% Day Change: 1.36 | |
| Week Change: 2.03339% Year-to-date Change: 14.4% | |
| NPK Links: Profile News Message Board | |
| Charts:- Daily , Weekly | |
| Add NPK to Watchlist: View: Get Complete NPK Trend Analysis ➞ | |
 | BRSS Global Brass and Copper Holdings, Inc. |
| Sector: Industrials | |
| SubSector: Metal Fabrication | |
| MarketCap: 774.64 Millions | |
| Recent Price: 42.97 Smart Investing & Trading Score: 30 | |
| Day Percent Change: 2.01804% Day Change: -9999 | |
| Week Change: -30.2208% Year-to-date Change: 0.0% | |
| BRSS Links: Profile News Message Board | |
| Charts:- Daily , Weekly | |
| Add BRSS to Watchlist: View: Get Complete BRSS Trend Analysis ➞ | |
 | ERII Energy Recovery Inc |
| Sector: Industrials | |
| SubSector: Pollution & Treatment Controls | |
| MarketCap: 767.12 Millions | |
| Recent Price: 14.42 Smart Investing & Trading Score: 90 | |
| Day Percent Change: 0.768693% Day Change: -0.15 | |
| Week Change: -1.02951% Year-to-date Change: -3.2% | |
| ERII Links: Profile News Message Board | |
| Charts:- Daily , Weekly | |
| Add ERII to Watchlist: View: Get Complete ERII Trend Analysis ➞ | |
 | MATW Matthews International Corp |
| Sector: Industrials | |
| SubSector: Conglomerates | |
| MarketCap: 766.69 Millions | |
| Recent Price: 24.90 Smart Investing & Trading Score: 70 | |
| Day Percent Change: 0.0401768% Day Change: 0.21 | |
| Week Change: 4.01003% Year-to-date Change: -4.8% | |
| MATW Links: Profile News Message Board | |
| Charts:- Daily , Weekly | |
| Add MATW to Watchlist: View: Get Complete MATW Trend Analysis ➞ | |
 | GNK Genco Shipping & Trading Limited |
| Sector: Industrials | |
| SubSector: Marine Shipping | |
| MarketCap: 764.68 Millions | |
| Recent Price: 17.80 Smart Investing & Trading Score: 100 | |
| Day Percent Change: 2.24009% Day Change: 0.42 | |
| Week Change: 4.52143% Year-to-date Change: 26.2% | |
| GNK Links: Profile News Message Board | |
| Charts:- Daily , Weekly | |
| Add GNK to Watchlist: View: Get Complete GNK Trend Analysis ➞ | |
 | RYI Ryerson Holding Corp |
| Sector: Industrials | |
| SubSector: Metal Fabrication | |
| MarketCap: 756.67 Millions | |
| Recent Price: 23.50 Smart Investing & Trading Score: 100 | |
| Day Percent Change: 2.39651% Day Change: -0.16 | |
| Week Change: 3.1154% Year-to-date Change: 34.2% | |
| RYI Links: Profile News Message Board | |
| Charts:- Daily , Weekly | |
| Add RYI to Watchlist: View: Get Complete RYI Trend Analysis ➞ | |
 | IIIN Insteel Industries, Inc |
| Sector: Industrials | |
| SubSector: Metal Fabrication | |
| MarketCap: 754.65 Millions | |
| Recent Price: 38.88 Smart Investing & Trading Score: 80 | |
| Day Percent Change: -0.128436% Day Change: 0.26 | |
| Week Change: 0.180366% Year-to-date Change: 48.5% | |
| IIIN Links: Profile News Message Board | |
| Charts:- Daily , Weekly | |
| Add IIIN to Watchlist: View: Get Complete IIIN Trend Analysis ➞ | |
 | TRNS Transcat Inc |
| Sector: Industrials | |
| SubSector: Specialty Business Services | |
| MarketCap: 728.57 Millions | |
| Recent Price: 78.18 Smart Investing & Trading Score: 20 | |
| Day Percent Change: 0.68255% Day Change: 1.47 | |
| Week Change: -6.27023% Year-to-date Change: -26.3% | |
| TRNS Links: Profile News Message Board | |
| Charts:- Daily , Weekly | |
| Add TRNS to Watchlist: View: Get Complete TRNS Trend Analysis ➞ | |
 | KE Kimball Electronics Inc |
| Sector: Industrials | |
| SubSector: Electrical Equipment & Parts | |
| MarketCap: 724.13 Millions | |
| Recent Price: 29.90 Smart Investing & Trading Score: 90 | |
| Day Percent Change: 0.47043% Day Change: 0.22 | |
| Week Change: 5.46737% Year-to-date Change: 62.6% | |
| KE Links: Profile News Message Board | |
| Charts:- Daily , Weekly | |
| Add KE to Watchlist: View: Get Complete KE Trend Analysis ➞ | |
 | VLRS Controladora Vuela Cia De Aviacion ADR |
| Sector: Industrials | |
| SubSector: Airlines | |
| MarketCap: 706.64 Millions | |
| Recent Price: 6.15 Smart Investing & Trading Score: 70 | |
| Day Percent Change: 0.654664% Day Change: -0.09 | |
| Week Change: 0.654664% Year-to-date Change: -16.9% | |
| VLRS Links: Profile News Message Board | |
| Charts:- Daily , Weekly | |
| Add VLRS to Watchlist: View: Get Complete VLRS Trend Analysis ➞ | |
 | BWMN Bowman Consulting Group Ltd |
| Sector: Industrials | |
| SubSector: Engineering & Construction | |
| MarketCap: 703.66 Millions | |
| Recent Price: 40.79 Smart Investing & Trading Score: 50 | |
| Day Percent Change: -2.85782% Day Change: 1.3 | |
| Week Change: -2.60267% Year-to-date Change: 63.5% | |
| BWMN Links: Profile News Message Board | |
| Charts:- Daily , Weekly | |
| Add BWMN to Watchlist: View: Get Complete BWMN Trend Analysis ➞ | |
 | SNCY Sun Country Airlines Holdings Inc |
| Sector: Industrials | |
| SubSector: Airlines | |
| MarketCap: 702.18 Millions | |
| Recent Price: 13.17 Smart Investing & Trading Score: 60 | |
| Day Percent Change: 1.62037% Day Change: -0.24 | |
| Week Change: 0.765111% Year-to-date Change: -9.4% | |
| SNCY Links: Profile News Message Board | |
| Charts:- Daily , Weekly | |
| Add SNCY to Watchlist: View: Get Complete SNCY Trend Analysis ➞ | |
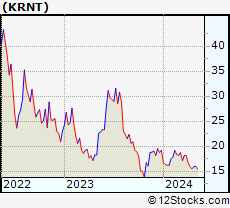 | KRNT Kornit Digital Ltd |
| Sector: Industrials | |
| SubSector: Specialty Industrial Machinery | |
| MarketCap: 694.87 Millions | |
| Recent Price: 15.33 Smart Investing & Trading Score: 60 | |
| Day Percent Change: 4.21482% Day Change: 0.06 | |
| Week Change: 1.52318% Year-to-date Change: -50.1% | |
| KRNT Links: Profile News Message Board | |
| Charts:- Daily , Weekly | |
| Add KRNT to Watchlist: View: Get Complete KRNT Trend Analysis ➞ | |
 | BXC Bluelinx Hldgs Inc |
| Sector: Industrials | |
| SubSector: Industrial Distribution | |
| MarketCap: 680.01 Millions | |
| Recent Price: 86.16 Smart Investing & Trading Score: 100 | |
| Day Percent Change: 1.63973% Day Change: 0.92 | |
| Week Change: 5.22716% Year-to-date Change: -13.7% | |
| BXC Links: Profile News Message Board | |
| Charts:- Daily , Weekly | |
| Add BXC to Watchlist: View: Get Complete BXC Trend Analysis ➞ | |
 | ULH Universal Logistics Holdings Inc |
| Sector: Industrials | |
| SubSector: Trucking | |
| MarketCap: 672.72 Millions | |
| Recent Price: 25.55 Smart Investing & Trading Score: 70 | |
| Day Percent Change: 1.63087% Day Change: -0.2 | |
| Week Change: -2.51812% Year-to-date Change: -41.1% | |
| ULH Links: Profile News Message Board | |
| Charts:- Daily , Weekly | |
| Add ULH to Watchlist: View: Get Complete ULH Trend Analysis ➞ | |
 | HOLI Hollysys Automation Technologies Ltd. |
| Sector: Industrials | |
| SubSector: Industrial Electrical Equipment | |
| MarketCap: 668.379 Millions | |
| Recent Price: 31.23 Smart Investing & Trading Score: 100 | |
| Day Percent Change: 0.709449% Day Change: -9999 | |
| Week Change: 18.3403% Year-to-date Change: 0.0% | |
| HOLI Links: Profile News Message Board | |
| Charts:- Daily , Weekly | |
| Add HOLI to Watchlist: View: Get Complete HOLI Trend Analysis ➞ | |
 | HY Hyster Yale Inc |
| Sector: Industrials | |
| SubSector: Farm & Heavy Construction Machinery | |
| MarketCap: 668.11 Millions | |
| Recent Price: 37.70 Smart Investing & Trading Score: 60 | |
| Day Percent Change: 1.5625% Day Change: 0.3 | |
| Week Change: -2.20493% Year-to-date Change: -23.8% | |
| HY Links: Profile News Message Board | |
| Charts:- Daily , Weekly | |
| Add HY to Watchlist: View: Get Complete HY Trend Analysis ➞ | |
 | CCX Churchill Capital Corp II |
| Sector: Industrials | |
| SubSector: Conglomerates | |
| MarketCap: 667.348 Millions | |
| Recent Price: 122.00 Smart Investing & Trading Score: 20 | |
| Day Percent Change: 0.993378% Day Change: -9999 | |
| Week Change: -6.58499% Year-to-date Change: 0.0% | |
| CCX Links: Profile News Message Board | |
| Charts:- Daily , Weekly | |
| Add CCX to Watchlist: View: Get Complete CCX Trend Analysis ➞ | |
| For tabular summary view of above stock list: Summary View ➞ 0 - 25 , 25 - 50 , 50 - 75 , 75 - 100 , 100 - 125 , 125 - 150 , 150 - 175 , 175 - 200 , 200 - 225 , 225 - 250 , 250 - 275 , 275 - 300 , 300 - 325 , 325 - 350 , 350 - 375 , 375 - 400 , 400 - 425 , 425 - 450 , 450 - 475 , 475 - 500 , 500 - 525 | ||
| Click To Change The Sort Order: By Market Cap or Company Size Performance: Year-to-date, Week and Day | |
| Select Chart Type: | ||
|
Best Stocks Today 12Stocks.com |
© 2025 12Stocks.com Terms & Conditions Privacy Contact Us
All Information Provided Only For Education And Not To Be Used For Investing or Trading. See Terms & Conditions


One More Thing ... Get Best Stocks Delivered Daily!
Never Ever Miss A Move With Our Top Ten Stocks Lists
Find Best Stocks In Any Market - Bull or Bear Market
Take A Peek At Our Top Ten Stocks Lists: Daily, Weekly, Year-to-Date & Top Trends
Find Best Stocks In Any Market - Bull or Bear Market
Take A Peek At Our Top Ten Stocks Lists: Daily, Weekly, Year-to-Date & Top Trends
Industrial Stocks With Best Up Trends [0-bearish to 100-bullish]: Brooge [100], CryoPort [100], Concrete Pumping[100], Mirion Technologies[100], Herc [100], Stanley Black[100], JELD-WEN Holding[100], Builders Firstsource[100], Bloom Energy[100], SiteOne Landscape[100], Embraer S.A.[100]
Best Industrial Stocks Year-to-Date:
Triumph [1432.18%], Tecogen [486.452%], GrafTech [476.744%], Power [197.092%], Lightbridge Corp[179.02%], Willdan [162.367%], Tutor Perini[159.23%], Kratos Defense[145.679%], Astronics Corp[144.965%], Bloom Energy[144.202%], Amprius Technologies[142.5%] Best Industrial Stocks This Week:
TRC [10149.1%], Advanced Emissions[3571.78%], L3 Technologies[1915.25%], Forterra [1845.47%], GrafTech [896.885%], KLX [437.488%], Allegro Merger[402.182%], LMI Aerospace[291.621%], Chicago Bridge[205.472%], Covanta Holding[148.617%], MOOG [148.377%] Best Industrial Stocks Daily:
Brooge [29.5547%], CryoPort [16.9492%], Concrete Pumping[12.188%], Tecogen [10.989%], Mirion Technologies[9.09957%], B/E Aerospace[8.86381%], Ballard Power[7.56757%], Hurco [7.494%], GrafTech [7.35931%], Herc [7.34109%], Symbotic [6.70057%]