
 Login Sign Up


| |||||
 |  | ||||

| 12Stocks.com Market Intelligence |
Best Industrial Stocks
| In a hurry? Industrial Stocks Lists: Performance Trends Table, Stock Charts
Sort Industrial stocks: Daily, Weekly, Year-to-Date, Market Cap & Trends. Filter Industrial stocks list by size:All Industrial Large Mid-Range Small |
| 12Stocks.com Industrial Stocks Performances & Trends Daily | |||||||||
|
|  The overall Smart Investing & Trading Score is 30 (0-bearish to 100-bullish) which puts Industrial sector in short term bearish to neutral trend. The Smart Investing & Trading Score from previous trading session is 40 and hence a deterioration of trend.
| ||||||||
Here are the Smart Investing & Trading Scores of the most requested Industrial stocks at 12Stocks.com (click stock name for detailed review):
|


| 12Stocks.com: Investing in Industrial sector with Stocks | |
|
The following table helps investors and traders sort through current performance and trends (as measured by Smart Investing & Trading Score) of various
stocks in the Industrial sector. Quick View: Move mouse or cursor over stock symbol (ticker) to view short-term Technical chart and over stock name to view long term chart. Click on  to add stock symbol to your watchlist and to add stock symbol to your watchlist and  to view watchlist. Click on any ticker or stock name for detailed market intelligence report for that stock. to view watchlist. Click on any ticker or stock name for detailed market intelligence report for that stock. |
12Stocks.com Performance of Stocks in Industrial Sector
| Ticker | Stock Name | Watchlist | Category | Recent Price | Smart Investing & Trading Score | Change % | YTD Change% |
| GVA | Granite Construction |   | Heavy Construction | 107.75 | 40 | 0.04% | 25.34% |
| APT | Alpha Pro | | Building Materials | 4.78 | 40 | 0.00% | -12.67% |
| PNR | Pentair | | Equipment | 106.28 | 40 | -0.01% | 3.07% |
| HI | Hillenbrand | | Machinery | 25.39 | 40 | -0.04% | -18.48% |
| EPAC | Enerpac Tool | | Machinery | 42.34 | 40 | -0.05% | 2.00% |
| RYN | Rayonier | | Lumber, Wood | 26.28 | 40 | -0.11% | 4.21% |
| MTH | Meritage Homes | | Residential | 77.69 | 40 | -0.13% | -1.37% |
| HAYW | Hayward | | Electrical Equipment & Parts | 16.08 | 40 | -0.19% | 3.40% |
| RGR | Sturm Ruger | | Aerospace/Defense | 34.67 | 40 | -0.29% | -2.77% |
| APOG | Apogee Enterprises | | Building Materials | 43.98 | 40 | -0.30% | -39.43% |
| FLS | Flowserve | | Machinery | 53.66 | 40 | -0.33% | -8.88% |
| CMI | Cummins | | Machinery | 393.89 | 40 | -0.34% | 11.72% |
| ACA | Arcosa | | Machinery | 98.95 | 40 | -0.39% | -1.48% |
| CAT | Caterpillar | | Machinery | 414.36 | 40 | -0.41% | 12.52% |
| NX | Quanex Building | | Building Materials | 21.27 | 40 | -0.62% | -13.36% |
| MAS | Masco | | Building Materials | 71.93 | 40 | -0.62% | -8.04% |
| RYI | Ryerson Holding | | Fabrication | 22.80 | 40 | -0.73% | 19.53% |
| HII | Huntington Ingalls | | Aerospace/Defense | 267.7 | 40 | -0.75% | 37.60% |
| LMT | Lockheed Martin | | Aerospace/Defense | 448.96 | 40 | -0.78% | -1.63% |
| BLDR | Builders FirstSource | | Building Materials | 136.2 | 40 | -0.84% | -18.58% |
| BLD | TopBuild | | Building Materials | 420.76 | 40 | -1.11% | 33.64% |
| TMHC | Taylor Morrison | | Residential | 67.37 | 40 | -1.30% | 7.53% |
| HTZ | Hertz Global | | Rental & Leasing | 5.73 | 40 | -2.54% | 46.72% |
| RXO | RXO | | Trucking | 16.33 | 33 | 1.66% | -38.34% |
| SLDP | Solid Power | | Electrical Equipment & Parts | 4.33 | 30 | 4.85% | 128.57% |
| For chart view version of above stock list: Chart View ➞ 0 - 25 , 25 - 50 , 50 - 75 , 75 - 100 , 100 - 125 , 125 - 150 , 150 - 175 , 175 - 200 , 200 - 225 , 225 - 250 , 250 - 275 , 275 - 300 | ||
 | Click To Change The Sort Order: By Market Cap or Company Size Performance: Year-to-date, Week and Day |  |
|
Get the most comprehensive stock market coverage daily at 12Stocks.com ➞ Best Stocks Today ➞ Best Stocks Weekly ➞ Best Stocks Year-to-Date ➞ Best Stocks Trends ➞  Best Stocks Today 12Stocks.com Best Nasdaq Stocks ➞ Best S&P 500 Stocks ➞ Best Tech Stocks ➞ Best Biotech Stocks ➞ |
| Detailed Overview of Industrial Stocks |
| Industrial Technical Overview, Leaders & Laggards, Top Industrial ETF Funds & Detailed Industrial Stocks List, Charts, Trends & More |
| Industrial Sector: Technical Analysis, Trends & YTD Performance | |
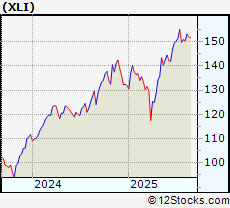
| Industrial sector is composed of stocks
from industrial machinery, aerospace, defense, farm/construction
and industrial services subsectors. Industrial sector, as represented by XLI, an exchange-traded fund [ETF] that holds basket of Industrial stocks (e.g, Caterpillar, Boeing) is up by 11.44% and is currently outperforming the overall market by 4.66% year-to-date. Below is a quick view of Technical charts and trends: |
|
 XLI Weekly Chart |
|
| Long Term Trend: Very Good | |
| Medium Term Trend: Very Good | |
 XLI Daily Chart |
|
| Short Term Trend: Not Good | |
| Overall Trend Score: 30 | |
| YTD Performance: 11.44% | |
| **Trend Scores & Views Are Only For Educational Purposes And Not For Investing | |
| 12Stocks.com: Top Performing Industrial Sector Stocks | ||||||||||||||||||||||||||||||||||||||||||||||||
 The top performing Industrial sector stocks year to date are
Now, more recently, over last week, the top performing Industrial sector stocks on the move are


|
||||||||||||||||||||||||||||||||||||||||||||||||
| 12Stocks.com: Investing in Industrial Sector using Exchange Traded Funds | |
|
The following table shows list of key exchange traded funds (ETF) that
help investors track Industrial Index. For detailed view, check out our ETF Funds section of our website. Quick View: Move mouse or cursor over ETF symbol (ticker) to view short-term Technical chart and over ETF name to view long term chart. Click on ticker or stock name for detailed view. Click on to add stock symbol to your watchlist and to view watchlist. |
12Stocks.com List of ETFs that track Industrial Index
| Ticker | ETF Name | Watchlist | Recent Price | Smart Investing & Trading Score | Change % | Week % | Year-to-date % |
| XLI | Industrial | | 152.01 | 30 | 1.7 | 1.86 | 11.44% |
| UXI | Industrials | | 45.12 | 20 | 3.19 | 3.54 | 16.37% |
| PPA | Aerospace & Defense | | 147.97 | 50 | 0.88 | 0.4 | 21.93% |
| ITA | Aerospace & Defense | | 198.42 | 50 | 0.53 | 0.47 | 25.5% |
| ITB | Home Construction | | 110.70 | 60 | 5.42 | 3.17 | 6.94% |
| XHB | Homebuilders | | 112.96 | 40 | -0.04 | -0.91 | 4.71% |
| SIJ | Short Industrials | | 11.97 | 70 | -3.12 | -3.42 | -20.76% |
| IYJ | Industrials | | 146.17 | 30 | -0.24 | -0.58 | 8.12% |
| EXI | Global Industrials | | 168.86 | 20 | -0.42 | -0.57 | 20.04% |
| VIS | Industrials | | 291.31 | 30 | -0.33 | -0.59 | 13.79% |
| PSCI | SmallCap Industrials | | 147.86 | 50 | -0.02 | -1.17 | 7.75% |
| XAR | Aerospace & Defense | | 217.44 | 40 | 0.62 | -1.47 | 28.91% |
| ARKQ | ARK Industrial Innovation | | 97.96 | 20 | 0.08 | -5.38 | 23.44% |
| 12Stocks.com: Charts, Trends, Fundamental Data and Performances of Industrial Stocks | |
|
We now take in-depth look at all Industrial stocks including charts, multi-period performances and overall trends (as measured by Smart Investing & Trading Score). One can sort Industrial stocks (click link to choose) by Daily, Weekly and by Year-to-Date performances. Also, one can sort by size of the company or by market capitalization. |
| Select Your Default Chart Type: | |||||
| |||||
| Click on stock symbol or name for detailed view. Click on to add stock symbol to your watchlist and to view watchlist. Quick View: Move mouse or cursor over "Daily" to quickly view daily Technical stock chart and over "Weekly" to view weekly Technical stock chart. | |||||

 | GVA Granite Construction Incorporated |
| Sector: Industrials | |
| SubSector: Heavy Construction | |
| MarketCap: 725.895 Millions | |
| Recent Price: 107.75 Smart Investing & Trading Score: 40 | |
| Day Percent Change: 0.04% Day Change: 0.04 | |
| Week Change: -1.09% Year-to-date Change: 25.3% | |
| GVA Links: Profile News Message Board | |
| Charts:- Daily , Weekly | |
| Add GVA to Watchlist: View: Get Complete GVA Trend Analysis ➞ | |
 | APT Alpha Pro Tech, Ltd. |
| Sector: Industrials | |
| SubSector: General Building Materials | |
| MarketCap: 125.953 Millions | |
| Recent Price: 4.78 Smart Investing & Trading Score: 40 | |
| Day Percent Change: 0% Day Change: 0 | |
| Week Change: 1.32% Year-to-date Change: -12.7% | |
| APT Links: Profile News Message Board | |
| Charts:- Daily , Weekly | |
| Add APT to Watchlist: View: Get Complete APT Trend Analysis ➞ | |
 | PNR Pentair plc |
| Sector: Industrials | |
| SubSector: Industrial Equipment & Components | |
| MarketCap: 4326.59 Millions | |
| Recent Price: 106.28 Smart Investing & Trading Score: 40 | |
| Day Percent Change: -0.01% Day Change: -0.01 | |
| Week Change: -1.16% Year-to-date Change: 3.1% | |
| PNR Links: Profile News Message Board | |
| Charts:- Daily , Weekly | |
| Add PNR to Watchlist: View: Get Complete PNR Trend Analysis ➞ | |
 | HI Hillenbrand, Inc. |
| Sector: Industrials | |
| SubSector: Diversified Machinery | |
| MarketCap: 1389.86 Millions | |
| Recent Price: 25.39 Smart Investing & Trading Score: 40 | |
| Day Percent Change: -0.04% Day Change: -0.01 | |
| Week Change: -3.87% Year-to-date Change: -18.5% | |
| HI Links: Profile News Message Board | |
| Charts:- Daily , Weekly | |
| Add HI to Watchlist: View: Get Complete HI Trend Analysis ➞ | |
 | EPAC Enerpac Tool Group Corp. |
| Sector: Industrials | |
| SubSector: Diversified Machinery | |
| MarketCap: 1044.16 Millions | |
| Recent Price: 42.34 Smart Investing & Trading Score: 40 | |
| Day Percent Change: -0.05% Day Change: -0.02 | |
| Week Change: 0.31% Year-to-date Change: 2.0% | |
| EPAC Links: Profile News Message Board | |
| Charts:- Daily , Weekly | |
| Add EPAC to Watchlist: View: Get Complete EPAC Trend Analysis ➞ | |
 | RYN Rayonier Inc. |
| Sector: Industrials | |
| SubSector: Lumber, Wood Production | |
| MarketCap: 3143 Millions | |
| Recent Price: 26.28 Smart Investing & Trading Score: 40 | |
| Day Percent Change: -0.11% Day Change: -0.03 | |
| Week Change: 0.26% Year-to-date Change: 4.2% | |
| RYN Links: Profile News Message Board | |
| Charts:- Daily , Weekly | |
| Add RYN to Watchlist: View: Get Complete RYN Trend Analysis ➞ | |
 | MTH Meritage Homes Corporation |
| Sector: Industrials | |
| SubSector: Residential Construction | |
| MarketCap: 1440.36 Millions | |
| Recent Price: 77.69 Smart Investing & Trading Score: 40 | |
| Day Percent Change: -0.13% Day Change: -0.1 | |
| Week Change: -2.74% Year-to-date Change: -1.4% | |
| MTH Links: Profile News Message Board | |
| Charts:- Daily , Weekly | |
| Add MTH to Watchlist: View: Get Complete MTH Trend Analysis ➞ | |
 | HAYW Hayward Holdings, Inc. |
| Sector: Industrials | |
| SubSector: Electrical Equipment & Parts | |
| MarketCap: 2670 Millions | |
| Recent Price: 16.08 Smart Investing & Trading Score: 40 | |
| Day Percent Change: -0.19% Day Change: -0.03 | |
| Week Change: -2.41% Year-to-date Change: 3.4% | |
| HAYW Links: Profile News Message Board | |
| Charts:- Daily , Weekly | |
| Add HAYW to Watchlist: View: Get Complete HAYW Trend Analysis ➞ | |
 | RGR Sturm, Ruger & Company, Inc. |
| Sector: Industrials | |
| SubSector: Aerospace/Defense Products & Services | |
| MarketCap: 752 Millions | |
| Recent Price: 34.67 Smart Investing & Trading Score: 40 | |
| Day Percent Change: -0.29% Day Change: -0.1 | |
| Week Change: -2.16% Year-to-date Change: -2.8% | |
| RGR Links: Profile News Message Board | |
| Charts:- Daily , Weekly | |
| Add RGR to Watchlist: View: Get Complete RGR Trend Analysis ➞ | |
 | APOG Apogee Enterprises, Inc. |
| Sector: Industrials | |
| SubSector: General Building Materials | |
| MarketCap: 510.653 Millions | |
| Recent Price: 43.98 Smart Investing & Trading Score: 40 | |
| Day Percent Change: -0.3% Day Change: -0.13 | |
| Week Change: -2.61% Year-to-date Change: -39.4% | |
| APOG Links: Profile News Message Board | |
| Charts:- Daily , Weekly | |
| Add APOG to Watchlist: View: Get Complete APOG Trend Analysis ➞ | |
 | FLS Flowserve Corporation |
| Sector: Industrials | |
| SubSector: Diversified Machinery | |
| MarketCap: 2974.66 Millions | |
| Recent Price: 53.66 Smart Investing & Trading Score: 40 | |
| Day Percent Change: -0.33% Day Change: -0.17 | |
| Week Change: -1.94% Year-to-date Change: -8.9% | |
| FLS Links: Profile News Message Board | |
| Charts:- Daily , Weekly | |
| Add FLS to Watchlist: View: Get Complete FLS Trend Analysis ➞ | |
 | CMI Cummins Inc. |
| Sector: Industrials | |
| SubSector: Diversified Machinery | |
| MarketCap: 19127.1 Millions | |
| Recent Price: 393.89 Smart Investing & Trading Score: 40 | |
| Day Percent Change: -0.34% Day Change: -1.34 | |
| Week Change: -1.14% Year-to-date Change: 11.7% | |
| CMI Links: Profile News Message Board | |
| Charts:- Daily , Weekly | |
| Add CMI to Watchlist: View: Get Complete CMI Trend Analysis ➞ | |
 | ACA Arcosa, Inc. |
| Sector: Industrials | |
| SubSector: Farm & Construction Machinery | |
| MarketCap: 1692.57 Millions | |
| Recent Price: 98.95 Smart Investing & Trading Score: 40 | |
| Day Percent Change: -0.39% Day Change: -0.37 | |
| Week Change: -2.04% Year-to-date Change: -1.5% | |
| ACA Links: Profile News Message Board | |
| Charts:- Daily , Weekly | |
| Add ACA to Watchlist: View: Get Complete ACA Trend Analysis ➞ | |
 | CAT Caterpillar Inc. |
| Sector: Industrials | |
| SubSector: Farm & Construction Machinery | |
| MarketCap: 58636 Millions | |
| Recent Price: 414.36 Smart Investing & Trading Score: 40 | |
| Day Percent Change: -0.41% Day Change: -1.69 | |
| Week Change: -1.12% Year-to-date Change: 12.5% | |
| CAT Links: Profile News Message Board | |
| Charts:- Daily , Weekly | |
| Add CAT to Watchlist: View: Get Complete CAT Trend Analysis ➞ | |
 | NX Quanex Building Products Corporation |
| Sector: Industrials | |
| SubSector: General Building Materials | |
| MarketCap: 315.453 Millions | |
| Recent Price: 21.27 Smart Investing & Trading Score: 40 | |
| Day Percent Change: -0.62% Day Change: -0.13 | |
| Week Change: -2.75% Year-to-date Change: -13.4% | |
| NX Links: Profile News Message Board | |
| Charts:- Daily , Weekly | |
| Add NX to Watchlist: View: Get Complete NX Trend Analysis ➞ | |
 | MAS Masco Corporation |
| Sector: Industrials | |
| SubSector: General Building Materials | |
| MarketCap: 8655.63 Millions | |
| Recent Price: 71.93 Smart Investing & Trading Score: 40 | |
| Day Percent Change: -0.62% Day Change: -0.45 | |
| Week Change: -1.99% Year-to-date Change: -8.0% | |
| MAS Links: Profile News Message Board | |
| Charts:- Daily , Weekly | |
| Add MAS to Watchlist: View: Get Complete MAS Trend Analysis ➞ | |
 | RYI Ryerson Holding Corporation |
| Sector: Industrials | |
| SubSector: Metal Fabrication | |
| MarketCap: 202.55 Millions | |
| Recent Price: 22.80 Smart Investing & Trading Score: 40 | |
| Day Percent Change: -0.73% Day Change: -0.16 | |
| Week Change: -0.64% Year-to-date Change: 19.5% | |
| RYI Links: Profile News Message Board | |
| Charts:- Daily , Weekly | |
| Add RYI to Watchlist: View: Get Complete RYI Trend Analysis ➞ | |
 | HII Huntington Ingalls Industries, Inc. |
| Sector: Industrials | |
| SubSector: Aerospace/Defense Products & Services | |
| MarketCap: 7276.11 Millions | |
| Recent Price: 267.7 Smart Investing & Trading Score: 40 | |
| Day Percent Change: -0.75% Day Change: -2.01 | |
| Week Change: -1.14% Year-to-date Change: 37.6% | |
| HII Links: Profile News Message Board | |
| Charts:- Daily , Weekly | |
| Add HII to Watchlist: View: Get Complete HII Trend Analysis ➞ | |
 | LMT Lockheed Martin Corporation |
| Sector: Industrials | |
| SubSector: Aerospace/Defense Products & Services | |
| MarketCap: 94116.4 Millions | |
| Recent Price: 448.96 Smart Investing & Trading Score: 40 | |
| Day Percent Change: -0.78% Day Change: -3.54 | |
| Week Change: -1.46% Year-to-date Change: -1.6% | |
| LMT Links: Profile News Message Board | |
| Charts:- Daily , Weekly | |
| Add LMT to Watchlist: View: Get Complete LMT Trend Analysis ➞ | |
 | BLDR Builders FirstSource, Inc. |
| Sector: Industrials | |
| SubSector: General Building Materials | |
| MarketCap: 1714.63 Millions | |
| Recent Price: 136.2 Smart Investing & Trading Score: 40 | |
| Day Percent Change: -0.84% Day Change: -1.16 | |
| Week Change: -1.79% Year-to-date Change: -18.6% | |
| BLDR Links: Profile News Message Board | |
| Charts:- Daily , Weekly | |
| Add BLDR to Watchlist: View: Get Complete BLDR Trend Analysis ➞ | |
 | BLD TopBuild Corp. |
| Sector: Industrials | |
| SubSector: General Building Materials | |
| MarketCap: 2534.53 Millions | |
| Recent Price: 420.76 Smart Investing & Trading Score: 40 | |
| Day Percent Change: -1.11% Day Change: -4.66 | |
| Week Change: -4.76% Year-to-date Change: 33.6% | |
| BLD Links: Profile News Message Board | |
| Charts:- Daily , Weekly | |
| Add BLD to Watchlist: View: Get Complete BLD Trend Analysis ➞ | |
 | TMHC Taylor Morrison Home Corporation |
| Sector: Industrials | |
| SubSector: Residential Construction | |
| MarketCap: 1336.76 Millions | |
| Recent Price: 67.37 Smart Investing & Trading Score: 40 | |
| Day Percent Change: -1.3% Day Change: -0.87 | |
| Week Change: -3.21% Year-to-date Change: 7.5% | |
| TMHC Links: Profile News Message Board | |
| Charts:- Daily , Weekly | |
| Add TMHC to Watchlist: View: Get Complete TMHC Trend Analysis ➞ | |
 | HTZ Hertz Global Holdings, Inc. |
| Sector: Industrials | |
| SubSector: Rental & Leasing Services | |
| MarketCap: 5830 Millions | |
| Recent Price: 5.73 Smart Investing & Trading Score: 40 | |
| Day Percent Change: -2.54% Day Change: -0.14 | |
| Week Change: 2.48% Year-to-date Change: 46.7% | |
| HTZ Links: Profile News Message Board | |
| Charts:- Daily , Weekly | |
| Add HTZ to Watchlist: View: Get Complete HTZ Trend Analysis ➞ | |
 | RXO RXO, Inc. |
| Sector: Industrials | |
| SubSector: Trucking | |
| MarketCap: 2550 Millions | |
| Recent Price: 16.33 Smart Investing & Trading Score: 33 | |
| Day Percent Change: 1.66% Day Change: 0.24 | |
| Week Change: -2.46% Year-to-date Change: -38.3% | |
| RXO Links: Profile News Message Board | |
| Charts:- Daily , Weekly | |
| Add RXO to Watchlist: View: Get Complete RXO Trend Analysis ➞ | |
 | SLDP Solid Power, Inc. |
| Sector: Industrials | |
| SubSector: Electrical Equipment & Parts | |
| MarketCap: 445 Millions | |
| Recent Price: 4.33 Smart Investing & Trading Score: 30 | |
| Day Percent Change: 4.85% Day Change: 0.2 | |
| Week Change: -19.55% Year-to-date Change: 128.6% | |
| SLDP Links: Profile News Message Board | |
| Charts:- Daily , Weekly | |
| Add SLDP to Watchlist: View: Get Complete SLDP Trend Analysis ➞ | |
| For tabular summary view of above stock list: Summary View ➞ 0 - 25 , 25 - 50 , 50 - 75 , 75 - 100 , 100 - 125 , 125 - 150 , 150 - 175 , 175 - 200 , 200 - 225 , 225 - 250 , 250 - 275 , 275 - 300 | ||
| Click To Change The Sort Order: By Market Cap or Company Size Performance: Year-to-date, Week and Day | |
| Select Chart Type: | ||
|
Best Stocks Today 12Stocks.com |
© 2025 12Stocks.com Terms & Conditions Privacy Contact Us
All Information Provided Only For Education And Not To Be Used For Investing or Trading. See Terms & Conditions


One More Thing ... Get Best Stocks Delivered Daily!
Never Ever Miss A Move With Our Top Ten Stocks Lists
Find Best Stocks In Any Market - Bull or Bear Market
Take A Peek At Our Top Ten Stocks Lists: Daily, Weekly, Year-to-Date & Top Trends
Find Best Stocks In Any Market - Bull or Bear Market
Take A Peek At Our Top Ten Stocks Lists: Daily, Weekly, Year-to-Date & Top Trends
Industrial Stocks With Best Up Trends [0-bearish to 100-bullish]: Kanzhun [100], Xometry [100], Cementos Pacasmayo[100], Barnes [100], Hexcel [100], National Energy[100], Montrose Environmental[100], Seaboard [100], CEMEX S.A.B.[100], REX American[100], Eos Energy[100]
Best Industrial Stocks Year-to-Date:
LanzaTech Global[1484.67%], China Yuchai[231.9%], Amprius Technologies[142.5%], Tutor Perini[135.62%], Solid Power[128.57%], Astronics [123.06%], Evolv Technologies[98.23%], American Superconductor[97.28%], NuScale Power[86.78%], Symbotic [85.15%], Elbit Systems[78.5%] Best Industrial Stocks This Week:
LanzaTech Global[5701.71%], Twin Disc[25.39%], National Energy[23.8%], System1 [11.61%], Target Hospitality[10.9%], Kanzhun [10.41%], China Yuchai[8.53%], Astronics [8.27%], Barnes [8.09%], BiomX [7.55%], Cool [6.45%] Best Industrial Stocks Daily:
Twin Disc[30.05%], Bioceres Crop[8.89%], Novonix [7.08%], Kanzhun [6.61%], James Hardie[6.12%], Satellogic [5.65%], Solid Power[4.85%], System1 [4.83%], Xometry [4.58%], BiomX [4.06%], Astronics [3.46%]