
 Login Sign Up


| |||||
 |  | ||||

| 12Stocks.com Market Intelligence |
Best Industrial Stocks
| In a hurry? Industrial Stocks Lists: Performance Trends Table, Stock Charts
Sort Industrial stocks: Daily, Weekly, Year-to-Date, Market Cap & Trends. Filter Industrial stocks list by size:All Industrial Large Mid-Range Small |
| 12Stocks.com Industrial Stocks Performances & Trends Daily | |||||||||
|
|  The overall Smart Investing & Trading Score is 50 (0-bearish to 100-bullish) which puts Industrial sector in short term neutral trend. The Smart Investing & Trading Score from previous trading session is 20 and hence an improvement of trend.
| ||||||||
Here are the Smart Investing & Trading Scores of the most requested Industrial stocks at 12Stocks.com (click stock name for detailed review):
|


| 12Stocks.com: Investing in Industrial sector with Stocks | |
|
The following table helps investors and traders sort through current performance and trends (as measured by Smart Investing & Trading Score) of various
stocks in the Industrial sector. Quick View: Move mouse or cursor over stock symbol (ticker) to view short-term Technical chart and over stock name to view long term chart. Click on  to add stock symbol to your watchlist and to add stock symbol to your watchlist and  to view watchlist. Click on any ticker or stock name for detailed market intelligence report for that stock. to view watchlist. Click on any ticker or stock name for detailed market intelligence report for that stock. |
12Stocks.com Performance of Stocks in Industrial Sector
| Ticker | Stock Name | Watchlist | Category | Recent Price | Smart Investing & Trading Score | Change % | Weekly Change% |
| TRR | TRC |   | Waste Mgmt | 58.42 | 70 | 0.22% | 10,149.10% |
| ADES | Advanced Emissions | | Pollution & Treatment Controls | 119.70 | 90 | 0.18% | 3,571.78% |
| LLL | L3 Technologies | | Aerospace/Defense | 16.91 | 70 | -0.35% | 1,915.25% |
| FRTA | Forterra | | Building Materials | 448.82 | 60 | 1.20% | 1,845.47% |
| KLXI | KLX | | Aerospace/Defense | 57.78 | 100 | 1.46% | 437.49% |
| ALGR | Allegro Merger | | Conglomerates | 69.05 | 80 | -0.88% | 402.18% |
| LMIA | LMI Aerospace | | Aerospace/Defense | 79.46 | 100 | 1.81% | 291.62% |
| CBI | Chicago Bridge | | Contractors | 480.66 | 80 | 0.42% | 205.47% |
| CVA | Covanta Holding | | Waste Mgmt | 50.32 | 60 | -15.80% | 148.62% |
| MOG.A | MOOG | | AEROSPACE/DEFENSE EQUIPMENT | 194.38 | 80 | 1.43% | 148.38% |
| AIMC | Altra | | Electrical Equipment | 126.05 | 100 | 1.19% | 103.37% |
| SCX | L.S. Starrett | | Small Tools & Accessories | 31.50 | 80 | 0.86% | 94.81% |
| AEGN | Aegion | | Heavy Construction | 56.07 | 70 | -0.95% | 86.96% |
| PGTI | PGT Innovations | | Building Materials | 69.39 | 70 | -0.04% | 65.25% |
| CBPX | Continental Building | | Building Materials | 77.44 | 80 | 1.56% | 56.32% |
| BW | Babcock & Wilcox Enterprises | | Specialty Industrial Machinery | 3.08 | 90 | -3.75% | 53.23% |
| NCS | NCI Building | | Building Materials | 26.66 | 80 | -0.63% | 50.62% |
| KAMN | Kaman | | Aerospace/Defense | 68.05 | 70 | -0.77% | 48.35% |
| BE | Bloom Energy | | Electrical Equipment & Parts | 79.67 | 100 | 8.71% | 44.85% |
| PGEM | Ply Gem | | Building Materials | 128.45 | 80 | 0.61% | 41.46% |
| EAF | GrafTech | | Electrical Equipment & Parts | 12.05 | 100 | 11.99% | 41.27% |
| PLUG | Plug Power | | Electrical Equipment & Parts | 2.02 | 100 | 1.00% | 40.28% |
| RTN | Raytheon | | Aerospace/Defense | 273.36 | 80 | 0.25% | 38.97% |
| BLDP | Ballard Power | | Specialty Industrial Machinery | 2.52 | 100 | 14.55% | 33.33% |
| ESGL | ESGL | | Waste Mgmt | 3.56 | 80 | -3.57% | 33.27% |
| For chart view version of above stock list: Chart View ➞ 0 - 25 , 25 - 50 , 50 - 75 , 75 - 100 , 100 - 125 , 125 - 150 , 150 - 175 , 175 - 200 , 200 - 225 , 225 - 250 , 250 - 275 , 275 - 300 , 300 - 325 , 325 - 350 , 350 - 375 , 375 - 400 , 400 - 425 , 425 - 450 , 450 - 475 , 475 - 500 , 500 - 525 | ||
 | Click To Change The Sort Order: By Market Cap or Company Size Performance: Year-to-date, Week and Day |  |
|
Get the most comprehensive stock market coverage daily at 12Stocks.com ➞ Best Stocks Today ➞ Best Stocks Weekly ➞ Best Stocks Year-to-Date ➞ Best Stocks Trends ➞  Best Stocks Today 12Stocks.com Best Nasdaq Stocks ➞ Best S&P 500 Stocks ➞ Best Tech Stocks ➞ Best Biotech Stocks ➞ |
| Detailed Overview of Industrial Stocks |
| Industrial Technical Overview, Leaders & Laggards, Top Industrial ETF Funds & Detailed Industrial Stocks List, Charts, Trends & More |
| Industrial Sector: Technical Analysis, Trends & YTD Performance | |
| Industrial sector is composed of stocks
from industrial machinery, aerospace, defense, farm/construction
and industrial services subsectors. Industrial sector, as represented by XLI, an exchange-traded fund [ETF] that holds basket of Industrial stocks (e.g, Caterpillar, Boeing) is up by 16.8957% and is currently outperforming the overall market by 3.307% year-to-date. Below is a quick view of Technical charts and trends: |
|
 XLI Weekly Chart |
|
| Long Term Trend: Good | |
| Medium Term Trend: Good | |
 XLI Daily Chart |
|
| Short Term Trend: Very Good | |
| Overall Trend Score: 50 | |
| YTD Performance: 16.8957% | |
| **Trend Scores & Views Are Only For Educational Purposes And Not For Investing | |
| 12Stocks.com: Top Performing Industrial Sector Stocks | ||||||||||||||||||||||||||||||||||||||||||||||||
 The top performing Industrial sector stocks year to date are
Now, more recently, over last week, the top performing Industrial sector stocks on the move are


|
||||||||||||||||||||||||||||||||||||||||||||||||
| 12Stocks.com: Investing in Industrial Sector using Exchange Traded Funds | |
|
The following table shows list of key exchange traded funds (ETF) that
help investors track Industrial Index. For detailed view, check out our ETF Funds section of our website. Quick View: Move mouse or cursor over ETF symbol (ticker) to view short-term Technical chart and over ETF name to view long term chart. Click on ticker or stock name for detailed view. Click on to add stock symbol to your watchlist and to view watchlist. |
12Stocks.com List of ETFs that track Industrial Index
| Ticker | ETF Name | Watchlist | Recent Price | Smart Investing & Trading Score | Change % | Week % | Year-to-date % |
| CHII | China Industrials | | 9.80 | 20 | 0 | -0.0509944 | 0% |
| 12Stocks.com: Charts, Trends, Fundamental Data and Performances of Industrial Stocks | |
|
We now take in-depth look at all Industrial stocks including charts, multi-period performances and overall trends (as measured by Smart Investing & Trading Score). One can sort Industrial stocks (click link to choose) by Daily, Weekly and by Year-to-Date performances. Also, one can sort by size of the company or by market capitalization. |
| Select Your Default Chart Type: | |||||
| |||||
| Click on stock symbol or name for detailed view. Click on to add stock symbol to your watchlist and to view watchlist. Quick View: Move mouse or cursor over "Daily" to quickly view daily Technical stock chart and over "Weekly" to view weekly Technical stock chart. | |||||

 | TRR TRC Companies, Inc. |
| Sector: Industrials | |
| SubSector: Waste Management | |
| MarketCap: 345.91 Millions | |
| Recent Price: 58.42 Smart Investing & Trading Score: 70 | |
| Day Percent Change: 0.223023% Day Change: -9999 | |
| Week Change: 10149.1% Year-to-date Change: 0.0% | |
| TRR Links: Profile News Message Board | |
| Charts:- Daily , Weekly | |
| Add TRR to Watchlist: View: Get Complete TRR Trend Analysis ➞ | |
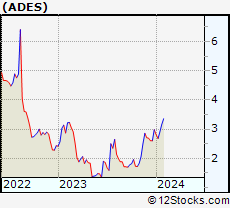 | ADES Advanced Emissions Solutions, Inc. |
| Sector: Industrials | |
| SubSector: Pollution & Treatment Controls | |
| MarketCap: 113.975 Millions | |
| Recent Price: 119.70 Smart Investing & Trading Score: 90 | |
| Day Percent Change: 0.175747% Day Change: -9999 | |
| Week Change: 3571.78% Year-to-date Change: 0.0% | |
| ADES Links: Profile News Message Board | |
| Charts:- Daily , Weekly | |
| Add ADES to Watchlist: View: Get Complete ADES Trend Analysis ➞ | |
 | LLL L3 Technologies, Inc. |
| Sector: Industrials | |
| SubSector: Aerospace/Defense Products & Services | |
| MarketCap: 13215.6 Millions | |
| Recent Price: 16.91 Smart Investing & Trading Score: 70 | |
| Day Percent Change: -0.353565% Day Change: -9999 | |
| Week Change: 1915.25% Year-to-date Change: 0.0% | |
| LLL Links: Profile News Message Board | |
| Charts:- Daily , Weekly | |
| Add LLL to Watchlist: View: Get Complete LLL Trend Analysis ➞ | |
 | FRTA Forterra, Inc. |
| Sector: Industrials | |
| SubSector: General Building Materials | |
| MarketCap: 327.553 Millions | |
| Recent Price: 448.82 Smart Investing & Trading Score: 60 | |
| Day Percent Change: 1.20183% Day Change: -9999 | |
| Week Change: 1845.47% Year-to-date Change: 0.0% | |
| FRTA Links: Profile News Message Board | |
| Charts:- Daily , Weekly | |
| Add FRTA to Watchlist: View: Get Complete FRTA Trend Analysis ➞ | |
 | KLXI KLX Inc. |
| Sector: Industrials | |
| SubSector: Aerospace/Defense Products & Services | |
| MarketCap: 2469.78 Millions | |
| Recent Price: 57.78 Smart Investing & Trading Score: 100 | |
| Day Percent Change: 1.45742% Day Change: -9999 | |
| Week Change: 437.488% Year-to-date Change: 0.0% | |
| KLXI Links: Profile News Message Board | |
| Charts:- Daily , Weekly | |
| Add KLXI to Watchlist: View: Get Complete KLXI Trend Analysis ➞ | |
 | ALGR Allegro Merger Corp. |
| Sector: Industrials | |
| SubSector: Conglomerates | |
| MarketCap: 158.848 Millions | |
| Recent Price: 69.05 Smart Investing & Trading Score: 80 | |
| Day Percent Change: -0.875682% Day Change: -9999 | |
| Week Change: 402.182% Year-to-date Change: 0.0% | |
| ALGR Links: Profile News Message Board | |
| Charts:- Daily , Weekly | |
| Add ALGR to Watchlist: View: Get Complete ALGR Trend Analysis ➞ | |
 | LMIA LMI Aerospace, Inc. |
| Sector: Industrials | |
| SubSector: Aerospace/Defense Products & Services | |
| MarketCap: 188.92 Millions | |
| Recent Price: 79.46 Smart Investing & Trading Score: 100 | |
| Day Percent Change: 1.80653% Day Change: -9999 | |
| Week Change: 291.621% Year-to-date Change: 0.0% | |
| LMIA Links: Profile News Message Board | |
| Charts:- Daily , Weekly | |
| Add LMIA to Watchlist: View: Get Complete LMIA Trend Analysis ➞ | |
 | CBI Chicago Bridge & Iron Company N.V. |
| Sector: Industrials | |
| SubSector: General Contractors | |
| MarketCap: 3057.36 Millions | |
| Recent Price: 480.66 Smart Investing & Trading Score: 80 | |
| Day Percent Change: 0.415735% Day Change: -9999 | |
| Week Change: 205.472% Year-to-date Change: 0.0% | |
| CBI Links: Profile News Message Board | |
| Charts:- Daily , Weekly | |
| Add CBI to Watchlist: View: Get Complete CBI Trend Analysis ➞ | |
 | CVA Covanta Holding Corporation |
| Sector: Industrials | |
| SubSector: Waste Management | |
| MarketCap: 1344.88 Millions | |
| Recent Price: 50.32 Smart Investing & Trading Score: 60 | |
| Day Percent Change: -15.7965% Day Change: -9999 | |
| Week Change: 148.617% Year-to-date Change: 0.0% | |
| CVA Links: Profile News Message Board | |
| Charts:- Daily , Weekly | |
| Add CVA to Watchlist: View: Get Complete CVA Trend Analysis ➞ | |
 | MOG.A MOOG INC A |
| Sector: Industrials | |
| SubSector: AEROSPACE/DEFENSE EQUIPMENT | |
| MarketCap: 1844.11 Millions | |
| Recent Price: 194.38 Smart Investing & Trading Score: 80 | |
| Day Percent Change: 1.42976% Day Change: -9999 | |
| Week Change: 148.377% Year-to-date Change: 0.0% | |
| MOG.A Links: Profile News Message Board | |
| Charts:- Daily , Weekly | |
| Add MOG.A to Watchlist: View: Get Complete MOG.A Trend Analysis ➞ | |
 | AIMC Altra Industrial Motion Corp. |
| Sector: Industrials | |
| SubSector: Industrial Electrical Equipment | |
| MarketCap: 1169.99 Millions | |
| Recent Price: 126.05 Smart Investing & Trading Score: 100 | |
| Day Percent Change: 1.18809% Day Change: -9999 | |
| Week Change: 103.372% Year-to-date Change: 0.0% | |
| AIMC Links: Profile News Message Board | |
| Charts:- Daily , Weekly | |
| Add AIMC to Watchlist: View: Get Complete AIMC Trend Analysis ➞ | |
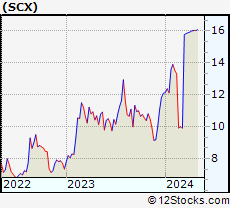 | SCX The L.S. Starrett Company |
| Sector: Industrials | |
| SubSector: Small Tools & Accessories | |
| MarketCap: 240.356 Millions | |
| Recent Price: 31.50 Smart Investing & Trading Score: 80 | |
| Day Percent Change: 0.864553% Day Change: -9999 | |
| Week Change: 94.8052% Year-to-date Change: 0.0% | |
| SCX Links: Profile News Message Board | |
| Charts:- Daily , Weekly | |
| Add SCX to Watchlist: View: Get Complete SCX Trend Analysis ➞ | |
 | AEGN Aegion Corporation |
| Sector: Industrials | |
| SubSector: Heavy Construction | |
| MarketCap: 473.995 Millions | |
| Recent Price: 56.07 Smart Investing & Trading Score: 70 | |
| Day Percent Change: -0.953895% Day Change: -9999 | |
| Week Change: 86.9623% Year-to-date Change: 0.0% | |
| AEGN Links: Profile News Message Board | |
| Charts:- Daily , Weekly | |
| Add AEGN to Watchlist: View: Get Complete AEGN Trend Analysis ➞ | |
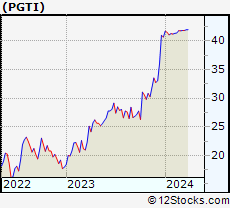 | PGTI PGT Innovations, Inc. |
| Sector: Industrials | |
| SubSector: General Building Materials | |
| MarketCap: 583.653 Millions | |
| Recent Price: 69.39 Smart Investing & Trading Score: 70 | |
| Day Percent Change: -0.0432152% Day Change: -9999 | |
| Week Change: 65.2536% Year-to-date Change: 0.0% | |
| PGTI Links: Profile News Message Board | |
| Charts:- Daily , Weekly | |
| Add PGTI to Watchlist: View: Get Complete PGTI Trend Analysis ➞ | |
 | CBPX Continental Building Products, Inc. |
| Sector: Industrials | |
| SubSector: General Building Materials | |
| MarketCap: 1037.76 Millions | |
| Recent Price: 77.44 Smart Investing & Trading Score: 80 | |
| Day Percent Change: 1.56066% Day Change: -9999 | |
| Week Change: 56.3181% Year-to-date Change: 0.0% | |
| CBPX Links: Profile News Message Board | |
| Charts:- Daily , Weekly | |
| Add CBPX to Watchlist: View: Get Complete CBPX Trend Analysis ➞ | |
 | BW Babcock & Wilcox Enterprises Inc |
| Sector: Industrials | |
| SubSector: Specialty Industrial Machinery | |
| MarketCap: 215.34 Millions | |
| Recent Price: 3.08 Smart Investing & Trading Score: 90 | |
| Day Percent Change: -3.75% Day Change: 0.12 | |
| Week Change: 53.2338% Year-to-date Change: 78.0% | |
| BW Links: Profile News Message Board | |
| Charts:- Daily , Weekly | |
| Add BW to Watchlist: View: Get Complete BW Trend Analysis ➞ | |
 | NCS NCI Building Systems, Inc. |
| Sector: Industrials | |
| SubSector: General Building Materials | |
| MarketCap: 1126.84 Millions | |
| Recent Price: 26.66 Smart Investing & Trading Score: 80 | |
| Day Percent Change: -0.633619% Day Change: -9999 | |
| Week Change: 50.6215% Year-to-date Change: 0.0% | |
| NCS Links: Profile News Message Board | |
| Charts:- Daily , Weekly | |
| Add NCS to Watchlist: View: Get Complete NCS Trend Analysis ➞ | |
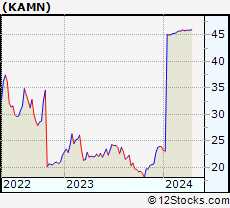 | KAMN Kaman Corporation |
| Sector: Industrials | |
| SubSector: Aerospace/Defense Products & Services | |
| MarketCap: 1154.01 Millions | |
| Recent Price: 68.05 Smart Investing & Trading Score: 70 | |
| Day Percent Change: -0.77282% Day Change: -9999 | |
| Week Change: 48.354% Year-to-date Change: 0.0% | |
| KAMN Links: Profile News Message Board | |
| Charts:- Daily , Weekly | |
| Add KAMN to Watchlist: View: Get Complete KAMN Trend Analysis ➞ | |
 | BE Bloom Energy Corp |
| Sector: Industrials | |
| SubSector: Electrical Equipment & Parts | |
| MarketCap: 13354.3 Millions | |
| Recent Price: 79.67 Smart Investing & Trading Score: 100 | |
| Day Percent Change: 8.70514% Day Change: 0.32 | |
| Week Change: 44.8545% Year-to-date Change: 240.9% | |
| BE Links: Profile News Message Board | |
| Charts:- Daily , Weekly | |
| Add BE to Watchlist: View: Get Complete BE Trend Analysis ➞ | |
 | PGEM Ply Gem Holdings, Inc |
| Sector: Industrials | |
| SubSector: General Building Materials | |
| MarketCap: 1251.83 Millions | |
| Recent Price: 128.45 Smart Investing & Trading Score: 80 | |
| Day Percent Change: 0.61095% Day Change: -9999 | |
| Week Change: 41.4648% Year-to-date Change: 0.0% | |
| PGEM Links: Profile News Message Board | |
| Charts:- Daily , Weekly | |
| Add PGEM to Watchlist: View: Get Complete PGEM Trend Analysis ➞ | |
 | EAF GrafTech International Ltd |
| Sector: Industrials | |
| SubSector: Electrical Equipment & Parts | |
| MarketCap: 256.09 Millions | |
| Recent Price: 12.05 Smart Investing & Trading Score: 100 | |
| Day Percent Change: 11.9888% Day Change: -0.07 | |
| Week Change: 41.2661% Year-to-date Change: 600.6% | |
| EAF Links: Profile News Message Board | |
| Charts:- Daily , Weekly | |
| Add EAF to Watchlist: View: Get Complete EAF Trend Analysis ➞ | |
 | PLUG Plug Power Inc |
| Sector: Industrials | |
| SubSector: Electrical Equipment & Parts | |
| MarketCap: 1686.07 Millions | |
| Recent Price: 2.02 Smart Investing & Trading Score: 100 | |
| Day Percent Change: 1% Day Change: 0.02 | |
| Week Change: 40.2778% Year-to-date Change: -13.3% | |
| PLUG Links: Profile News Message Board | |
| Charts:- Daily , Weekly | |
| Add PLUG to Watchlist: View: Get Complete PLUG Trend Analysis ➞ | |
 | RTN Raytheon Company |
| Sector: Industrials | |
| SubSector: Aerospace/Defense Products & Services | |
| MarketCap: 37597 Millions | |
| Recent Price: 273.36 Smart Investing & Trading Score: 80 | |
| Day Percent Change: 0.249377% Day Change: -9999 | |
| Week Change: 38.966% Year-to-date Change: 0.0% | |
| RTN Links: Profile News Message Board | |
| Charts:- Daily , Weekly | |
| Add RTN to Watchlist: View: Get Complete RTN Trend Analysis ➞ | |
 | BLDP Ballard Power Systems Inc |
| Sector: Industrials | |
| SubSector: Specialty Industrial Machinery | |
| MarketCap: 598.15 Millions | |
| Recent Price: 2.52 Smart Investing & Trading Score: 100 | |
| Day Percent Change: 14.5455% Day Change: -0.01 | |
| Week Change: 33.3333% Year-to-date Change: 37.0% | |
| BLDP Links: Profile News Message Board | |
| Charts:- Daily , Weekly | |
| Add BLDP to Watchlist: View: Get Complete BLDP Trend Analysis ➞ | |
 | ESGL ESGL Holdings Ltd |
| Sector: Industrials | |
| SubSector: Waste Management | |
| MarketCap: 157.21 Millions | |
| Recent Price: 3.56 Smart Investing & Trading Score: 80 | |
| Day Percent Change: -3.56911% Day Change: -9996.36 | |
| Week Change: 33.2697% Year-to-date Change: 170.6% | |
| ESGL Links: Profile News Message Board | |
| Charts:- Daily , Weekly | |
| Add ESGL to Watchlist: View: Get Complete ESGL Trend Analysis ➞ | |
| For tabular summary view of above stock list: Summary View ➞ 0 - 25 , 25 - 50 , 50 - 75 , 75 - 100 , 100 - 125 , 125 - 150 , 150 - 175 , 175 - 200 , 200 - 225 , 225 - 250 , 250 - 275 , 275 - 300 , 300 - 325 , 325 - 350 , 350 - 375 , 375 - 400 , 400 - 425 , 425 - 450 , 450 - 475 , 475 - 500 , 500 - 525 | ||
| Click To Change The Sort Order: By Market Cap or Company Size Performance: Year-to-date, Week and Day | |
| Select Chart Type: | ||
|
Best Stocks Today 12Stocks.com |
© 2025 12Stocks.com Terms & Conditions Privacy Contact Us
All Information Provided Only For Education And Not To Be Used For Investing or Trading. See Terms & Conditions


One More Thing ... Get Best Stocks Delivered Daily!
Never Ever Miss A Move With Our Top Ten Stocks Lists
Find Best Stocks In Any Market - Bull or Bear Market
Take A Peek At Our Top Ten Stocks Lists: Daily, Weekly, Year-to-Date & Top Trends
Find Best Stocks In Any Market - Bull or Bear Market
Take A Peek At Our Top Ten Stocks Lists: Daily, Weekly, Year-to-Date & Top Trends
Industrial Stocks With Best Up Trends [0-bearish to 100-bullish]: Brooge [100], Ballard Power[100], GrafTech [100], Bloom Energy[100], American Superconductor[100], PICO [100], Seanergy Maritime[100], nVent Electric[100], Acco Brands[100], Mastec [100], Controladora Vuela[100]
Best Industrial Stocks Year-to-Date:
Triumph [1281.83%], GrafTech [600.581%], Tecogen [486.452%], Power [247.28%], Bloom Energy[240.907%], Lightbridge Corp[189.608%], Kratos Defense[187.111%], Willdan [170.86%], ESGL [170.593%], Tutor Perini[163.328%], Planet Labs[157.683%] Best Industrial Stocks This Week:
TRC [10149.1%], Advanced Emissions[3571.78%], L3 Technologies[1915.25%], Forterra [1845.47%], KLX [437.488%], Allegro Merger[402.182%], LMI Aerospace[291.621%], Chicago Bridge[205.472%], Covanta Holding[148.617%], MOOG [148.377%], Altra [103.372%] Best Industrial Stocks Daily:
Brooge [29.5547%], Ballard Power[14.5455%], GrafTech [11.9888%], Tecogen [10.989%], B/E Aerospace[8.86381%], Bloom Energy[8.70514%], American Superconductor[7.043%], Ads-Tec Energy[5.48272%], Planet Labs[4.92308%], Hertz Global[4.85%], William Lyon[4.78516%]