
 Login Sign Up


| |||||
 |  | ||||

| 12Stocks.com Market Intelligence |
Best Healthcare Stocks
 | "Discover best trending healthcare stocks with 12Stocks.com." |
| - Subu Vdaygiri, Founder, 12Stocks.com |
| In a hurry? Healthcare Stocks Lists: Performance Trends Table, Stock Charts
Sort Healthcare stocks: Daily, Weekly, Year-to-Date, Market Cap & Trends. Filter Healthcare stocks list by size:All Healthcare Large Mid-Range Small |
| 12Stocks.com Healthcare Stocks Performances & Trends Daily | |||||||||
|
|  The overall Smart Investing & Trading Score is 43 (0-bearish to 100-bullish) which puts Healthcare sector in short term neutral trend. The Smart Investing & Trading Score from previous trading session is 67 and hence a deterioration of trend.
| ||||||||
Here are the Smart Investing & Trading Scores of the most requested Healthcare stocks at 12Stocks.com (click stock name for detailed review):
|


| 12Stocks.com: Investing in Healthcare sector with Stocks | |
|
The following table helps investors and traders sort through current performance and trends (as measured by Smart Investing & Trading Score) of various
stocks in the Healthcare sector. Quick View: Move mouse or cursor over stock symbol (ticker) to view short-term Technical chart and over stock name to view long term chart. Click on  to add stock symbol to your watchlist and to add stock symbol to your watchlist and  to view watchlist. Click on any ticker or stock name for detailed market intelligence report for that stock. to view watchlist. Click on any ticker or stock name for detailed market intelligence report for that stock. |
12Stocks.com Performance of Stocks in Healthcare Sector
| Ticker | Stock Name | Watchlist | Category | Recent Price | Smart Investing & Trading Score | Change % | YTD Change% |
| AGEN | Agenus |   | Biotechnology | 7.06 | 100 | 19.26 | 157.66% |
| CCCC | C4 | | Biotechnology | 2.23 | 100 | 12.06 | -38.06% |
| HROW | Harrow Health | | Pharmaceutical | 34.93 | 100 | 11.35 | 4.11% |
| LUNG | Pulmonx | | Medical Devices | 2.90 | 64 | 9.43 | -57.29% |
| ABOS | Acumen | | Biotechnology | 1.40 | 100 | 7.69 | -18.60% |
| OMER | Omeros | | Biotechnology | 3.65 | 64 | 5.49 | -63.06% |
| STTK | Shattuck Labs | | Biotechnology | 0.82 | 35 | 5.32 | -32.60% |
| BDTX | Black Diamond | | Biotechnology | 2.87 | 100 | 4.74 | 34.11% |
| NAUT | Nautilus Biotechnology | | Biotechnology | 0.78 | 68 | 3.92 | -53.48% |
| SVRA | Savara | | Biotechnology | 2.39 | 74 | 3.91 | -22.15% |
| INBX | Inhibrx | | Biotechnology | 21.77 | 100 | 3.77 | 41.36% |
| BMEA | Biomea Fusion | | Biotechnology | 2.00 | 67 | 3.63 | -48.45% |
| GBIO | Generation Bio | | Biotechnology | 0.39 | 69 | 3.62 | -63.55% |
| IMVT | Immunovant | | Biotechnology | 18.13 | 100 | 3.60 | -26.81% |
| TSHA | Taysha Gene | | Biotechnology | 2.64 | 85 | 3.53 | 52.60% |
| VERU | Veru | | Pharmaceutical | 0.60 | 58 | 2.97 | -7.69% |
| SANA | Sana Biotechnology | | Biotechnology | 4.18 | 100 | 2.96 | 156.44% |
| BKD | Brookdale Senior | | Long-Term | 7.93 | 100 | 2.45 | 57.65% |
| GALT | Galectin | | Biotechnology | 2.51 | 93 | 2.45 | 94.57% |
| TRVI | Trevi | | Biotechnology | 6.55 | 69 | 2.18 | 58.98% |
| ETNB | 89bio | | Biotechnology | 11.00 | 100 | 2.04 | 40.66% |
| MGNX | MacroGenics | | Biotechnology | 1.61 | 67 | 1.90 | -50.46% |
| REPL | Replimune | | Biotechnology | 10.97 | 100 | 1.86 | -9.41% |
| NKTX | Nkarta | | Biotechnology | 1.83 | 69 | 1.67 | -26.51% |
| OSUR | OraSure Technologies | | Instruments | 3.10 | 100 | 1.64 | -14.13% |
| For chart view version of above stock list: Chart View ➞ 0 - 25 , 25 - 50 , 50 - 75 , 75 - 100 , 100 - 125 , 125 - 150 , 150 - 175 , 175 - 200 , 200 - 225 , 225 - 250 , 250 - 275 , 275 - 300 , 300 - 325 , 325 - 350 , 350 - 375 , 375 - 400 , 400 - 425 | ||
 | Click To Change The Sort Order: By Market Cap or Company Size Performance: Year-to-date, Week and Day |  |
|
Get the most comprehensive stock market coverage daily at 12Stocks.com ➞ Best Stocks Today ➞ Best Stocks Weekly ➞ Best Stocks Year-to-Date ➞ Best Stocks Trends ➞  Best Stocks Today 12Stocks.com Best Nasdaq Stocks ➞ Best S&P 500 Stocks ➞ Best Tech Stocks ➞ Best Biotech Stocks ➞ |
| Detailed Overview of Healthcare Stocks |
| Healthcare Technical Overview, Leaders & Laggards, Top Healthcare ETF Funds & Detailed Healthcare Stocks List, Charts, Trends & More |
| Healthcare Sector: Technical Analysis, Trends & YTD Performance | |
| Healthcare sector is composed of stocks
from pharmaceutical, biotech, diagnostics labs, insurance providers
and healthcare services. Healthcare sector, as represented by XLV, an exchange-traded fund [ETF] that holds basket of Healthcare stocks (e.g, Merck, Amgen) is down by -1.35% and is currently underperforming the overall market by -7.66% year-to-date. Below is a quick view of Technical charts and trends: |
|
 XLV Weekly Chart |
|
| Long Term Trend: Not Good | |
| Medium Term Trend: Very Good | |
 XLV Daily Chart |
|
| Short Term Trend: Good | |
| Overall Trend Score: 43 | |
| YTD Performance: -1.35% | |
| **Trend Scores & Views Are Only For Educational Purposes And Not For Investing | |
| 12Stocks.com: Top Performing Healthcare Sector Stocks | ||||||||||||||||||||||||||||||||||||||||||||||||
 The top performing Healthcare sector stocks year to date are
Now, more recently, over last week, the top performing Healthcare sector stocks on the move are


|
||||||||||||||||||||||||||||||||||||||||||||||||
| 12Stocks.com: Investing in Healthcare Sector using Exchange Traded Funds | |
|
The following table shows list of key exchange traded funds (ETF) that
help investors track Healthcare Index. For detailed view, check out our ETF Funds section of our website. Quick View: Move mouse or cursor over ETF symbol (ticker) to view short-term Technical chart and over ETF name to view long term chart. Click on ticker or stock name for detailed view. Click on to add stock symbol to your watchlist and to view watchlist. |
12Stocks.com List of ETFs that track Healthcare Index
| Ticker | ETF Name | Watchlist | Recent Price | Smart Investing & Trading Score | Change % | Week % | Year-to-date % |
| XLV | Health Care | | 135.19 | 43 | -0.83 | -0.23 | -1.35% |
| IBB | Biotechnology | | 131.59 | 83 | -1.54 | 1.22 | -0.38% |
| BBH | Biotech | | 158.22 | 76 | -1.81 | 0.33 | 0.8% |
| IHF | Healthcare Providers | | 45.22 | 0 | -0.83 | -2.67 | -5.58% |
| BIB | Biotechnology | | 49.72 | 83 | -3.14 | 2.85 | -1.61% |
| BIS | Short Biotech | | 16.23 | 17 | 3.18 | -3.05 | -10.09% |
| CURE | Healthcare Bull 3X | | 79.00 | 43 | -2.64 | -0.92 | -14.13% |
| RXL | Health Care | | 40.71 | 43 | -1.74 | -0.76 | -7.2% |
| RXD | Short Health Care | | 12.09 | 58 | 1.76 | 0.91 | 2.18% |
| 12Stocks.com: Charts, Trends, Fundamental Data and Performances of Healthcare Stocks | |
|
We now take in-depth look at all Healthcare stocks including charts, multi-period performances and overall trends (as measured by Smart Investing & Trading Score). One can sort Healthcare stocks (click link to choose) by Daily, Weekly and by Year-to-Date performances. Also, one can sort by size of the company or by market capitalization. |
| Select Your Default Chart Type: | |||||
| |||||
| Click on stock symbol or name for detailed view. Click on to add stock symbol to your watchlist and to view watchlist. Quick View: Move mouse or cursor over "Daily" to quickly view daily Technical stock chart and over "Weekly" to view weekly Technical stock chart. | |||||

 | AGEN Agenus Inc. |
| Sector: Health Care | |
| SubSector: Biotechnology | |
| MarketCap: 274.885 Millions | |
| Recent Price: 7.06 Smart Investing & Trading Score: 100 | |
| Day Percent Change: 19.26% Day Change: 1.14 | |
| Week Change: 16.31% Year-to-date Change: 157.7% | |
| AGEN Links: Profile News Message Board | |
| Charts:- Daily , Weekly | |
| Add AGEN to Watchlist: View: Get Complete AGEN Trend Analysis ➞ | |
 | CCCC C4 Therapeutics, Inc. |
| Sector: Health Care | |
| SubSector: Biotechnology | |
| MarketCap: 12587 Millions | |
| Recent Price: 2.23 Smart Investing & Trading Score: 100 | |
| Day Percent Change: 12.06% Day Change: 0.24 | |
| Week Change: 50.68% Year-to-date Change: -38.1% | |
| CCCC Links: Profile News Message Board | |
| Charts:- Daily , Weekly | |
| Add CCCC to Watchlist: View: Get Complete CCCC Trend Analysis ➞ | |
 | HROW Harrow Health, Inc. |
| Sector: Health Care | |
| SubSector: Drug Manufacturers - Other | |
| MarketCap: 104.033 Millions | |
| Recent Price: 34.93 Smart Investing & Trading Score: 100 | |
| Day Percent Change: 11.35% Day Change: 3.56 | |
| Week Change: 10.02% Year-to-date Change: 4.1% | |
| HROW Links: Profile News Message Board | |
| Charts:- Daily , Weekly | |
| Add HROW to Watchlist: View: Get Complete HROW Trend Analysis ➞ | |
 | LUNG Pulmonx Corporation |
| Sector: Health Care | |
| SubSector: Medical Devices | |
| MarketCap: 18187 Millions | |
| Recent Price: 2.90 Smart Investing & Trading Score: 64 | |
| Day Percent Change: 9.43% Day Change: 0.25 | |
| Week Change: 4.32% Year-to-date Change: -57.3% | |
| LUNG Links: Profile News Message Board | |
| Charts:- Daily , Weekly | |
| Add LUNG to Watchlist: View: Get Complete LUNG Trend Analysis ➞ | |
 | ABOS Acumen Pharmaceuticals, Inc. |
| Sector: Health Care | |
| SubSector: Biotechnology | |
| MarketCap: 199 Millions | |
| Recent Price: 1.40 Smart Investing & Trading Score: 100 | |
| Day Percent Change: 7.69% Day Change: 0.1 | |
| Week Change: 20.69% Year-to-date Change: -18.6% | |
| ABOS Links: Profile News Message Board | |
| Charts:- Daily , Weekly | |
| Add ABOS to Watchlist: View: Get Complete ABOS Trend Analysis ➞ | |
 | OMER Omeros Corporation |
| Sector: Health Care | |
| SubSector: Biotechnology | |
| MarketCap: 759.585 Millions | |
| Recent Price: 3.65 Smart Investing & Trading Score: 64 | |
| Day Percent Change: 5.49% Day Change: 0.19 | |
| Week Change: 14.06% Year-to-date Change: -63.1% | |
| OMER Links: Profile News Message Board | |
| Charts:- Daily , Weekly | |
| Add OMER to Watchlist: View: Get Complete OMER Trend Analysis ➞ | |
 | STTK Shattuck Labs, Inc. |
| Sector: Health Care | |
| SubSector: Biotechnology | |
| MarketCap: 16987 Millions | |
| Recent Price: 0.82 Smart Investing & Trading Score: 35 | |
| Day Percent Change: 5.32% Day Change: 0.04 | |
| Week Change: -2.15% Year-to-date Change: -32.6% | |
| STTK Links: Profile News Message Board | |
| Charts:- Daily , Weekly | |
| Add STTK to Watchlist: View: Get Complete STTK Trend Analysis ➞ | |
 | BDTX Black Diamond Therapeutics, Inc. |
| Sector: Health Care | |
| SubSector: Biotechnology | |
| MarketCap: 12587 Millions | |
| Recent Price: 2.87 Smart Investing & Trading Score: 100 | |
| Day Percent Change: 4.74% Day Change: 0.13 | |
| Week Change: 11.24% Year-to-date Change: 34.1% | |
| BDTX Links: Profile News Message Board | |
| Charts:- Daily , Weekly | |
| Add BDTX to Watchlist: View: Get Complete BDTX Trend Analysis ➞ | |
 | NAUT Nautilus Biotechnology, Inc. |
| Sector: Health Care | |
| SubSector: Biotechnology | |
| MarketCap: 458 Millions | |
| Recent Price: 0.78 Smart Investing & Trading Score: 68 | |
| Day Percent Change: 3.92% Day Change: 0.03 | |
| Week Change: -4.7% Year-to-date Change: -53.5% | |
| NAUT Links: Profile News Message Board | |
| Charts:- Daily , Weekly | |
| Add NAUT to Watchlist: View: Get Complete NAUT Trend Analysis ➞ | |
 | SVRA Savara Inc. |
| Sector: Health Care | |
| SubSector: Biotechnology | |
| MarketCap: 80.3785 Millions | |
| Recent Price: 2.39 Smart Investing & Trading Score: 74 | |
| Day Percent Change: 3.91% Day Change: 0.09 | |
| Week Change: 9.13% Year-to-date Change: -22.2% | |
| SVRA Links: Profile News Message Board | |
| Charts:- Daily , Weekly | |
| Add SVRA to Watchlist: View: Get Complete SVRA Trend Analysis ➞ | |
 | INBX Inhibrx, Inc. |
| Sector: Health Care | |
| SubSector: Biotechnology | |
| MarketCap: 14187 Millions | |
| Recent Price: 21.77 Smart Investing & Trading Score: 100 | |
| Day Percent Change: 3.77% Day Change: 0.79 | |
| Week Change: 33.31% Year-to-date Change: 41.4% | |
| INBX Links: Profile News Message Board | |
| Charts:- Daily , Weekly | |
| Add INBX to Watchlist: View: Get Complete INBX Trend Analysis ➞ | |
 | BMEA Biomea Fusion, Inc. |
| Sector: Health Care | |
| SubSector: Biotechnology | |
| MarketCap: 818 Millions | |
| Recent Price: 2.00 Smart Investing & Trading Score: 67 | |
| Day Percent Change: 3.63% Day Change: 0.07 | |
| Week Change: 20.48% Year-to-date Change: -48.5% | |
| BMEA Links: Profile News Message Board | |
| Charts:- Daily , Weekly | |
| Add BMEA to Watchlist: View: Get Complete BMEA Trend Analysis ➞ | |
 | GBIO Generation Bio Co. |
| Sector: Health Care | |
| SubSector: Biotechnology | |
| MarketCap: 17487 Millions | |
| Recent Price: 0.39 Smart Investing & Trading Score: 69 | |
| Day Percent Change: 3.62% Day Change: 0.01 | |
| Week Change: 12.65% Year-to-date Change: -63.6% | |
| GBIO Links: Profile News Message Board | |
| Charts:- Daily , Weekly | |
| Add GBIO to Watchlist: View: Get Complete GBIO Trend Analysis ➞ | |
 | IMVT Immunovant, Inc. |
| Sector: Health Care | |
| SubSector: Biotechnology | |
| MarketCap: 552.885 Millions | |
| Recent Price: 18.13 Smart Investing & Trading Score: 100 | |
| Day Percent Change: 3.6% Day Change: 0.63 | |
| Week Change: 6.96% Year-to-date Change: -26.8% | |
| IMVT Links: Profile News Message Board | |
| Charts:- Daily , Weekly | |
| Add IMVT to Watchlist: View: Get Complete IMVT Trend Analysis ➞ | |
 | TSHA Taysha Gene Therapies, Inc. |
| Sector: Health Care | |
| SubSector: Biotechnology | |
| MarketCap: 76487 Millions | |
| Recent Price: 2.64 Smart Investing & Trading Score: 85 | |
| Day Percent Change: 3.53% Day Change: 0.09 | |
| Week Change: 7.76% Year-to-date Change: 52.6% | |
| TSHA Links: Profile News Message Board | |
| Charts:- Daily , Weekly | |
| Add TSHA to Watchlist: View: Get Complete TSHA Trend Analysis ➞ | |
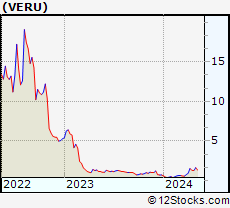 | VERU Veru Inc. |
| Sector: Health Care | |
| SubSector: Drug Manufacturers - Other | |
| MarketCap: 198.833 Millions | |
| Recent Price: 0.60 Smart Investing & Trading Score: 58 | |
| Day Percent Change: 2.97% Day Change: 0.02 | |
| Week Change: -1.01% Year-to-date Change: -7.7% | |
| VERU Links: Profile News Message Board | |
| Charts:- Daily , Weekly | |
| Add VERU to Watchlist: View: Get Complete VERU Trend Analysis ➞ | |
 | SANA Sana Biotechnology, Inc. |
| Sector: Health Care | |
| SubSector: Biotechnology | |
| MarketCap: 1210 Millions | |
| Recent Price: 4.18 Smart Investing & Trading Score: 100 | |
| Day Percent Change: 2.96% Day Change: 0.12 | |
| Week Change: 31.03% Year-to-date Change: 156.4% | |
| SANA Links: Profile News Message Board | |
| Charts:- Daily , Weekly | |
| Add SANA to Watchlist: View: Get Complete SANA Trend Analysis ➞ | |
 | BKD Brookdale Senior Living Inc. |
| Sector: Health Care | |
| SubSector: Long-Term Care Facilities | |
| MarketCap: 420.686 Millions | |
| Recent Price: 7.93 Smart Investing & Trading Score: 100 | |
| Day Percent Change: 2.45% Day Change: 0.19 | |
| Week Change: 15.94% Year-to-date Change: 57.7% | |
| BKD Links: Profile News Message Board | |
| Charts:- Daily , Weekly | |
| Add BKD to Watchlist: View: Get Complete BKD Trend Analysis ➞ | |
 | GALT Galectin Therapeutics, Inc. |
| Sector: Health Care | |
| SubSector: Biotechnology | |
| MarketCap: 114.185 Millions | |
| Recent Price: 2.51 Smart Investing & Trading Score: 93 | |
| Day Percent Change: 2.45% Day Change: 0.06 | |
| Week Change: 15.14% Year-to-date Change: 94.6% | |
| GALT Links: Profile News Message Board | |
| Charts:- Daily , Weekly | |
| Add GALT to Watchlist: View: Get Complete GALT Trend Analysis ➞ | |
 | TRVI Trevi Therapeutics, Inc. |
| Sector: Health Care | |
| SubSector: Biotechnology | |
| MarketCap: 50.6785 Millions | |
| Recent Price: 6.55 Smart Investing & Trading Score: 69 | |
| Day Percent Change: 2.18% Day Change: 0.14 | |
| Week Change: 10.08% Year-to-date Change: 59.0% | |
| TRVI Links: Profile News Message Board | |
| Charts:- Daily , Weekly | |
| Add TRVI to Watchlist: View: Get Complete TRVI Trend Analysis ➞ | |
 | ETNB 89bio, Inc. |
| Sector: Health Care | |
| SubSector: Biotechnology | |
| MarketCap: 517.485 Millions | |
| Recent Price: 11.00 Smart Investing & Trading Score: 100 | |
| Day Percent Change: 2.04% Day Change: 0.22 | |
| Week Change: 8.27% Year-to-date Change: 40.7% | |
| ETNB Links: Profile News Message Board | |
| Charts:- Daily , Weekly | |
| Add ETNB to Watchlist: View: Get Complete ETNB Trend Analysis ➞ | |
 | MGNX MacroGenics, Inc. |
| Sector: Health Care | |
| SubSector: Biotechnology | |
| MarketCap: 262.785 Millions | |
| Recent Price: 1.61 Smart Investing & Trading Score: 67 | |
| Day Percent Change: 1.9% Day Change: 0.03 | |
| Week Change: 10.27% Year-to-date Change: -50.5% | |
| MGNX Links: Profile News Message Board | |
| Charts:- Daily , Weekly | |
| Add MGNX to Watchlist: View: Get Complete MGNX Trend Analysis ➞ | |
 | REPL Replimune Group, Inc. |
| Sector: Health Care | |
| SubSector: Biotechnology | |
| MarketCap: 367.885 Millions | |
| Recent Price: 10.97 Smart Investing & Trading Score: 100 | |
| Day Percent Change: 1.86% Day Change: 0.2 | |
| Week Change: 16.7% Year-to-date Change: -9.4% | |
| REPL Links: Profile News Message Board | |
| Charts:- Daily , Weekly | |
| Add REPL to Watchlist: View: Get Complete REPL Trend Analysis ➞ | |
 | NKTX Nkarta, Inc. |
| Sector: Health Care | |
| SubSector: Biotechnology | |
| MarketCap: 23487 Millions | |
| Recent Price: 1.83 Smart Investing & Trading Score: 69 | |
| Day Percent Change: 1.67% Day Change: 0.03 | |
| Week Change: 4.57% Year-to-date Change: -26.5% | |
| NKTX Links: Profile News Message Board | |
| Charts:- Daily , Weekly | |
| Add NKTX to Watchlist: View: Get Complete NKTX Trend Analysis ➞ | |
 | OSUR OraSure Technologies, Inc. |
| Sector: Health Care | |
| SubSector: Medical Instruments & Supplies | |
| MarketCap: 468.26 Millions | |
| Recent Price: 3.10 Smart Investing & Trading Score: 100 | |
| Day Percent Change: 1.64% Day Change: 0.05 | |
| Week Change: 0.65% Year-to-date Change: -14.1% | |
| OSUR Links: Profile News Message Board | |
| Charts:- Daily , Weekly | |
| Add OSUR to Watchlist: View: Get Complete OSUR Trend Analysis ➞ | |
| For tabular summary view of above stock list: Summary View ➞ 0 - 25 , 25 - 50 , 50 - 75 , 75 - 100 , 100 - 125 , 125 - 150 , 150 - 175 , 175 - 200 , 200 - 225 , 225 - 250 , 250 - 275 , 275 - 300 , 300 - 325 , 325 - 350 , 350 - 375 , 375 - 400 , 400 - 425 | ||
| Click To Change The Sort Order: By Market Cap or Company Size Performance: Year-to-date, Week and Day | |
| Select Chart Type: | ||
|
Best Stocks Today 12Stocks.com |
© 2025 12Stocks.com Terms & Conditions Privacy Contact Us
All Information Provided Only For Education And Not To Be Used For Investing or Trading. See Terms & Conditions


One More Thing ... Get Best Stocks Delivered Daily!
Never Ever Miss A Move With Our Top Ten Stocks Lists
Find Best Stocks In Any Market - Bull or Bear Market
Take A Peek At Our Top Ten Stocks Lists: Daily, Weekly, Year-to-Date & Top Trends
Find Best Stocks In Any Market - Bull or Bear Market
Take A Peek At Our Top Ten Stocks Lists: Daily, Weekly, Year-to-Date & Top Trends
Healthcare Stocks With Best Up Trends [0-bearish to 100-bullish]: Agenus [100], C4 [100], Harrow Health[100], Acumen [100], Black Diamond[100], Inhibrx [100], Immunovant [100], Sana Biotechnology[100], Brookdale Senior[100], 89bio [100], Replimune [100]
Best Healthcare Stocks Year-to-Date:
Lyra [4088.47%], Nektar [2589.25%], Lyell Immunopharma[1423.44%], RAPT [435.44%], 908 Devices[215.45%], ProKidney [168.64%], Agenus [157.66%], Sana Biotechnology[156.44%], Editas Medicine[126.77%], Akebia [106.84%], Lineage Cell[104.98%] Best Healthcare Stocks This Week:
ProKidney [612.49%], C4 [50.68%], Prime Medicine[39.87%], Inhibrx [33.31%], Rhythm [31.82%], Ventyx Biosciences[31.73%], Sana Biotechnology[31.03%], Applied [29.34%], KalVista [21.2%], Acumen [20.69%], Biomea Fusion[20.48%] Best Healthcare Stocks Daily:
Agenus [19.26%], C4 [12.06%], Harrow Health[11.35%], Pulmonx [9.43%], Acumen [7.69%], Omeros [5.49%], Shattuck Labs[5.32%], Black Diamond[4.74%], Nautilus Biotechnology[3.92%], Inhibrx [3.77%], Biomea Fusion[3.63%]