
 Login Sign Up


| |||||
 |  | ||||

| 12Stocks.com Market Intelligence |
Best Healthcare Stocks
 | "Discover best trending healthcare stocks with 12Stocks.com." |
| - Subu Vdaygiri, Founder, 12Stocks.com |
| In a hurry? Healthcare Stocks Lists: Performance Trends Table, Stock Charts
Sort Healthcare stocks: Daily, Weekly, Year-to-Date, Market Cap & Trends. Filter Healthcare stocks list by size:All Healthcare Large Mid-Range Small |
| 12Stocks.com Healthcare Stocks Performances & Trends Daily | |||||||||
|
|  The overall Smart Investing & Trading Score is 100 (0-bearish to 100-bullish) which puts Healthcare sector in short term bullish trend. The Smart Investing & Trading Score from previous trading session is 70 and an improvement of trend continues.
| ||||||||
Here are the Smart Investing & Trading Scores of the most requested Healthcare stocks at 12Stocks.com (click stock name for detailed review):
|


| 12Stocks.com: Investing in Healthcare sector with Stocks | |
|
The following table helps investors and traders sort through current performance and trends (as measured by Smart Investing & Trading Score) of various
stocks in the Healthcare sector. Quick View: Move mouse or cursor over stock symbol (ticker) to view short-term Technical chart and over stock name to view long term chart. Click on  to add stock symbol to your watchlist and to add stock symbol to your watchlist and  to view watchlist. Click on any ticker or stock name for detailed market intelligence report for that stock. to view watchlist. Click on any ticker or stock name for detailed market intelligence report for that stock. |
12Stocks.com Performance of Stocks in Healthcare Sector
| Ticker | Stock Name | Watchlist | Category | Recent Price | Smart Investing & Trading Score | Change % | YTD Change% |
| INSM | Insmed |   | Biotechnology | 152.83 | 90 | 3.77% | 118.49% |
| RAPT | RAPT | | Biotechnology | 27.24 | 70 | 5.62% | 108.90% |
| RDUS | Radius Health | | Biotechnology | 30.00 | 70 | 0.00% | 105.79% |
| ACCD | Accolade | | Health Information | 7.02 | 60 | 0.00% | 105.26% |
| OLMA | Olema | | Biotechnology | 11.15 | 100 | 1.00% | 100.18% |
| ADCT | Adc | | Biotechnology | 3.98 | 80 | -0.50% | 99.00% |
| ALNY | Alnylam | | Biotechnology | 460.99 | 60 | 0.07% | 97.32% |
| ABCL | AbCellera Biologics | | Biotechnology | 5.97 | 100 | 0.25% | 97.19% |
| IONS | Ionis | | Biotechnology | 68.40 | 100 | 3.95% | 97.18% |
| OCGN | Ocugen | | Biotechnology | 1.77 | 100 | 5.36% | 96.67% |
| FULC | Fulcrum | | Biotechnology | 9.51 | 100 | 1.93% | 96.49% |
| STTK | Shattuck Labs | | Biotechnology | 2.37 | 90 | -0.42% | 95.87% |
| IRTC | iRhythm Technologies | | Medical Devices | 174.00 | 70 | 3.91% | 94.54% |
| GH | Guardant Health | | Diagnostics & Research | 61.49 | 40 | -1.85% | 93.55% |
| AVAH | Aveanna | | Medical Care Facilities | 8.66 | 50 | -3.56% | 92.02% |
| EQ | Equillium | | Biotechnology | 1.48 | 70 | -0.34% | 91.86% |
| PAHC | Phibro Animal | | Drug Manufacturers - Specialty & Generic | 39.03 | 40 | -4.34% | 90.16% |
| COGT | Cogent Biosciences | | Biotechnology | 14.77 | 100 | 4.53% | 89.36% |
| BBIO | BridgeBio Pharma | | Biotechnology | 53.28 | 90 | -0.37% | 88.94% |
| SPRO | Spero | | Biotechnology | 2.03 | 60 | 3.57% | 87.96% |
| KNSA | Kiniksa | | Drug Manufacturers - Specialty & Generic | 37.46 | 50 | -3.05% | 87.86% |
| ETNB | 89bio | | Biotechnology | 14.84 | 90 | 1.02% | 85.96% |
| CLLS | Cellectis ADR | | Biotechnology | 3.36 | 80 | 2.13% | 85.64% |
| VERV | Verve | | Biotechnology | 11.13 | 50 | 0.00% | 85.19% |
| ENTA | Enanta | | Biotechnology | 10.33 | 60 | -2.64% | 84.79% |
| For chart view version of above stock list: Chart View ➞ 0 - 25 , 25 - 50 , 50 - 75 , 75 - 100 , 100 - 125 , 125 - 150 , 150 - 175 , 175 - 200 , 200 - 225 , 225 - 250 , 250 - 275 , 275 - 300 , 300 - 325 , 325 - 350 , 350 - 375 , 375 - 400 , 400 - 425 , 425 - 450 , 450 - 475 , 475 - 500 , 500 - 525 , 525 - 550 , 550 - 575 , 575 - 600 , 600 - 625 , 625 - 650 , 650 - 675 , 675 - 700 , 700 - 725 , 725 - 750 , 750 - 775 , 775 - 800 , 800 - 825 , 825 - 850 , 850 - 875 , 875 - 900 , 900 - 925 , 925 - 950 , 950 - 975 , 975 - 1000 | ||
 | Click To Change The Sort Order: By Market Cap or Company Size Performance: Year-to-date, Week and Day |  |
|
Get the most comprehensive stock market coverage daily at 12Stocks.com ➞ Best Stocks Today ➞ Best Stocks Weekly ➞ Best Stocks Year-to-Date ➞ Best Stocks Trends ➞  Best Stocks Today 12Stocks.com Best Nasdaq Stocks ➞ Best S&P 500 Stocks ➞ Best Tech Stocks ➞ Best Biotech Stocks ➞ |
| Detailed Overview of Healthcare Stocks |
| Healthcare Technical Overview, Leaders & Laggards, Top Healthcare ETF Funds & Detailed Healthcare Stocks List, Charts, Trends & More |
| Healthcare Sector: Technical Analysis, Trends & YTD Performance | |
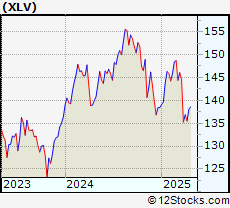
| Healthcare sector is composed of stocks
from pharmaceutical, biotech, diagnostics labs, insurance providers
and healthcare services. Healthcare sector, as represented by XLV, an exchange-traded fund [ETF] that holds basket of Healthcare stocks (e.g, Merck, Amgen) is up by 4.95646% and is currently underperforming the overall market by -9.80144% year-to-date. Below is a quick view of Technical charts and trends: |
|
 XLV Weekly Chart |
|
| Long Term Trend: Very Good | |
| Medium Term Trend: Very Good | |
 XLV Daily Chart |
|
| Short Term Trend: Very Good | |
| Overall Trend Score: 100 | |
| YTD Performance: 4.95646% | |
| **Trend Scores & Views Are Only For Educational Purposes And Not For Investing | |
| 12Stocks.com: Top Performing Healthcare Sector Stocks | ||||||||||||||||||||||||||||||||||||||||||||||
 The top performing Healthcare sector stocks year to date are
Now, more recently, over last week, the top performing Healthcare sector stocks on the move are


|
||||||||||||||||||||||||||||||||||||||||||||||
| 12Stocks.com: Investing in Healthcare Sector using Exchange Traded Funds | |
|
The following table shows list of key exchange traded funds (ETF) that
help investors track Healthcare Index. For detailed view, check out our ETF Funds section of our website. Quick View: Move mouse or cursor over ETF symbol (ticker) to view short-term Technical chart and over ETF name to view long term chart. Click on ticker or stock name for detailed view. Click on to add stock symbol to your watchlist and to view watchlist. |
12Stocks.com List of ETFs that track Healthcare Index
| Ticker | ETF Name | Watchlist | Recent Price | Smart Investing & Trading Score | Change % | Week % | Year-to-date % |
| BTEC | Principal Healthcare Innovators | | 39.49 | 30 | 0 | 1.02328 | 0% |
| 12Stocks.com: Charts, Trends, Fundamental Data and Performances of Healthcare Stocks | |
|
We now take in-depth look at all Healthcare stocks including charts, multi-period performances and overall trends (as measured by Smart Investing & Trading Score). One can sort Healthcare stocks (click link to choose) by Daily, Weekly and by Year-to-Date performances. Also, one can sort by size of the company or by market capitalization. |
| Select Your Default Chart Type: | |||||
| |||||
| Click on stock symbol or name for detailed view. Click on to add stock symbol to your watchlist and to view watchlist. Quick View: Move mouse or cursor over "Daily" to quickly view daily Technical stock chart and over "Weekly" to view weekly Technical stock chart. | |||||

 | INSM Insmed Inc |
| Sector: Health Care | |
| SubSector: Biotechnology | |
| MarketCap: 30670.5 Millions | |
| Recent Price: 152.83 Smart Investing & Trading Score: 90 | |
| Day Percent Change: 3.76833% Day Change: 3.15 | |
| Week Change: 8.39007% Year-to-date Change: 118.5% | |
| INSM Links: Profile News Message Board | |
| Charts:- Daily , Weekly | |
| Add INSM to Watchlist: View: Get Complete INSM Trend Analysis ➞ | |
 | RAPT RAPT Therapeutics Inc |
| Sector: Health Care | |
| SubSector: Biotechnology | |
| MarketCap: 213.83 Millions | |
| Recent Price: 27.24 Smart Investing & Trading Score: 70 | |
| Day Percent Change: 5.62233% Day Change: 0.4 | |
| Week Change: 29.9618% Year-to-date Change: 108.9% | |
| RAPT Links: Profile News Message Board | |
| Charts:- Daily , Weekly | |
| Add RAPT to Watchlist: View: Get Complete RAPT Trend Analysis ➞ | |
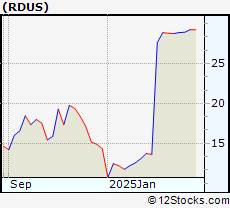 | RDUS Radius Health, Inc. |
| Sector: Health Care | |
| SubSector: Biotechnology | |
| MarketCap: 571.685 Millions | |
| Recent Price: 30.00 Smart Investing & Trading Score: 70 | |
| Day Percent Change: 0% Day Change: -9999 | |
| Week Change: 1.28292% Year-to-date Change: 105.8% | |
| RDUS Links: Profile News Message Board | |
| Charts:- Daily , Weekly | |
| Add RDUS to Watchlist: View: Get Complete RDUS Trend Analysis ➞ | |
 | ACCD Accolade, Inc. |
| Sector: Health Care | |
| SubSector: Health Information Services | |
| MarketCap: 32987 Millions | |
| Recent Price: 7.02 Smart Investing & Trading Score: 60 | |
| Day Percent Change: 0% Day Change: -9999 | |
| Week Change: 0.573066% Year-to-date Change: 105.3% | |
| ACCD Links: Profile News Message Board | |
| Charts:- Daily , Weekly | |
| Add ACCD to Watchlist: View: Get Complete ACCD Trend Analysis ➞ | |
 | OLMA Olema Pharmaceuticals Inc |
| Sector: Health Care | |
| SubSector: Biotechnology | |
| MarketCap: 570.35 Millions | |
| Recent Price: 11.15 Smart Investing & Trading Score: 100 | |
| Day Percent Change: 0.996377% Day Change: 0.09 | |
| Week Change: 33.5329% Year-to-date Change: 100.2% | |
| OLMA Links: Profile News Message Board | |
| Charts:- Daily , Weekly | |
| Add OLMA to Watchlist: View: Get Complete OLMA Trend Analysis ➞ | |
 | ADCT Adc Therapeutics SA |
| Sector: Health Care | |
| SubSector: Biotechnology | |
| MarketCap: 398.25 Millions | |
| Recent Price: 3.98 Smart Investing & Trading Score: 80 | |
| Day Percent Change: -0.5% Day Change: -0.01 | |
| Week Change: 11.7978% Year-to-date Change: 99.0% | |
| ADCT Links: Profile News Message Board | |
| Charts:- Daily , Weekly | |
| Add ADCT to Watchlist: View: Get Complete ADCT Trend Analysis ➞ | |
 | ALNY Alnylam Pharmaceuticals Inc |
| Sector: Health Care | |
| SubSector: Biotechnology | |
| MarketCap: 59247.7 Millions | |
| Recent Price: 460.99 Smart Investing & Trading Score: 60 | |
| Day Percent Change: 0.0738088% Day Change: -3.48 | |
| Week Change: 0.571591% Year-to-date Change: 97.3% | |
| ALNY Links: Profile News Message Board | |
| Charts:- Daily , Weekly | |
| Add ALNY to Watchlist: View: Get Complete ALNY Trend Analysis ➞ | |
 | ABCL AbCellera Biologics Inc |
| Sector: Health Care | |
| SubSector: Biotechnology | |
| MarketCap: 1261.07 Millions | |
| Recent Price: 5.97 Smart Investing & Trading Score: 100 | |
| Day Percent Change: 0.251678% Day Change: 0.13 | |
| Week Change: 25.2621% Year-to-date Change: 97.2% | |
| ABCL Links: Profile News Message Board | |
| Charts:- Daily , Weekly | |
| Add ABCL to Watchlist: View: Get Complete ABCL Trend Analysis ➞ | |
 | IONS Ionis Pharmaceuticals Inc |
| Sector: Health Care | |
| SubSector: Biotechnology | |
| MarketCap: 9759.53 Millions | |
| Recent Price: 68.40 Smart Investing & Trading Score: 100 | |
| Day Percent Change: 3.95137% Day Change: 1.93 | |
| Week Change: 6.94184% Year-to-date Change: 97.2% | |
| IONS Links: Profile News Message Board | |
| Charts:- Daily , Weekly | |
| Add IONS to Watchlist: View: Get Complete IONS Trend Analysis ➞ | |
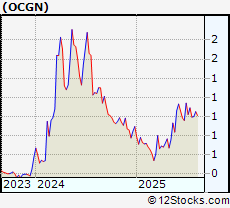 | OCGN Ocugen Inc |
| Sector: Health Care | |
| SubSector: Biotechnology | |
| MarketCap: 321.67 Millions | |
| Recent Price: 1.77 Smart Investing & Trading Score: 100 | |
| Day Percent Change: 5.35714% Day Change: 0 | |
| Week Change: 7.92683% Year-to-date Change: 96.7% | |
| OCGN Links: Profile News Message Board | |
| Charts:- Daily , Weekly | |
| Add OCGN to Watchlist: View: Get Complete OCGN Trend Analysis ➞ | |
 | FULC Fulcrum Therapeutics Inc |
| Sector: Health Care | |
| SubSector: Biotechnology | |
| MarketCap: 414.34 Millions | |
| Recent Price: 9.51 Smart Investing & Trading Score: 100 | |
| Day Percent Change: 1.92926% Day Change: -0.05 | |
| Week Change: 15.2727% Year-to-date Change: 96.5% | |
| FULC Links: Profile News Message Board | |
| Charts:- Daily , Weekly | |
| Add FULC to Watchlist: View: Get Complete FULC Trend Analysis ➞ | |
 | STTK Shattuck Labs Inc |
| Sector: Health Care | |
| SubSector: Biotechnology | |
| MarketCap: 74.25 Millions | |
| Recent Price: 2.37 Smart Investing & Trading Score: 90 | |
| Day Percent Change: -0.420168% Day Change: -0.12 | |
| Week Change: 0.851064% Year-to-date Change: 95.9% | |
| STTK Links: Profile News Message Board | |
| Charts:- Daily , Weekly | |
| Add STTK to Watchlist: View: Get Complete STTK Trend Analysis ➞ | |
 | IRTC iRhythm Technologies Inc |
| Sector: Health Care | |
| SubSector: Medical Devices | |
| MarketCap: 5816.73 Millions | |
| Recent Price: 174.00 Smart Investing & Trading Score: 70 | |
| Day Percent Change: 3.91162% Day Change: 3.48 | |
| Week Change: 0.0402461% Year-to-date Change: 94.5% | |
| IRTC Links: Profile News Message Board | |
| Charts:- Daily , Weekly | |
| Add IRTC to Watchlist: View: Get Complete IRTC Trend Analysis ➞ | |
 | GH Guardant Health Inc |
| Sector: Health Care | |
| SubSector: Diagnostics & Research | |
| MarketCap: 7498.56 Millions | |
| Recent Price: 61.49 Smart Investing & Trading Score: 40 | |
| Day Percent Change: -1.85156% Day Change: 2.78 | |
| Week Change: 6.62389% Year-to-date Change: 93.5% | |
| GH Links: Profile News Message Board | |
| Charts:- Daily , Weekly | |
| Add GH to Watchlist: View: Get Complete GH Trend Analysis ➞ | |
 | AVAH Aveanna Healthcare Holdings Inc |
| Sector: Health Care | |
| SubSector: Medical Care Facilities | |
| MarketCap: 1717.13 Millions | |
| Recent Price: 8.66 Smart Investing & Trading Score: 50 | |
| Day Percent Change: -3.56347% Day Change: -0.16 | |
| Week Change: 3.58852% Year-to-date Change: 92.0% | |
| AVAH Links: Profile News Message Board | |
| Charts:- Daily , Weekly | |
| Add AVAH to Watchlist: View: Get Complete AVAH Trend Analysis ➞ | |
 | EQ Equillium Inc |
| Sector: Health Care | |
| SubSector: Biotechnology | |
| MarketCap: 113.65 Millions | |
| Recent Price: 1.48 Smart Investing & Trading Score: 70 | |
| Day Percent Change: -0.337838% Day Change: 0.42 | |
| Week Change: 2.43056% Year-to-date Change: 91.9% | |
| EQ Links: Profile News Message Board | |
| Charts:- Daily , Weekly | |
| Add EQ to Watchlist: View: Get Complete EQ Trend Analysis ➞ | |
 | PAHC Phibro Animal Health Corp |
| Sector: Health Care | |
| SubSector: Drug Manufacturers - Specialty & Generic | |
| MarketCap: 1599.05 Millions | |
| Recent Price: 39.03 Smart Investing & Trading Score: 40 | |
| Day Percent Change: -4.33824% Day Change: 0.41 | |
| Week Change: 2.03922% Year-to-date Change: 90.2% | |
| PAHC Links: Profile News Message Board | |
| Charts:- Daily , Weekly | |
| Add PAHC to Watchlist: View: Get Complete PAHC Trend Analysis ➞ | |
 | COGT Cogent Biosciences Inc |
| Sector: Health Care | |
| SubSector: Biotechnology | |
| MarketCap: 1823.1 Millions | |
| Recent Price: 14.77 Smart Investing & Trading Score: 100 | |
| Day Percent Change: 4.52937% Day Change: -0.09 | |
| Week Change: 11.4717% Year-to-date Change: 89.4% | |
| COGT Links: Profile News Message Board | |
| Charts:- Daily , Weekly | |
| Add COGT to Watchlist: View: Get Complete COGT Trend Analysis ➞ | |
 | BBIO BridgeBio Pharma Inc |
| Sector: Health Care | |
| SubSector: Biotechnology | |
| MarketCap: 10204.6 Millions | |
| Recent Price: 53.28 Smart Investing & Trading Score: 90 | |
| Day Percent Change: -0.373972% Day Change: 1.35 | |
| Week Change: 5.1925% Year-to-date Change: 88.9% | |
| BBIO Links: Profile News Message Board | |
| Charts:- Daily , Weekly | |
| Add BBIO to Watchlist: View: Get Complete BBIO Trend Analysis ➞ | |
 | SPRO Spero Therapeutics Inc |
| Sector: Health Care | |
| SubSector: Biotechnology | |
| MarketCap: 120.99 Millions | |
| Recent Price: 2.03 Smart Investing & Trading Score: 60 | |
| Day Percent Change: 3.57143% Day Change: 0.03 | |
| Week Change: 3.04569% Year-to-date Change: 88.0% | |
| SPRO Links: Profile News Message Board | |
| Charts:- Daily , Weekly | |
| Add SPRO to Watchlist: View: Get Complete SPRO Trend Analysis ➞ | |
 | KNSA Kiniksa Pharmaceuticals International Plc |
| Sector: Health Care | |
| SubSector: Drug Manufacturers - Specialty & Generic | |
| MarketCap: 2646.38 Millions | |
| Recent Price: 37.46 Smart Investing & Trading Score: 50 | |
| Day Percent Change: -3.05383% Day Change: 0.37 | |
| Week Change: 3.79607% Year-to-date Change: 87.9% | |
| KNSA Links: Profile News Message Board | |
| Charts:- Daily , Weekly | |
| Add KNSA to Watchlist: View: Get Complete KNSA Trend Analysis ➞ | |
 | ETNB 89bio Inc |
| Sector: Health Care | |
| SubSector: Biotechnology | |
| MarketCap: 1315.49 Millions | |
| Recent Price: 14.84 Smart Investing & Trading Score: 90 | |
| Day Percent Change: 1.0211% Day Change: 0.09 | |
| Week Change: 0.952381% Year-to-date Change: 86.0% | |
| ETNB Links: Profile News Message Board | |
| Charts:- Daily , Weekly | |
| Add ETNB to Watchlist: View: Get Complete ETNB Trend Analysis ➞ | |
 | CLLS Cellectis ADR |
| Sector: Health Care | |
| SubSector: Biotechnology | |
| MarketCap: 193.2 Millions | |
| Recent Price: 3.36 Smart Investing & Trading Score: 80 | |
| Day Percent Change: 2.12766% Day Change: -0.05 | |
| Week Change: -3.17003% Year-to-date Change: 85.6% | |
| CLLS Links: Profile News Message Board | |
| Charts:- Daily , Weekly | |
| Add CLLS to Watchlist: View: Get Complete CLLS Trend Analysis ➞ | |
 | VERV Verve Therapeutics, Inc. |
| Sector: Health Care | |
| SubSector: Biotechnology | |
| MarketCap: 1200 Millions | |
| Recent Price: 11.13 Smart Investing & Trading Score: 50 | |
| Day Percent Change: 0% Day Change: -9999 | |
| Week Change: 1.64384% Year-to-date Change: 85.2% | |
| VERV Links: Profile News Message Board | |
| Charts:- Daily , Weekly | |
| Add VERV to Watchlist: View: Get Complete VERV Trend Analysis ➞ | |
 | ENTA Enanta Pharmaceuticals Inc |
| Sector: Health Care | |
| SubSector: Biotechnology | |
| MarketCap: 189.19 Millions | |
| Recent Price: 10.33 Smart Investing & Trading Score: 60 | |
| Day Percent Change: -2.63902% Day Change: -0.23 | |
| Week Change: 32.2663% Year-to-date Change: 84.8% | |
| ENTA Links: Profile News Message Board | |
| Charts:- Daily , Weekly | |
| Add ENTA to Watchlist: View: Get Complete ENTA Trend Analysis ➞ | |
| For tabular summary view of above stock list: Summary View ➞ 0 - 25 , 25 - 50 , 50 - 75 , 75 - 100 , 100 - 125 , 125 - 150 , 150 - 175 , 175 - 200 , 200 - 225 , 225 - 250 , 250 - 275 , 275 - 300 , 300 - 325 , 325 - 350 , 350 - 375 , 375 - 400 , 400 - 425 , 425 - 450 , 450 - 475 , 475 - 500 , 500 - 525 , 525 - 550 , 550 - 575 , 575 - 600 , 600 - 625 , 625 - 650 , 650 - 675 , 675 - 700 , 700 - 725 , 725 - 750 , 750 - 775 , 775 - 800 , 800 - 825 , 825 - 850 , 850 - 875 , 875 - 900 , 900 - 925 , 925 - 950 , 950 - 975 , 975 - 1000 | ||
| Click To Change The Sort Order: By Market Cap or Company Size Performance: Year-to-date, Week and Day | |
| Select Chart Type: | ||
|
Best Stocks Today 12Stocks.com |
© 2025 12Stocks.com Terms & Conditions Privacy Contact Us
All Information Provided Only For Education And Not To Be Used For Investing or Trading. See Terms & Conditions


One More Thing ... Get Best Stocks Delivered Daily!
Never Ever Miss A Move With Our Top Ten Stocks Lists
Find Best Stocks In Any Market - Bull or Bear Market
Take A Peek At Our Top Ten Stocks Lists: Daily, Weekly, Year-to-Date & Top Trends
Find Best Stocks In Any Market - Bull or Bear Market
Take A Peek At Our Top Ten Stocks Lists: Daily, Weekly, Year-to-Date & Top Trends
Healthcare Stocks With Best Up Trends [0-bearish to 100-bullish]: Taysha Gene[100], DBV Technologies[100], Valneva SE[100], ClearPoint Neuro[100], Prime Medicine[100], AlloVir [100], Sarepta [100], Monopar [100], Cara [100], Absci Corp[100], Spruce Biosciences[100]
Best Healthcare Stocks Year-to-Date:
Regencell Bioscience[12636.6%], Kaleido BioSciences[9900%], Vor Biopharma[3175%], Nanobiotix ADR[581.379%], Eagle [542.857%], So-Young [395.711%], I-Mab ADR[357.506%], Monopar [337.489%], Nektar [319.84%], 908 Devices[299.543%], DBV Technologies[276.923%] Best Healthcare Stocks This Week:
Athersys [193287%], Nobilis Health[101349%], VBI Vaccines[86898.5%], ContraFect [47677.8%], Clovis Oncology[39610.5%], Endo [28369.6%], NanoString Technologies[17224.7%], Neptune Wellness[14100%], ViewRay [11470.2%], Mallkrodt [11382.1%], Achillion [10033.3%] Best Healthcare Stocks Daily:
Kaleido BioSciences[9900%], Neoleukin [332.665%], Syros [226.23%], Athenex [103.333%], Taysha Gene[53.4591%], DBV Technologies[21.6485%], Valneva SE[20.197%], ClearPoint Neuro[19.7991%], Prime Medicine[19.4097%], Accelerate Diagnostics[17.6471%], Aptose Biosciences[17.5439%]