
 Login Sign Up


| |||||
 |  | ||||

| 12Stocks.com Market Intelligence |
Best Healthcare Stocks
 | "Discover best trending healthcare stocks with 12Stocks.com." |
| - Subu Vdaygiri, Founder, 12Stocks.com |
| In a hurry? Healthcare Stocks Lists: Performance Trends Table, Stock Charts
Sort Healthcare stocks: Daily, Weekly, Year-to-Date, Market Cap & Trends. Filter Healthcare stocks list by size:All Healthcare Large Mid-Range Small |
| 12Stocks.com Healthcare Stocks Performances & Trends Daily | |||||||||
|
|  The overall Smart Investing & Trading Score is 100 (0-bearish to 100-bullish) which puts Healthcare sector in short term bullish trend. The Smart Investing & Trading Score from previous trading session is 70 and an improvement of trend continues.
| ||||||||
Here are the Smart Investing & Trading Scores of the most requested Healthcare stocks at 12Stocks.com (click stock name for detailed review):
|


| 12Stocks.com: Investing in Healthcare sector with Stocks | |
|
The following table helps investors and traders sort through current performance and trends (as measured by Smart Investing & Trading Score) of various
stocks in the Healthcare sector. Quick View: Move mouse or cursor over stock symbol (ticker) to view short-term Technical chart and over stock name to view long term chart. Click on  to add stock symbol to your watchlist and to add stock symbol to your watchlist and  to view watchlist. Click on any ticker or stock name for detailed market intelligence report for that stock. to view watchlist. Click on any ticker or stock name for detailed market intelligence report for that stock. |
12Stocks.com Performance of Stocks in Healthcare Sector
| Ticker | Stock Name | Watchlist | Category | Recent Price | Smart Investing & Trading Score | Change % | Weekly Change% |
| EW | Edwards Lifesciences |   | Medical Devices | 76.65 | 20 | 0.45% | 2.67% |
| QGEN | Qiagen NV | | Diagnostics & Research | 46.24 | 70 | -0.17% | 2.60% |
| INCY | yte Corp | | Biotechnology | 86.30 | 90 | -0.46% | 2.54% |
| CAH | Cardinal Health | | Medical Distribution | 158.46 | 90 | 0.34% | 2.51% |
| IMNM | Immunome | | Biotechnology | 11.48 | 90 | 1.23% | 2.50% |
| EOLS | Evolus | | Drug Manufacturers - Specialty & Generic | 6.24 | 50 | 1.46% | 2.46% |
| EQ | Equillium | | Biotechnology | 1.48 | 70 | -0.34% | 2.43% |
| STAA | Staar Surgical | | Instruments | 27.42 | 80 | 0.88% | 2.43% |
| HCA | HCA | | Medical Care Facilities | 426.69 | 100 | 0.15% | 2.42% |
| THTX | Theratechnologies | | Biotechnology | 3.39 | 90 | 0.00% | 2.42% |
| CKPT | Checkpoint | | Biotechnology | 4.26 | 80 | 0.71% | 2.40% |
| BYSI | BeyondSpring | | Biotechnology | 1.73 | 0 | -3.35% | 2.37% |
| KERX | Keryx Bio | | Biotechnology | 14.32 | 70 | 0.28% | 2.29% |
| HOLX | Hologic | | Instruments | 67.90 | 70 | 1.28% | 2.26% |
| RNA | Avidity Biosciences | | Biotechnology | 44.19 | 50 | 2.76% | 2.26% |
| LNSR | LENSAR | | Medical Devices | 12.41 | 50 | 1.14% | 2.22% |
| SEM | Select | | Medical Care Facilities | 12.95 | 60 | 0.23% | 2.21% |
| PROK | ProKidney Corp | | Biotechnology | 2.78 | 80 | 6.92% | 2.21% |
| DMAC | DiaMedica | | Biotechnology | 7.00 | 60 | 2.04% | 2.19% |
| SLN | Silence | | Biotechnology | 5.25 | 30 | 2.94% | 2.14% |
| ENSG | Ensign | | Medical Care Facilities | 173.94 | 90 | -0.29% | 2.13% |
| TXG | 10x Genomics | | Health Information | 12.31 | 50 | -0.65% | 2.07% |
| JANX | Janux | | Biotechnology | 23.31 | 20 | -1.65% | 2.06% |
| GKOS | Glaukos | | Medical Devices | 84.49 | 70 | 1.56% | 2.05% |
| RPRX | Royalty Pharma | | Biotechnology | 36.50 | 60 | 0.50% | 2.04% |
| For chart view version of above stock list: Chart View ➞ 0 - 25 , 25 - 50 , 50 - 75 , 75 - 100 , 100 - 125 , 125 - 150 , 150 - 175 , 175 - 200 , 200 - 225 , 225 - 250 , 250 - 275 , 275 - 300 , 300 - 325 , 325 - 350 , 350 - 375 , 375 - 400 , 400 - 425 , 425 - 450 , 450 - 475 , 475 - 500 , 500 - 525 , 525 - 550 , 550 - 575 , 575 - 600 , 600 - 625 , 625 - 650 , 650 - 675 , 675 - 700 , 700 - 725 , 725 - 750 , 750 - 775 , 775 - 800 , 800 - 825 , 825 - 850 , 850 - 875 , 875 - 900 , 900 - 925 , 925 - 950 , 950 - 975 , 975 - 1000 | ||
 | Click To Change The Sort Order: By Market Cap or Company Size Performance: Year-to-date, Week and Day |  |
|
Get the most comprehensive stock market coverage daily at 12Stocks.com ➞ Best Stocks Today ➞ Best Stocks Weekly ➞ Best Stocks Year-to-Date ➞ Best Stocks Trends ➞  Best Stocks Today 12Stocks.com Best Nasdaq Stocks ➞ Best S&P 500 Stocks ➞ Best Tech Stocks ➞ Best Biotech Stocks ➞ |
| Detailed Overview of Healthcare Stocks |
| Healthcare Technical Overview, Leaders & Laggards, Top Healthcare ETF Funds & Detailed Healthcare Stocks List, Charts, Trends & More |
| Healthcare Sector: Technical Analysis, Trends & YTD Performance | |
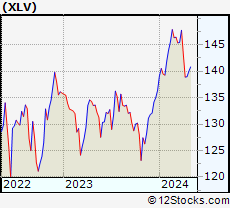
| Healthcare sector is composed of stocks
from pharmaceutical, biotech, diagnostics labs, insurance providers
and healthcare services. Healthcare sector, as represented by XLV, an exchange-traded fund [ETF] that holds basket of Healthcare stocks (e.g, Merck, Amgen) is up by 4.95646% and is currently underperforming the overall market by -9.80144% year-to-date. Below is a quick view of Technical charts and trends: |
|
 XLV Weekly Chart |
|
| Long Term Trend: Very Good | |
| Medium Term Trend: Very Good | |
 XLV Daily Chart |
|
| Short Term Trend: Very Good | |
| Overall Trend Score: 100 | |
| YTD Performance: 4.95646% | |
| **Trend Scores & Views Are Only For Educational Purposes And Not For Investing | |
| 12Stocks.com: Top Performing Healthcare Sector Stocks | ||||||||||||||||||||||||||||||||||||||||||||||
 The top performing Healthcare sector stocks year to date are
Now, more recently, over last week, the top performing Healthcare sector stocks on the move are


|
||||||||||||||||||||||||||||||||||||||||||||||
| 12Stocks.com: Investing in Healthcare Sector using Exchange Traded Funds | |
|
The following table shows list of key exchange traded funds (ETF) that
help investors track Healthcare Index. For detailed view, check out our ETF Funds section of our website. Quick View: Move mouse or cursor over ETF symbol (ticker) to view short-term Technical chart and over ETF name to view long term chart. Click on ticker or stock name for detailed view. Click on to add stock symbol to your watchlist and to view watchlist. |
12Stocks.com List of ETFs that track Healthcare Index
| Ticker | ETF Name | Watchlist | Recent Price | Smart Investing & Trading Score | Change % | Week % | Year-to-date % |
| BTEC | Principal Healthcare Innovators | | 39.49 | 30 | 0 | 1.02328 | 0% |
| 12Stocks.com: Charts, Trends, Fundamental Data and Performances of Healthcare Stocks | |
|
We now take in-depth look at all Healthcare stocks including charts, multi-period performances and overall trends (as measured by Smart Investing & Trading Score). One can sort Healthcare stocks (click link to choose) by Daily, Weekly and by Year-to-Date performances. Also, one can sort by size of the company or by market capitalization. |
| Select Your Default Chart Type: | |||||
| |||||
| Click on stock symbol or name for detailed view. Click on to add stock symbol to your watchlist and to view watchlist. Quick View: Move mouse or cursor over "Daily" to quickly view daily Technical stock chart and over "Weekly" to view weekly Technical stock chart. | |||||

 | EW Edwards Lifesciences Corp |
| Sector: Health Care | |
| SubSector: Medical Devices | |
| MarketCap: 47519.9 Millions | |
| Recent Price: 76.65 Smart Investing & Trading Score: 20 | |
| Day Percent Change: 0.445551% Day Change: 0.21 | |
| Week Change: 2.66542% Year-to-date Change: 5.6% | |
| EW Links: Profile News Message Board | |
| Charts:- Daily , Weekly | |
| Add EW to Watchlist: View: Get Complete EW Trend Analysis ➞ | |
 | QGEN Qiagen NV |
| Sector: Health Care | |
| SubSector: Diagnostics & Research | |
| MarketCap: 10297.2 Millions | |
| Recent Price: 46.24 Smart Investing & Trading Score: 70 | |
| Day Percent Change: -0.172712% Day Change: -0.11 | |
| Week Change: 2.59596% Year-to-date Change: 7.4% | |
| QGEN Links: Profile News Message Board | |
| Charts:- Daily , Weekly | |
| Add QGEN to Watchlist: View: Get Complete QGEN Trend Analysis ➞ | |
 | INCY Incyte Corp |
| Sector: Health Care | |
| SubSector: Biotechnology | |
| MarketCap: 16918.7 Millions | |
| Recent Price: 86.30 Smart Investing & Trading Score: 90 | |
| Day Percent Change: -0.461361% Day Change: -0.12 | |
| Week Change: 2.54278% Year-to-date Change: 24.1% | |
| INCY Links: Profile News Message Board | |
| Charts:- Daily , Weekly | |
| Add INCY to Watchlist: View: Get Complete INCY Trend Analysis ➞ | |
 | CAH Cardinal Health, Inc |
| Sector: Health Care | |
| SubSector: Medical Distribution | |
| MarketCap: 35714 Millions | |
| Recent Price: 158.46 Smart Investing & Trading Score: 90 | |
| Day Percent Change: 0.335592% Day Change: 0.17 | |
| Week Change: 2.51003% Year-to-date Change: 35.2% | |
| CAH Links: Profile News Message Board | |
| Charts:- Daily , Weekly | |
| Add CAH to Watchlist: View: Get Complete CAH Trend Analysis ➞ | |
 | IMNM Immunome Inc |
| Sector: Health Care | |
| SubSector: Biotechnology | |
| MarketCap: 915.71 Millions | |
| Recent Price: 11.48 Smart Investing & Trading Score: 90 | |
| Day Percent Change: 1.23457% Day Change: 0.38 | |
| Week Change: 2.5% Year-to-date Change: 9.0% | |
| IMNM Links: Profile News Message Board | |
| Charts:- Daily , Weekly | |
| Add IMNM to Watchlist: View: Get Complete IMNM Trend Analysis ➞ | |
 | EOLS Evolus Inc |
| Sector: Health Care | |
| SubSector: Drug Manufacturers - Specialty & Generic | |
| MarketCap: 495.49 Millions | |
| Recent Price: 6.24 Smart Investing & Trading Score: 50 | |
| Day Percent Change: 1.46341% Day Change: 0.19 | |
| Week Change: 2.46305% Year-to-date Change: -43.8% | |
| EOLS Links: Profile News Message Board | |
| Charts:- Daily , Weekly | |
| Add EOLS to Watchlist: View: Get Complete EOLS Trend Analysis ➞ | |
 | EQ Equillium Inc |
| Sector: Health Care | |
| SubSector: Biotechnology | |
| MarketCap: 113.65 Millions | |
| Recent Price: 1.48 Smart Investing & Trading Score: 70 | |
| Day Percent Change: -0.337838% Day Change: 0.42 | |
| Week Change: 2.43056% Year-to-date Change: 91.9% | |
| EQ Links: Profile News Message Board | |
| Charts:- Daily , Weekly | |
| Add EQ to Watchlist: View: Get Complete EQ Trend Analysis ➞ | |
 | STAA Staar Surgical Co |
| Sector: Health Care | |
| SubSector: Medical Instruments & Supplies | |
| MarketCap: 1384.51 Millions | |
| Recent Price: 27.42 Smart Investing & Trading Score: 80 | |
| Day Percent Change: 0.883002% Day Change: -0.2 | |
| Week Change: 2.42809% Year-to-date Change: 13.8% | |
| STAA Links: Profile News Message Board | |
| Charts:- Daily , Weekly | |
| Add STAA to Watchlist: View: Get Complete STAA Trend Analysis ➞ | |
 | HCA HCA Healthcare Inc |
| Sector: Health Care | |
| SubSector: Medical Care Facilities | |
| MarketCap: 98457.4 Millions | |
| Recent Price: 426.69 Smart Investing & Trading Score: 100 | |
| Day Percent Change: 0.145516% Day Change: 0.64 | |
| Week Change: 2.41707% Year-to-date Change: 43.9% | |
| HCA Links: Profile News Message Board | |
| Charts:- Daily , Weekly | |
| Add HCA to Watchlist: View: Get Complete HCA Trend Analysis ➞ | |
 | THTX Theratechnologies Inc |
| Sector: Health Care | |
| SubSector: Biotechnology | |
| MarketCap: 150.35 Millions | |
| Recent Price: 3.39 Smart Investing & Trading Score: 90 | |
| Day Percent Change: 0% Day Change: 0 | |
| Week Change: 2.41692% Year-to-date Change: 84.2% | |
| THTX Links: Profile News Message Board | |
| Charts:- Daily , Weekly | |
| Add THTX to Watchlist: View: Get Complete THTX Trend Analysis ➞ | |
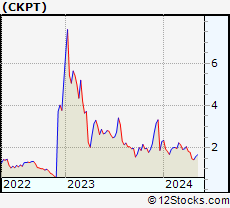 | CKPT Checkpoint Therapeutics, Inc. |
| Sector: Health Care | |
| SubSector: Biotechnology | |
| MarketCap: 78.4785 Millions | |
| Recent Price: 4.26 Smart Investing & Trading Score: 80 | |
| Day Percent Change: 0.70922% Day Change: -9999 | |
| Week Change: 2.40385% Year-to-date Change: 29.5% | |
| CKPT Links: Profile News Message Board | |
| Charts:- Daily , Weekly | |
| Add CKPT to Watchlist: View: Get Complete CKPT Trend Analysis ➞ | |
 | BYSI BeyondSpring Inc |
| Sector: Health Care | |
| SubSector: Biotechnology | |
| MarketCap: 75.02 Millions | |
| Recent Price: 1.73 Smart Investing & Trading Score: 0 | |
| Day Percent Change: -3.35196% Day Change: 0.04 | |
| Week Change: 2.36686% Year-to-date Change: 8.8% | |
| BYSI Links: Profile News Message Board | |
| Charts:- Daily , Weekly | |
| Add BYSI to Watchlist: View: Get Complete BYSI Trend Analysis ➞ | |
 | KERX Keryx Biopharmaceuticals, Inc. |
| Sector: Health Care | |
| SubSector: Biotechnology | |
| MarketCap: 606.8 Millions | |
| Recent Price: 14.32 Smart Investing & Trading Score: 70 | |
| Day Percent Change: 0.280112% Day Change: -9999 | |
| Week Change: 2.28571% Year-to-date Change: 0.0% | |
| KERX Links: Profile News Message Board | |
| Charts:- Daily , Weekly | |
| Add KERX to Watchlist: View: Get Complete KERX Trend Analysis ➞ | |
 | HOLX Hologic, Inc |
| Sector: Health Care | |
| SubSector: Medical Instruments & Supplies | |
| MarketCap: 14848.7 Millions | |
| Recent Price: 67.90 Smart Investing & Trading Score: 70 | |
| Day Percent Change: 1.28282% Day Change: 0.42 | |
| Week Change: 2.25904% Year-to-date Change: -5.4% | |
| HOLX Links: Profile News Message Board | |
| Charts:- Daily , Weekly | |
| Add HOLX to Watchlist: View: Get Complete HOLX Trend Analysis ➞ | |
 | RNA Avidity Biosciences Inc |
| Sector: Health Care | |
| SubSector: Biotechnology | |
| MarketCap: 6478.98 Millions | |
| Recent Price: 44.19 Smart Investing & Trading Score: 50 | |
| Day Percent Change: 2.75581% Day Change: 0.32 | |
| Week Change: 2.25642% Year-to-date Change: 41.7% | |
| RNA Links: Profile News Message Board | |
| Charts:- Daily , Weekly | |
| Add RNA to Watchlist: View: Get Complete RNA Trend Analysis ➞ | |
 | LNSR LENSAR Inc |
| Sector: Health Care | |
| SubSector: Medical Devices | |
| MarketCap: 145.25 Millions | |
| Recent Price: 12.41 Smart Investing & Trading Score: 50 | |
| Day Percent Change: 1.14099% Day Change: -0.08 | |
| Week Change: 2.22405% Year-to-date Change: 42.8% | |
| LNSR Links: Profile News Message Board | |
| Charts:- Daily , Weekly | |
| Add LNSR to Watchlist: View: Get Complete LNSR Trend Analysis ➞ | |
 | SEM Select Medical Holdings Corporation |
| Sector: Health Care | |
| SubSector: Medical Care Facilities | |
| MarketCap: 1624.26 Millions | |
| Recent Price: 12.95 Smart Investing & Trading Score: 60 | |
| Day Percent Change: 0.232198% Day Change: 0.06 | |
| Week Change: 2.20994% Year-to-date Change: -30.6% | |
| SEM Links: Profile News Message Board | |
| Charts:- Daily , Weekly | |
| Add SEM to Watchlist: View: Get Complete SEM Trend Analysis ➞ | |
 | PROK ProKidney Corp |
| Sector: Health Care | |
| SubSector: Biotechnology | |
| MarketCap: 662.14 Millions | |
| Recent Price: 2.78 Smart Investing & Trading Score: 80 | |
| Day Percent Change: 6.92308% Day Change: 0.04 | |
| Week Change: 2.20588% Year-to-date Change: 60.7% | |
| PROK Links: Profile News Message Board | |
| Charts:- Daily , Weekly | |
| Add PROK to Watchlist: View: Get Complete PROK Trend Analysis ➞ | |
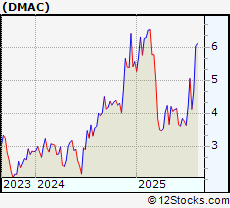 | DMAC DiaMedica Therapeutics Inc |
| Sector: Health Care | |
| SubSector: Biotechnology | |
| MarketCap: 317.37 Millions | |
| Recent Price: 7.00 Smart Investing & Trading Score: 60 | |
| Day Percent Change: 2.04082% Day Change: -0.07 | |
| Week Change: 2.18978% Year-to-date Change: 27.0% | |
| DMAC Links: Profile News Message Board | |
| Charts:- Daily , Weekly | |
| Add DMAC to Watchlist: View: Get Complete DMAC Trend Analysis ➞ | |
 | SLN Silence Therapeutics Plc ADR |
| Sector: Health Care | |
| SubSector: Biotechnology | |
| MarketCap: 268.74 Millions | |
| Recent Price: 5.25 Smart Investing & Trading Score: 30 | |
| Day Percent Change: 2.94118% Day Change: 0.13 | |
| Week Change: 2.14008% Year-to-date Change: -27.0% | |
| SLN Links: Profile News Message Board | |
| Charts:- Daily , Weekly | |
| Add SLN to Watchlist: View: Get Complete SLN Trend Analysis ➞ | |
 | ENSG Ensign Group Inc |
| Sector: Health Care | |
| SubSector: Medical Care Facilities | |
| MarketCap: 10039.2 Millions | |
| Recent Price: 173.94 Smart Investing & Trading Score: 90 | |
| Day Percent Change: -0.292347% Day Change: 0.23 | |
| Week Change: 2.12541% Year-to-date Change: 31.0% | |
| ENSG Links: Profile News Message Board | |
| Charts:- Daily , Weekly | |
| Add ENSG to Watchlist: View: Get Complete ENSG Trend Analysis ➞ | |
 | TXG 10x Genomics Inc |
| Sector: Health Care | |
| SubSector: Health Information Services | |
| MarketCap: 1737.89 Millions | |
| Recent Price: 12.31 Smart Investing & Trading Score: 50 | |
| Day Percent Change: -0.645682% Day Change: -0.01 | |
| Week Change: 2.07297% Year-to-date Change: -13.2% | |
| TXG Links: Profile News Message Board | |
| Charts:- Daily , Weekly | |
| Add TXG to Watchlist: View: Get Complete TXG Trend Analysis ➞ | |
 | JANX Janux Therapeutics Inc |
| Sector: Health Care | |
| SubSector: Biotechnology | |
| MarketCap: 1441.05 Millions | |
| Recent Price: 23.31 Smart Investing & Trading Score: 20 | |
| Day Percent Change: -1.64557% Day Change: -0.87 | |
| Week Change: 2.05779% Year-to-date Change: -56.2% | |
| JANX Links: Profile News Message Board | |
| Charts:- Daily , Weekly | |
| Add JANX to Watchlist: View: Get Complete JANX Trend Analysis ➞ | |
 | GKOS Glaukos Corporation |
| Sector: Health Care | |
| SubSector: Medical Devices | |
| MarketCap: 5387.46 Millions | |
| Recent Price: 84.49 Smart Investing & Trading Score: 70 | |
| Day Percent Change: 1.56269% Day Change: -1.15 | |
| Week Change: 2.05339% Year-to-date Change: -43.6% | |
| GKOS Links: Profile News Message Board | |
| Charts:- Daily , Weekly | |
| Add GKOS to Watchlist: View: Get Complete GKOS Trend Analysis ➞ | |
 | RPRX Royalty Pharma plc |
| Sector: Health Care | |
| SubSector: Biotechnology | |
| MarketCap: 21036.9 Millions | |
| Recent Price: 36.50 Smart Investing & Trading Score: 60 | |
| Day Percent Change: 0.495595% Day Change: 0.21 | |
| Week Change: 2.04082% Year-to-date Change: 43.4% | |
| RPRX Links: Profile News Message Board | |
| Charts:- Daily , Weekly | |
| Add RPRX to Watchlist: View: Get Complete RPRX Trend Analysis ➞ | |
| For tabular summary view of above stock list: Summary View ➞ 0 - 25 , 25 - 50 , 50 - 75 , 75 - 100 , 100 - 125 , 125 - 150 , 150 - 175 , 175 - 200 , 200 - 225 , 225 - 250 , 250 - 275 , 275 - 300 , 300 - 325 , 325 - 350 , 350 - 375 , 375 - 400 , 400 - 425 , 425 - 450 , 450 - 475 , 475 - 500 , 500 - 525 , 525 - 550 , 550 - 575 , 575 - 600 , 600 - 625 , 625 - 650 , 650 - 675 , 675 - 700 , 700 - 725 , 725 - 750 , 750 - 775 , 775 - 800 , 800 - 825 , 825 - 850 , 850 - 875 , 875 - 900 , 900 - 925 , 925 - 950 , 950 - 975 , 975 - 1000 | ||
| Click To Change The Sort Order: By Market Cap or Company Size Performance: Year-to-date, Week and Day | |
| Select Chart Type: | ||
|
Best Stocks Today 12Stocks.com |
© 2025 12Stocks.com Terms & Conditions Privacy Contact Us
All Information Provided Only For Education And Not To Be Used For Investing or Trading. See Terms & Conditions


One More Thing ... Get Best Stocks Delivered Daily!
Never Ever Miss A Move With Our Top Ten Stocks Lists
Find Best Stocks In Any Market - Bull or Bear Market
Take A Peek At Our Top Ten Stocks Lists: Daily, Weekly, Year-to-Date & Top Trends
Find Best Stocks In Any Market - Bull or Bear Market
Take A Peek At Our Top Ten Stocks Lists: Daily, Weekly, Year-to-Date & Top Trends
Healthcare Stocks With Best Up Trends [0-bearish to 100-bullish]: Taysha Gene[100], DBV Technologies[100], Valneva SE[100], ClearPoint Neuro[100], Prime Medicine[100], AlloVir [100], Sarepta [100], Monopar [100], Cara [100], Absci Corp[100], Spruce Biosciences[100]
Best Healthcare Stocks Year-to-Date:
Regencell Bioscience[12636.6%], Kaleido BioSciences[9900%], Vor Biopharma[3175%], Nanobiotix ADR[581.379%], Eagle [542.857%], So-Young [395.711%], I-Mab ADR[357.506%], Monopar [337.489%], Nektar [319.84%], 908 Devices[299.543%], DBV Technologies[276.923%] Best Healthcare Stocks This Week:
Athersys [193287%], Nobilis Health[101349%], VBI Vaccines[86898.5%], ContraFect [47677.8%], Clovis Oncology[39610.5%], Endo [28369.6%], NanoString Technologies[17224.7%], Neptune Wellness[14100%], ViewRay [11470.2%], Mallkrodt [11382.1%], Achillion [10033.3%] Best Healthcare Stocks Daily:
Kaleido BioSciences[9900%], Neoleukin [332.665%], Syros [226.23%], Athenex [103.333%], Taysha Gene[53.4591%], DBV Technologies[21.6485%], Valneva SE[20.197%], ClearPoint Neuro[19.7991%], Prime Medicine[19.4097%], Accelerate Diagnostics[17.6471%], Aptose Biosciences[17.5439%]