
 Login Sign Up


| |||||
 |  | ||||

| 12Stocks.com Market Intelligence |
Best Healthcare Stocks
 | "Discover best trending healthcare stocks with 12Stocks.com." |
| - Subu Vdaygiri, Founder, 12Stocks.com |
| In a hurry? Healthcare Stocks Lists: Performance Trends Table, Stock Charts
Sort Healthcare stocks: Daily, Weekly, Year-to-Date, Market Cap & Trends. Filter Healthcare stocks list by size:All Healthcare Large Mid-Range Small |
| 12Stocks.com Healthcare Stocks Performances & Trends Daily | |||||||||
|
|  The overall Smart Investing & Trading Score is 100 (0-bearish to 100-bullish) which puts Healthcare sector in short term bullish trend. The Smart Investing & Trading Score from previous trading session is 70 and an improvement of trend continues.
| ||||||||
Here are the Smart Investing & Trading Scores of the most requested Healthcare stocks at 12Stocks.com (click stock name for detailed review):
|


| 12Stocks.com: Investing in Healthcare sector with Stocks | |
|
The following table helps investors and traders sort through current performance and trends (as measured by Smart Investing & Trading Score) of various
stocks in the Healthcare sector. Quick View: Move mouse or cursor over stock symbol (ticker) to view short-term Technical chart and over stock name to view long term chart. Click on  to add stock symbol to your watchlist and to add stock symbol to your watchlist and  to view watchlist. Click on any ticker or stock name for detailed market intelligence report for that stock. to view watchlist. Click on any ticker or stock name for detailed market intelligence report for that stock. |
12Stocks.com Performance of Stocks in Healthcare Sector
| Ticker | Stock Name | Watchlist | Category | Recent Price | Smart Investing & Trading Score | Change % | YTD Change% |
| ZYME | Zymeworks BC |   | Biotechnology | 16.90 | 80 | -0.24% | 14.34% |
| STAA | Staar Surgical | | Instruments | 27.42 | 80 | 0.88% | 13.78% |
| SMMT | Summit | | Biotechnology | 20.87 | 40 | 1.85% | 13.73% |
| BNTC | Benitec Biopharma | | Biotechnology | 13.73 | 30 | -2.00% | 13.66% |
| SVRA | Savara | | Biotechnology | 3.48 | 40 | -1.55% | 13.52% |
| CARA | Cara | | Biotechnology | 18.25 | 100 | 14.34% | 13.49% |
| AIRS | Airsculpt Technologies | | Medical Care Facilities | 7.95 | 61 | -9.24% | 13.49% |
| SCLX | Scilex Holding | | Drug Manufacturers - General | 17.26 | 30 | -16.54% | 13.11% |
| TNYA | Tenaya | | Biotechnology | 1.60 | 80 | -4.46% | 13.03% |
| ATRC | Atricure | | Instruments | 34.29 | 0 | 0.18% | 12.80% |
| OGI | Organigram Global | | Drug Manufacturers - Specialty & Generic | 1.87 | 60 | -2.09% | 12.65% |
| ATHE | Alterity | | Biotechnology | 4.19 | 30 | 6.08% | 12.33% |
| RDNT | Radnet | | Diagnostics & Research | 78.31 | 90 | 0.41% | 11.63% |
| NVAX | Novavax | | Biotechnology | 9.56 | 100 | 0.63% | 11.55% |
| TAK | Takeda | | Drug Manufacturers - Specialty & Generic | 14.44 | 10 | -2.04% | 11.49% |
| KMDA | Kamada | | Drug Manufacturers - Specialty & Generic | 6.84 | 20 | 0.00% | 11.15% |
| AMED | Amedisys | | Home Care | 100.99 | 60 | 0.01% | 11.10% |
| ACIU | AC Immune | | Biotechnology | 3.16 | 100 | 3.95% | 10.88% |
| JAZZ | Jazz | | Biotechnology | 137.21 | 100 | 0.23% | 10.87% |
| ALVR | AlloVir | | Biotechnology | 11.47 | 100 | 16.92% | 10.82% |
| TLRY | Tilray Brands | | Drug Manufacturers - Specialty & Generic | 1.61 | 60 | -2.64% | 10.36% |
| LIVN | LivaNova | | Medical Devices | 51.23 | 30 | 1.23% | 9.82% |
| SNDX | Syndax | | Biotechnology | 15.45 | 60 | -1.47% | 9.73% |
| CABA | Cabaletta Bio | | Biotechnology | 2.55 | 100 | 10.39% | 9.44% |
| ADVM | Adverum Biotechnologies | | Biotechnology | 5.25 | 100 | 4.79% | 9.38% |
| For chart view version of above stock list: Chart View ➞ 0 - 25 , 25 - 50 , 50 - 75 , 75 - 100 , 100 - 125 , 125 - 150 , 150 - 175 , 175 - 200 , 200 - 225 , 225 - 250 , 250 - 275 , 275 - 300 , 300 - 325 , 325 - 350 , 350 - 375 , 375 - 400 , 400 - 425 , 425 - 450 , 450 - 475 , 475 - 500 , 500 - 525 , 525 - 550 , 550 - 575 , 575 - 600 , 600 - 625 , 625 - 650 , 650 - 675 , 675 - 700 , 700 - 725 , 725 - 750 , 750 - 775 , 775 - 800 , 800 - 825 , 825 - 850 , 850 - 875 , 875 - 900 , 900 - 925 , 925 - 950 , 950 - 975 , 975 - 1000 | ||
 | Click To Change The Sort Order: By Market Cap or Company Size Performance: Year-to-date, Week and Day |  |
|
Get the most comprehensive stock market coverage daily at 12Stocks.com ➞ Best Stocks Today ➞ Best Stocks Weekly ➞ Best Stocks Year-to-Date ➞ Best Stocks Trends ➞  Best Stocks Today 12Stocks.com Best Nasdaq Stocks ➞ Best S&P 500 Stocks ➞ Best Tech Stocks ➞ Best Biotech Stocks ➞ |
| Detailed Overview of Healthcare Stocks |
| Healthcare Technical Overview, Leaders & Laggards, Top Healthcare ETF Funds & Detailed Healthcare Stocks List, Charts, Trends & More |
| Healthcare Sector: Technical Analysis, Trends & YTD Performance | |
| Healthcare sector is composed of stocks
from pharmaceutical, biotech, diagnostics labs, insurance providers
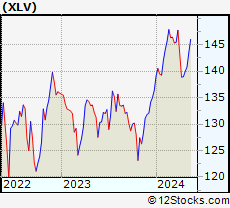
and healthcare services. Healthcare sector, as represented by XLV, an exchange-traded fund [ETF] that holds basket of Healthcare stocks (e.g, Merck, Amgen) is up by 4.95646% and is currently underperforming the overall market by -9.80144% year-to-date. Below is a quick view of Technical charts and trends: |
|
 XLV Weekly Chart |
|
| Long Term Trend: Very Good | |
| Medium Term Trend: Very Good | |
 XLV Daily Chart |
|
| Short Term Trend: Very Good | |
| Overall Trend Score: 100 | |
| YTD Performance: 4.95646% | |
| **Trend Scores & Views Are Only For Educational Purposes And Not For Investing | |
| 12Stocks.com: Top Performing Healthcare Sector Stocks | ||||||||||||||||||||||||||||||||||||||||||||||
 The top performing Healthcare sector stocks year to date are
Now, more recently, over last week, the top performing Healthcare sector stocks on the move are


|
||||||||||||||||||||||||||||||||||||||||||||||
| 12Stocks.com: Investing in Healthcare Sector using Exchange Traded Funds | |
|
The following table shows list of key exchange traded funds (ETF) that
help investors track Healthcare Index. For detailed view, check out our ETF Funds section of our website. Quick View: Move mouse or cursor over ETF symbol (ticker) to view short-term Technical chart and over ETF name to view long term chart. Click on ticker or stock name for detailed view. Click on to add stock symbol to your watchlist and to view watchlist. |
12Stocks.com List of ETFs that track Healthcare Index
| Ticker | ETF Name | Watchlist | Recent Price | Smart Investing & Trading Score | Change % | Week % | Year-to-date % |
| BTEC | Principal Healthcare Innovators | | 39.49 | 30 | 0 | 1.02328 | 0% |
| 12Stocks.com: Charts, Trends, Fundamental Data and Performances of Healthcare Stocks | |
|
We now take in-depth look at all Healthcare stocks including charts, multi-period performances and overall trends (as measured by Smart Investing & Trading Score). One can sort Healthcare stocks (click link to choose) by Daily, Weekly and by Year-to-Date performances. Also, one can sort by size of the company or by market capitalization. |
| Select Your Default Chart Type: | |||||
| |||||
| Click on stock symbol or name for detailed view. Click on to add stock symbol to your watchlist and to view watchlist. Quick View: Move mouse or cursor over "Daily" to quickly view daily Technical stock chart and over "Weekly" to view weekly Technical stock chart. | |||||

 | ZYME Zymeworks BC Inc |
| Sector: Health Care | |
| SubSector: Biotechnology | |
| MarketCap: 1139.83 Millions | |
| Recent Price: 16.90 Smart Investing & Trading Score: 80 | |
| Day Percent Change: -0.236128% Day Change: 0.07 | |
| Week Change: 3.68098% Year-to-date Change: 14.3% | |
| ZYME Links: Profile News Message Board | |
| Charts:- Daily , Weekly | |
| Add ZYME to Watchlist: View: Get Complete ZYME Trend Analysis ➞ | |
 | STAA Staar Surgical Co |
| Sector: Health Care | |
| SubSector: Medical Instruments & Supplies | |
| MarketCap: 1384.51 Millions | |
| Recent Price: 27.42 Smart Investing & Trading Score: 80 | |
| Day Percent Change: 0.883002% Day Change: -0.2 | |
| Week Change: 2.42809% Year-to-date Change: 13.8% | |
| STAA Links: Profile News Message Board | |
| Charts:- Daily , Weekly | |
| Add STAA to Watchlist: View: Get Complete STAA Trend Analysis ➞ | |
 | SMMT Summit Therapeutics Inc |
| Sector: Health Care | |
| SubSector: Biotechnology | |
| MarketCap: 19294.6 Millions | |
| Recent Price: 20.87 Smart Investing & Trading Score: 40 | |
| Day Percent Change: 1.85456% Day Change: 0.14 | |
| Week Change: 1.80488% Year-to-date Change: 13.7% | |
| SMMT Links: Profile News Message Board | |
| Charts:- Daily , Weekly | |
| Add SMMT to Watchlist: View: Get Complete SMMT Trend Analysis ➞ | |
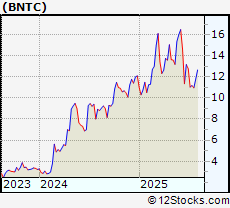 | BNTC Benitec Biopharma Inc |
| Sector: Health Care | |
| SubSector: Biotechnology | |
| MarketCap: 365.14 Millions | |
| Recent Price: 13.73 Smart Investing & Trading Score: 30 | |
| Day Percent Change: -1.99857% Day Change: -0.18 | |
| Week Change: -2.555% Year-to-date Change: 13.7% | |
| BNTC Links: Profile News Message Board | |
| Charts:- Daily , Weekly | |
| Add BNTC to Watchlist: View: Get Complete BNTC Trend Analysis ➞ | |
 | SVRA Savara Inc |
| Sector: Health Care | |
| SubSector: Biotechnology | |
| MarketCap: 642.95 Millions | |
| Recent Price: 3.48 Smart Investing & Trading Score: 40 | |
| Day Percent Change: -1.55367% Day Change: -0.04 | |
| Week Change: -0.712251% Year-to-date Change: 13.5% | |
| SVRA Links: Profile News Message Board | |
| Charts:- Daily , Weekly | |
| Add SVRA to Watchlist: View: Get Complete SVRA Trend Analysis ➞ | |
 | CARA Cara Therapeutics, Inc. |
| Sector: Health Care | |
| SubSector: Biotechnology | |
| MarketCap: 597.985 Millions | |
| Recent Price: 18.25 Smart Investing & Trading Score: 100 | |
| Day Percent Change: 14.3396% Day Change: -9999 | |
| Week Change: 25.4199% Year-to-date Change: 13.5% | |
| CARA Links: Profile News Message Board | |
| Charts:- Daily , Weekly | |
| Add CARA to Watchlist: View: Get Complete CARA Trend Analysis ➞ | |
 | AIRS Airsculpt Technologies Inc |
| Sector: Health Care | |
| SubSector: Medical Care Facilities | |
| MarketCap: 367.13 Millions | |
| Recent Price: 7.95 Smart Investing & Trading Score: 61 | |
| Day Percent Change: -9.24% Day Change: -0.6 | |
| Week Change: -5.61% Year-to-date Change: 13.5% | |
| AIRS Links: Profile News Message Board | |
| Charts:- Daily , Weekly | |
| Add AIRS to Watchlist: View: Get Complete AIRS Trend Analysis ➞ | |
 | SCLX Scilex Holding Company |
| Sector: Health Care | |
| SubSector: Drug Manufacturers - General | |
| MarketCap: 158.59 Millions | |
| Recent Price: 17.26 Smart Investing & Trading Score: 30 | |
| Day Percent Change: -16.5377% Day Change: -0.43 | |
| Week Change: -39.6292% Year-to-date Change: 13.1% | |
| SCLX Links: Profile News Message Board | |
| Charts:- Daily , Weekly | |
| Add SCLX to Watchlist: View: Get Complete SCLX Trend Analysis ➞ | |
 | TNYA Tenaya Therapeutics Inc |
| Sector: Health Care | |
| SubSector: Biotechnology | |
| MarketCap: 220.02 Millions | |
| Recent Price: 1.60 Smart Investing & Trading Score: 80 | |
| Day Percent Change: -4.46429% Day Change: -0.08 | |
| Week Change: 2.88462% Year-to-date Change: 13.0% | |
| TNYA Links: Profile News Message Board | |
| Charts:- Daily , Weekly | |
| Add TNYA to Watchlist: View: Get Complete TNYA Trend Analysis ➞ | |
 | ATRC Atricure Inc |
| Sector: Health Care | |
| SubSector: Medical Instruments & Supplies | |
| MarketCap: 1758.44 Millions | |
| Recent Price: 34.29 Smart Investing & Trading Score: 0 | |
| Day Percent Change: 0.175285% Day Change: -0.34 | |
| Week Change: -4.98753% Year-to-date Change: 12.8% | |
| ATRC Links: Profile News Message Board | |
| Charts:- Daily , Weekly | |
| Add ATRC to Watchlist: View: Get Complete ATRC Trend Analysis ➞ | |
 | OGI Organigram Global Inc |
| Sector: Health Care | |
| SubSector: Drug Manufacturers - Specialty & Generic | |
| MarketCap: 220.9 Millions | |
| Recent Price: 1.87 Smart Investing & Trading Score: 60 | |
| Day Percent Change: -2.09424% Day Change: 0.07 | |
| Week Change: 3.31492% Year-to-date Change: 12.7% | |
| OGI Links: Profile News Message Board | |
| Charts:- Daily , Weekly | |
| Add OGI to Watchlist: View: Get Complete OGI Trend Analysis ➞ | |
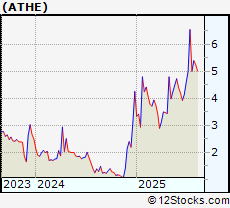 | ATHE Alterity Therapeutics Ltd ADR |
| Sector: Health Care | |
| SubSector: Biotechnology | |
| MarketCap: 77.82 Millions | |
| Recent Price: 4.19 Smart Investing & Trading Score: 30 | |
| Day Percent Change: 6.07595% Day Change: 0.07 | |
| Week Change: -4.3379% Year-to-date Change: 12.3% | |
| ATHE Links: Profile News Message Board | |
| Charts:- Daily , Weekly | |
| Add ATHE to Watchlist: View: Get Complete ATHE Trend Analysis ➞ | |
 | RDNT Radnet Inc |
| Sector: Health Care | |
| SubSector: Diagnostics & Research | |
| MarketCap: 5492.58 Millions | |
| Recent Price: 78.31 Smart Investing & Trading Score: 90 | |
| Day Percent Change: 0.410309% Day Change: -0.03 | |
| Week Change: 3.66693% Year-to-date Change: 11.6% | |
| RDNT Links: Profile News Message Board | |
| Charts:- Daily , Weekly | |
| Add RDNT to Watchlist: View: Get Complete RDNT Trend Analysis ➞ | |
 | NVAX Novavax, Inc |
| Sector: Health Care | |
| SubSector: Biotechnology | |
| MarketCap: 1283.13 Millions | |
| Recent Price: 9.56 Smart Investing & Trading Score: 100 | |
| Day Percent Change: 0.631579% Day Change: -1.11 | |
| Week Change: 10.6481% Year-to-date Change: 11.6% | |
| NVAX Links: Profile News Message Board | |
| Charts:- Daily , Weekly | |
| Add NVAX to Watchlist: View: Get Complete NVAX Trend Analysis ➞ | |
 | TAK Takeda Pharmaceutical Co ADR |
| Sector: Health Care | |
| SubSector: Drug Manufacturers - Specialty & Generic | |
| MarketCap: 48109.6 Millions | |
| Recent Price: 14.44 Smart Investing & Trading Score: 10 | |
| Day Percent Change: -2.03528% Day Change: -0.32 | |
| Week Change: -3.47594% Year-to-date Change: 11.5% | |
| TAK Links: Profile News Message Board | |
| Charts:- Daily , Weekly | |
| Add TAK to Watchlist: View: Get Complete TAK Trend Analysis ➞ | |
 | KMDA Kamada Ltd |
| Sector: Health Care | |
| SubSector: Drug Manufacturers - Specialty & Generic | |
| MarketCap: 410.62 Millions | |
| Recent Price: 6.84 Smart Investing & Trading Score: 20 | |
| Day Percent Change: 0% Day Change: 0.08 | |
| Week Change: -0.725689% Year-to-date Change: 11.2% | |
| KMDA Links: Profile News Message Board | |
| Charts:- Daily , Weekly | |
| Add KMDA to Watchlist: View: Get Complete KMDA Trend Analysis ➞ | |
 | AMED Amedisys, Inc. |
| Sector: Health Care | |
| SubSector: Home Health Care | |
| MarketCap: 6058.95 Millions | |
| Recent Price: 100.99 Smart Investing & Trading Score: 60 | |
| Day Percent Change: 0.00990295% Day Change: -9999 | |
| Week Change: 1.71216% Year-to-date Change: 11.1% | |
| AMED Links: Profile News Message Board | |
| Charts:- Daily , Weekly | |
| Add AMED to Watchlist: View: Get Complete AMED Trend Analysis ➞ | |
 | ACIU AC Immune SA |
| Sector: Health Care | |
| SubSector: Biotechnology | |
| MarketCap: 225.59 Millions | |
| Recent Price: 3.16 Smart Investing & Trading Score: 100 | |
| Day Percent Change: 3.94737% Day Change: -0.04 | |
| Week Change: 15.7509% Year-to-date Change: 10.9% | |
| ACIU Links: Profile News Message Board | |
| Charts:- Daily , Weekly | |
| Add ACIU to Watchlist: View: Get Complete ACIU Trend Analysis ➞ | |
 | JAZZ Jazz Pharmaceuticals plc |
| Sector: Health Care | |
| SubSector: Biotechnology | |
| MarketCap: 7855.32 Millions | |
| Recent Price: 137.21 Smart Investing & Trading Score: 100 | |
| Day Percent Change: 0.226443% Day Change: 0.51 | |
| Week Change: 5.88008% Year-to-date Change: 10.9% | |
| JAZZ Links: Profile News Message Board | |
| Charts:- Daily , Weekly | |
| Add JAZZ to Watchlist: View: Get Complete JAZZ Trend Analysis ➞ | |
 | ALVR AlloVir, Inc. |
| Sector: Health Care | |
| SubSector: Biotechnology | |
| MarketCap: 25787 Millions | |
| Recent Price: 11.47 Smart Investing & Trading Score: 100 | |
| Day Percent Change: 16.9215% Day Change: -9999 | |
| Week Change: 20.8641% Year-to-date Change: 10.8% | |
| ALVR Links: Profile News Message Board | |
| Charts:- Daily , Weekly | |
| Add ALVR to Watchlist: View: Get Complete ALVR Trend Analysis ➞ | |
 | TLRY Tilray Brands Inc |
| Sector: Health Care | |
| SubSector: Drug Manufacturers - Specialty & Generic | |
| MarketCap: 1309.63 Millions | |
| Recent Price: 1.61 Smart Investing & Trading Score: 60 | |
| Day Percent Change: -2.64048% Day Change: 0.05 | |
| Week Change: 27.881% Year-to-date Change: 10.4% | |
| TLRY Links: Profile News Message Board | |
| Charts:- Daily , Weekly | |
| Add TLRY to Watchlist: View: Get Complete TLRY Trend Analysis ➞ | |
 | LIVN LivaNova PLC |
| Sector: Health Care | |
| SubSector: Medical Devices | |
| MarketCap: 3165.22 Millions | |
| Recent Price: 51.23 Smart Investing & Trading Score: 30 | |
| Day Percent Change: 1.22505% Day Change: -0.53 | |
| Week Change: -3.75728% Year-to-date Change: 9.8% | |
| LIVN Links: Profile News Message Board | |
| Charts:- Daily , Weekly | |
| Add LIVN to Watchlist: View: Get Complete LIVN Trend Analysis ➞ | |
 | SNDX Syndax Pharmaceuticals Inc |
| Sector: Health Care | |
| SubSector: Biotechnology | |
| MarketCap: 1467.86 Millions | |
| Recent Price: 15.45 Smart Investing & Trading Score: 60 | |
| Day Percent Change: -1.46684% Day Change: 0.1 | |
| Week Change: 2.93138% Year-to-date Change: 9.7% | |
| SNDX Links: Profile News Message Board | |
| Charts:- Daily , Weekly | |
| Add SNDX to Watchlist: View: Get Complete SNDX Trend Analysis ➞ | |
 | CABA Cabaletta Bio Inc |
| Sector: Health Care | |
| SubSector: Biotechnology | |
| MarketCap: 155.49 Millions | |
| Recent Price: 2.55 Smart Investing & Trading Score: 100 | |
| Day Percent Change: 10.3896% Day Change: 0.02 | |
| Week Change: 3.23887% Year-to-date Change: 9.4% | |
| CABA Links: Profile News Message Board | |
| Charts:- Daily , Weekly | |
| Add CABA to Watchlist: View: Get Complete CABA Trend Analysis ➞ | |
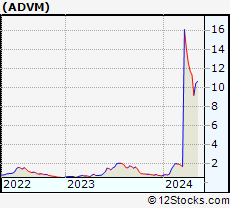 | ADVM Adverum Biotechnologies Inc |
| Sector: Health Care | |
| SubSector: Biotechnology | |
| MarketCap: 73.86 Millions | |
| Recent Price: 5.25 Smart Investing & Trading Score: 100 | |
| Day Percent Change: 4.79042% Day Change: 0.15 | |
| Week Change: 20.9677% Year-to-date Change: 9.4% | |
| ADVM Links: Profile News Message Board | |
| Charts:- Daily , Weekly | |
| Add ADVM to Watchlist: View: Get Complete ADVM Trend Analysis ➞ | |
| For tabular summary view of above stock list: Summary View ➞ 0 - 25 , 25 - 50 , 50 - 75 , 75 - 100 , 100 - 125 , 125 - 150 , 150 - 175 , 175 - 200 , 200 - 225 , 225 - 250 , 250 - 275 , 275 - 300 , 300 - 325 , 325 - 350 , 350 - 375 , 375 - 400 , 400 - 425 , 425 - 450 , 450 - 475 , 475 - 500 , 500 - 525 , 525 - 550 , 550 - 575 , 575 - 600 , 600 - 625 , 625 - 650 , 650 - 675 , 675 - 700 , 700 - 725 , 725 - 750 , 750 - 775 , 775 - 800 , 800 - 825 , 825 - 850 , 850 - 875 , 875 - 900 , 900 - 925 , 925 - 950 , 950 - 975 , 975 - 1000 | ||
| Click To Change The Sort Order: By Market Cap or Company Size Performance: Year-to-date, Week and Day | |
| Select Chart Type: | ||
|
Best Stocks Today 12Stocks.com |
© 2025 12Stocks.com Terms & Conditions Privacy Contact Us
All Information Provided Only For Education And Not To Be Used For Investing or Trading. See Terms & Conditions


One More Thing ... Get Best Stocks Delivered Daily!
Never Ever Miss A Move With Our Top Ten Stocks Lists
Find Best Stocks In Any Market - Bull or Bear Market
Take A Peek At Our Top Ten Stocks Lists: Daily, Weekly, Year-to-Date & Top Trends
Find Best Stocks In Any Market - Bull or Bear Market
Take A Peek At Our Top Ten Stocks Lists: Daily, Weekly, Year-to-Date & Top Trends
Healthcare Stocks With Best Up Trends [0-bearish to 100-bullish]: Taysha Gene[100], DBV Technologies[100], Valneva SE[100], ClearPoint Neuro[100], Prime Medicine[100], AlloVir [100], Sarepta [100], Monopar [100], Cara [100], Absci Corp[100], Spruce Biosciences[100]
Best Healthcare Stocks Year-to-Date:
Regencell Bioscience[12636.6%], Kaleido BioSciences[9900%], Vor Biopharma[3175%], Nanobiotix ADR[581.379%], Eagle [542.857%], So-Young [395.711%], I-Mab ADR[357.506%], Monopar [337.489%], Nektar [319.84%], 908 Devices[299.543%], DBV Technologies[276.923%] Best Healthcare Stocks This Week:
Athersys [193287%], Nobilis Health[101349%], VBI Vaccines[86898.5%], ContraFect [47677.8%], Clovis Oncology[39610.5%], Endo [28369.6%], NanoString Technologies[17224.7%], Neptune Wellness[14100%], ViewRay [11470.2%], Mallkrodt [11382.1%], Achillion [10033.3%] Best Healthcare Stocks Daily:
Kaleido BioSciences[9900%], Neoleukin [332.665%], Syros [226.23%], Athenex [103.333%], Taysha Gene[53.4591%], DBV Technologies[21.6485%], Valneva SE[20.197%], ClearPoint Neuro[19.7991%], Prime Medicine[19.4097%], Accelerate Diagnostics[17.6471%], Aptose Biosciences[17.5439%]