
 Login Sign Up


| |||||
 |  | ||||

| 12Stocks.com Market Intelligence |
Best Healthcare Stocks
 | "Discover best trending healthcare stocks with 12Stocks.com." |
| - Subu Vdaygiri, Founder, 12Stocks.com |
| In a hurry? Healthcare Stocks Lists: Performance Trends Table, Stock Charts
Sort Healthcare stocks: Daily, Weekly, Year-to-Date, Market Cap & Trends. Filter Healthcare stocks list by size:All Healthcare Large Mid-Range Small |
| 12Stocks.com Healthcare Stocks Performances & Trends Daily | |||||||||
|
|  The overall Smart Investing & Trading Score is 52 (0-bearish to 100-bullish) which puts Healthcare sector in short term neutral trend. The Smart Investing & Trading Score from previous trading session is 38 and an improvement of trend continues.
| ||||||||
Here are the Smart Investing & Trading Scores of the most requested Healthcare stocks at 12Stocks.com (click stock name for detailed review):
|


| 12Stocks.com: Investing in Healthcare sector with Stocks | |
|
The following table helps investors and traders sort through current performance and trends (as measured by Smart Investing & Trading Score) of various
stocks in the Healthcare sector. Quick View: Move mouse or cursor over stock symbol (ticker) to view short-term Technical chart and over stock name to view long term chart. Click on  to add stock symbol to your watchlist and to add stock symbol to your watchlist and  to view watchlist. Click on any ticker or stock name for detailed market intelligence report for that stock. to view watchlist. Click on any ticker or stock name for detailed market intelligence report for that stock. |
12Stocks.com Performance of Stocks in Healthcare Sector
| Ticker | Stock Name | Watchlist | Category | Recent Price | Smart Investing & Trading Score | Change % | YTD Change% |
| OCX | OncoCyte |   | Biotechnology | 2.46 | 10 | 0.20% | -1.60% |
| OVID | Ovid | | Biotechnology | 3.15 | 17 | -1.56% | -2.17% |
| AIM | AIM ImmunoTech | | Pharmaceutical | 0.43 | 36 | 1.06% | -2.25% |
| SLNO | Soleno | | Laboratories | 39.34 | 42 | -1.99% | -2.26% |
| MDT | Medtronic | | Equipment | 80.38 | 25 | -1.12% | -2.43% |
| EPIX | ESSA Pharma | | Biotechnology | 6.38 | 10 | -0.31% | -2.45% |
| MMSI | Merit | | Instruments | 74.03 | 74 | -0.20% | -2.54% |
| ROIV | Roivant Sciences | | Biotechnology | 10.82 | 61 | -1.05% | -2.57% |
| NVS | Novartis AG | | Pharmaceutical | 98.35 | 64 | 1.10% | -2.59% |
| ANNX | Annexon | | Biotechnology | 4.44 | 58 | 0.00% | -2.63% |
| EHAB | Enhabit | | Medical Care Facilities | 10.07 | 54 | -1.90% | -2.66% |
| ABT | Abbott | | Equipment | 106.89 | 18 | -0.65% | -2.89% |
| CMPX | Compass | | Biotechnology | 1.49 | 46 | -1.32% | -2.93% |
| PRGO | Perrigo | | Pharmaceutical | 31.23 | 67 | 2.43% | -2.95% |
| GLUE | Monte Rosa | | Biotechnology | 5.46 | 41 | -1.62% | -3.02% |
| ICUI | ICU | | Instruments | 96.72 | 61 | -1.06% | -3.03% |
| CYH | Community Health | | Hospitals | 3.03 | 42 | 2.36% | -3.19% |
| ITOS | iTeos | | Biotechnology | 10.58 | 61 | -3.73% | -3.29% |
| MOLN | Molecular Partners | | Biotechnology | 3.88 | 47 | 0.00% | -3.36% |
| SPRO | Spero | | Biotechnology | 1.42 | 15 | -1.05% | -3.40% |
| GMED | Globus | | Equipment | 51.44 | 42 | 0.33% | -3.47% |
| CGEN | Compugen | | Biotechnology | 1.91 | 32 | -3.54% | -3.54% |
| SNDX | Syndax | | Biotechnology | 20.79 | 54 | -0.86% | -3.79% |
| PCVX | Vaxcyte | | Biotechnology | 60.25 | 25 | -1.03% | -4.01% |
| KIDS | OrthoPediatrics | | Equipment | 31.20 | 73 | 1.86% | -4.03% |
| For chart view version of above stock list: Chart View ➞ 0 - 25 , 25 - 50 , 50 - 75 , 75 - 100 , 100 - 125 , 125 - 150 , 150 - 175 , 175 - 200 , 200 - 225 , 225 - 250 , 250 - 275 , 275 - 300 , 300 - 325 , 325 - 350 , 350 - 375 , 375 - 400 , 400 - 425 , 425 - 450 , 450 - 475 , 475 - 500 , 500 - 525 , 525 - 550 , 550 - 575 , 575 - 600 , 600 - 625 , 625 - 650 , 650 - 675 , 675 - 700 , 700 - 725 | ||
 | Click To Change The Sort Order: By Market Cap or Company Size Performance: Year-to-date, Week and Day |  |
|
Get the most comprehensive stock market coverage daily at 12Stocks.com ➞ Best Stocks Today ➞ Best Stocks Weekly ➞ Best Stocks Year-to-Date ➞ Best Stocks Trends ➞  Best Stocks Today 12Stocks.com Best Nasdaq Stocks ➞ Best S&P 500 Stocks ➞ Best Tech Stocks ➞ Best Biotech Stocks ➞ |
| Detailed Overview of Healthcare Stocks |
| Healthcare Technical Overview, Leaders & Laggards, Top Healthcare ETF Funds & Detailed Healthcare Stocks List, Charts, Trends & More |
| Healthcare Sector: Technical Analysis, Trends & YTD Performance | |
| Healthcare sector is composed of stocks
from pharmaceutical, biotech, diagnostics labs, insurance providers
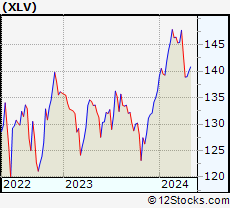
and healthcare services. Healthcare sector, as represented by XLV, an exchange-traded fund [ETF] that holds basket of Healthcare stocks (e.g, Merck, Amgen) is up by 3.28% and is currently underperforming the overall market by -2.38% year-to-date. Below is a quick view of Technical charts and trends: |
|
 XLV Weekly Chart |
|
| Long Term Trend: Good | |
| Medium Term Trend: Not Good | |
 XLV Daily Chart |
|
| Short Term Trend: Very Good | |
| Overall Trend Score: 52 | |
| YTD Performance: 3.28% | |
| **Trend Scores & Views Are Only For Educational Purposes And Not For Investing | |
| 12Stocks.com: Top Performing Healthcare Sector Stocks | ||||||||||||||||||||||||||||||||||||||||||||||||
 The top performing Healthcare sector stocks year to date are
Now, more recently, over last week, the top performing Healthcare sector stocks on the move are


|
||||||||||||||||||||||||||||||||||||||||||||||||
| 12Stocks.com: Investing in Healthcare Sector using Exchange Traded Funds | |
|
The following table shows list of key exchange traded funds (ETF) that
help investors track Healthcare Index. For detailed view, check out our ETF Funds section of our website. Quick View: Move mouse or cursor over ETF symbol (ticker) to view short-term Technical chart and over ETF name to view long term chart. Click on ticker or stock name for detailed view. Click on to add stock symbol to your watchlist and to view watchlist. |
12Stocks.com List of ETFs that track Healthcare Index
| Ticker | ETF Name | Watchlist | Recent Price | Smart Investing & Trading Score | Change % | Week % | Year-to-date % |
| XLV | Health Care | | 140.86 | 52 | -0.31 | 1.37 | 3.28% |
| XBI | Biotech | | 83.94 | 25 | -0.89 | 1.34 | -5.99% |
| IBB | Biotechnology | | 127.76 | 32 | -0.20 | 2.44 | -5.96% |
| BBH | Biotech | | 157.33 | 49 | 0.03 | 3.26 | -4.83% |
| VHT | Health Care | | 257.26 | 30 | -0.22 | 1.55 | 2.62% |
| IYH | Healthcare | | 59.09 | 30 | -0.20 | 1.6 | 3.22% |
| IHF | Healthcare Providers | | 52.26 | 48 | -0.11 | 0.1 | -0.48% |
| IHI | Medical Devices | | 55.64 | 35 | 0.23 | 2.35 | 3.09% |
| BIB | Biotechnology | | 50.18 | 32 | -0.30 | 4.11 | -12.04% |
| BIS | Short Biotech | | 20.09 | 61 | 0.75 | -3.85 | 11.18% |
| XHE | Health Care Equipment | | 83.21 | 35 | 0.24 | 2.39 | -1.25% |
| CURE | Healthcare Bull 3X | | 107.85 | 32 | -0.25 | 4.37 | 6.01% |
| LABU | Biotech Bull 3X | | 89.40 | 25 | -2.80 | 3.89 | -26.7% |
| LABD | Biotech Bear 3X | | 10.37 | 62 | 2.98 | -3.98 | 7.02% |
| PSCH | SmallCap Health Care | | 41.12 | 41 | -0.23 | 2.35 | -3.92% |
| XHS | Health Care Services | | 88.70 | 53 | -0.06 | 1.85 | -0.28% |
| PTH | DWA Healthcare Momentum | | 39.63 | 46 | -1.34 | 0.25 | 1.25% |
| BTEC | Principal Healthcare Innovators | | 34.20 | 18 | -1.73 | 1.02 | -5.85% |
| RXL | Health Care | | 96.00 | 45 | -0.15 | 2.99 | 5.03% |
| RXD | Short Health Care | | 11.34 | 45 | 0.88 | -2.54 | -4.87% |
| 12Stocks.com: Charts, Trends, Fundamental Data and Performances of Healthcare Stocks | |
|
We now take in-depth look at all Healthcare stocks including charts, multi-period performances and overall trends (as measured by Smart Investing & Trading Score). One can sort Healthcare stocks (click link to choose) by Daily, Weekly and by Year-to-Date performances. Also, one can sort by size of the company or by market capitalization. |
| Select Your Default Chart Type: | |||||
| |||||
| Click on stock symbol or name for detailed view. Click on to add stock symbol to your watchlist and to view watchlist. Quick View: Move mouse or cursor over "Daily" to quickly view daily Technical stock chart and over "Weekly" to view weekly Technical stock chart. | |||||

 | OCX OncoCyte Corporation |
| Sector: Health Care | |
| SubSector: Biotechnology | |
| MarketCap: 131.485 Millions | |
| Recent Price: 2.46 Smart Investing & Trading Score: 10 | |
| Day Percent Change: 0.20% Day Change: 0.00 | |
| Week Change: -1.4% Year-to-date Change: -1.6% | |
| OCX Links: Profile News Message Board | |
| Charts:- Daily , Weekly | |
| Add OCX to Watchlist: View: Get Complete OCX Trend Analysis ➞ | |
 | OVID Ovid Therapeutics Inc. |
| Sector: Health Care | |
| SubSector: Biotechnology | |
| MarketCap: 130.385 Millions | |
| Recent Price: 3.15 Smart Investing & Trading Score: 17 | |
| Day Percent Change: -1.56% Day Change: -0.05 | |
| Week Change: -2.93% Year-to-date Change: -2.2% | |
| OVID Links: Profile News Message Board | |
| Charts:- Daily , Weekly | |
| Add OVID to Watchlist: View: Get Complete OVID Trend Analysis ➞ | |
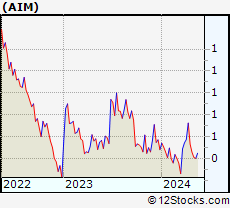 | AIM AIM ImmunoTech Inc. |
| Sector: Health Care | |
| SubSector: Drug Manufacturers - Other | |
| MarketCap: 61.4033 Millions | |
| Recent Price: 0.43 Smart Investing & Trading Score: 36 | |
| Day Percent Change: 1.06% Day Change: 0.00 | |
| Week Change: -7.53% Year-to-date Change: -2.3% | |
| AIM Links: Profile News Message Board | |
| Charts:- Daily , Weekly | |
| Add AIM to Watchlist: View: Get Complete AIM Trend Analysis ➞ | |
 | SLNO Soleno Therapeutics, Inc. |
| Sector: Health Care | |
| SubSector: Medical Laboratories & Research | |
| MarketCap: 94 Millions | |
| Recent Price: 39.34 Smart Investing & Trading Score: 42 | |
| Day Percent Change: -1.99% Day Change: -0.80 | |
| Week Change: 4.82% Year-to-date Change: -2.3% | |
| SLNO Links: Profile News Message Board | |
| Charts:- Daily , Weekly | |
| Add SLNO to Watchlist: View: Get Complete SLNO Trend Analysis ➞ | |
 | MDT Medtronic plc |
| Sector: Health Care | |
| SubSector: Medical Appliances & Equipment | |
| MarketCap: 113698 Millions | |
| Recent Price: 80.38 Smart Investing & Trading Score: 25 | |
| Day Percent Change: -1.12% Day Change: -0.91 | |
| Week Change: 1.13% Year-to-date Change: -2.4% | |
| MDT Links: Profile News Message Board | |
| Charts:- Daily , Weekly | |
| Add MDT to Watchlist: View: Get Complete MDT Trend Analysis ➞ | |
 | EPIX ESSA Pharma Inc. |
| Sector: Health Care | |
| SubSector: Biotechnology | |
| MarketCap: 70.5785 Millions | |
| Recent Price: 6.38 Smart Investing & Trading Score: 10 | |
| Day Percent Change: -0.31% Day Change: -0.02 | |
| Week Change: -2.89% Year-to-date Change: -2.5% | |
| EPIX Links: Profile News Message Board | |
| Charts:- Daily , Weekly | |
| Add EPIX to Watchlist: View: Get Complete EPIX Trend Analysis ➞ | |
 | MMSI Merit Medical Systems, Inc. |
| Sector: Health Care | |
| SubSector: Medical Instruments & Supplies | |
| MarketCap: 1719.2 Millions | |
| Recent Price: 74.03 Smart Investing & Trading Score: 74 | |
| Day Percent Change: -0.20% Day Change: -0.15 | |
| Week Change: 2.78% Year-to-date Change: -2.5% | |
| MMSI Links: Profile News Message Board | |
| Charts:- Daily , Weekly | |
| Add MMSI to Watchlist: View: Get Complete MMSI Trend Analysis ➞ | |
 | ROIV Roivant Sciences Ltd. |
| Sector: Health Care | |
| SubSector: Biotechnology | |
| MarketCap: 7780 Millions | |
| Recent Price: 10.82 Smart Investing & Trading Score: 61 | |
| Day Percent Change: -1.05% Day Change: -0.12 | |
| Week Change: 3.44% Year-to-date Change: -2.6% | |
| ROIV Links: Profile News Message Board | |
| Charts:- Daily , Weekly | |
| Add ROIV to Watchlist: View: Get Complete ROIV Trend Analysis ➞ | |
 | NVS Novartis AG |
| Sector: Health Care | |
| SubSector: Drug Manufacturers - Major | |
| MarketCap: 203929 Millions | |
| Recent Price: 98.35 Smart Investing & Trading Score: 64 | |
| Day Percent Change: 1.10% Day Change: 1.07 | |
| Week Change: 4.23% Year-to-date Change: -2.6% | |
| NVS Links: Profile News Message Board | |
| Charts:- Daily , Weekly | |
| Add NVS to Watchlist: View: Get Complete NVS Trend Analysis ➞ | |
 | ANNX Annexon, Inc. |
| Sector: Health Care | |
| SubSector: Biotechnology | |
| MarketCap: 94487 Millions | |
| Recent Price: 4.44 Smart Investing & Trading Score: 58 | |
| Day Percent Change: 0.00% Day Change: 0.00 | |
| Week Change: -5.43% Year-to-date Change: -2.6% | |
| ANNX Links: Profile News Message Board | |
| Charts:- Daily , Weekly | |
| Add ANNX to Watchlist: View: Get Complete ANNX Trend Analysis ➞ | |
 | EHAB Enhabit, Inc. |
| Sector: Health Care | |
| SubSector: Medical Care Facilities | |
| MarketCap: 569 Millions | |
| Recent Price: 10.07 Smart Investing & Trading Score: 54 | |
| Day Percent Change: -1.90% Day Change: -0.20 | |
| Week Change: -1.71% Year-to-date Change: -2.7% | |
| EHAB Links: Profile News Message Board | |
| Charts:- Daily , Weekly | |
| Add EHAB to Watchlist: View: Get Complete EHAB Trend Analysis ➞ | |
 | ABT Abbott Laboratories |
| Sector: Health Care | |
| SubSector: Medical Appliances & Equipment | |
| MarketCap: 125288 Millions | |
| Recent Price: 106.89 Smart Investing & Trading Score: 18 | |
| Day Percent Change: -0.65% Day Change: -0.70 | |
| Week Change: -0.36% Year-to-date Change: -2.9% | |
| ABT Links: Profile News Message Board | |
| Charts:- Daily , Weekly | |
| Add ABT to Watchlist: View: Get Complete ABT Trend Analysis ➞ | |
 | CMPX Compass Therapeutics, Inc. |
| Sector: Health Care | |
| SubSector: Biotechnology | |
| MarketCap: 406 Millions | |
| Recent Price: 1.49 Smart Investing & Trading Score: 46 | |
| Day Percent Change: -1.32% Day Change: -0.02 | |
| Week Change: 1.36% Year-to-date Change: -2.9% | |
| CMPX Links: Profile News Message Board | |
| Charts:- Daily , Weekly | |
| Add CMPX to Watchlist: View: Get Complete CMPX Trend Analysis ➞ | |
 | PRGO Perrigo Company plc |
| Sector: Health Care | |
| SubSector: Drug Related Products | |
| MarketCap: 6493.93 Millions | |
| Recent Price: 31.23 Smart Investing & Trading Score: 67 | |
| Day Percent Change: 2.43% Day Change: 0.74 | |
| Week Change: 1.4% Year-to-date Change: -3.0% | |
| PRGO Links: Profile News Message Board | |
| Charts:- Daily , Weekly | |
| Add PRGO to Watchlist: View: Get Complete PRGO Trend Analysis ➞ | |
 | GLUE Monte Rosa Therapeutics, Inc. |
| Sector: Health Care | |
| SubSector: Biotechnology | |
| MarketCap: 346 Millions | |
| Recent Price: 5.46 Smart Investing & Trading Score: 41 | |
| Day Percent Change: -1.62% Day Change: -0.09 | |
| Week Change: -6.67% Year-to-date Change: -3.0% | |
| GLUE Links: Profile News Message Board | |
| Charts:- Daily , Weekly | |
| Add GLUE to Watchlist: View: Get Complete GLUE Trend Analysis ➞ | |
 | ICUI ICU Medical, Inc. |
| Sector: Health Care | |
| SubSector: Medical Instruments & Supplies | |
| MarketCap: 3640.7 Millions | |
| Recent Price: 96.72 Smart Investing & Trading Score: 61 | |
| Day Percent Change: -1.06% Day Change: -1.04 | |
| Week Change: 0.99% Year-to-date Change: -3.0% | |
| ICUI Links: Profile News Message Board | |
| Charts:- Daily , Weekly | |
| Add ICUI to Watchlist: View: Get Complete ICUI Trend Analysis ➞ | |
 | CYH Community Health Systems, Inc. |
| Sector: Health Care | |
| SubSector: Hospitals | |
| MarketCap: 371.546 Millions | |
| Recent Price: 3.03 Smart Investing & Trading Score: 42 | |
| Day Percent Change: 2.36% Day Change: 0.07 | |
| Week Change: 5.94% Year-to-date Change: -3.2% | |
| CYH Links: Profile News Message Board | |
| Charts:- Daily , Weekly | |
| Add CYH to Watchlist: View: Get Complete CYH Trend Analysis ➞ | |
 | ITOS iTeos Therapeutics, Inc. |
| Sector: Health Care | |
| SubSector: Biotechnology | |
| MarketCap: 10487 Millions | |
| Recent Price: 10.58 Smart Investing & Trading Score: 61 | |
| Day Percent Change: -3.73% Day Change: -0.41 | |
| Week Change: 3.27% Year-to-date Change: -3.3% | |
| ITOS Links: Profile News Message Board | |
| Charts:- Daily , Weekly | |
| Add ITOS to Watchlist: View: Get Complete ITOS Trend Analysis ➞ | |
 | MOLN Molecular Partners AG |
| Sector: Health Care | |
| SubSector: Biotechnology | |
| MarketCap: 216 Millions | |
| Recent Price: 3.88 Smart Investing & Trading Score: 47 | |
| Day Percent Change: 0.00% Day Change: 0.00 | |
| Week Change: 16.87% Year-to-date Change: -3.4% | |
| MOLN Links: Profile News Message Board | |
| Charts:- Daily , Weekly | |
| Add MOLN to Watchlist: View: Get Complete MOLN Trend Analysis ➞ | |
 | SPRO Spero Therapeutics, Inc. |
| Sector: Health Care | |
| SubSector: Biotechnology | |
| MarketCap: 121.085 Millions | |
| Recent Price: 1.42 Smart Investing & Trading Score: 15 | |
| Day Percent Change: -1.05% Day Change: -0.02 | |
| Week Change: 0.71% Year-to-date Change: -3.4% | |
| SPRO Links: Profile News Message Board | |
| Charts:- Daily , Weekly | |
| Add SPRO to Watchlist: View: Get Complete SPRO Trend Analysis ➞ | |
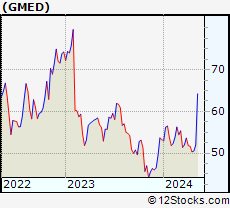 | GMED Globus Medical, Inc. |
| Sector: Health Care | |
| SubSector: Medical Appliances & Equipment | |
| MarketCap: 3965.5 Millions | |
| Recent Price: 51.44 Smart Investing & Trading Score: 42 | |
| Day Percent Change: 0.33% Day Change: 0.17 | |
| Week Change: 2.16% Year-to-date Change: -3.5% | |
| GMED Links: Profile News Message Board | |
| Charts:- Daily , Weekly | |
| Add GMED to Watchlist: View: Get Complete GMED Trend Analysis ➞ | |
 | CGEN Compugen Ltd. |
| Sector: Health Care | |
| SubSector: Biotechnology | |
| MarketCap: 634.285 Millions | |
| Recent Price: 1.91 Smart Investing & Trading Score: 32 | |
| Day Percent Change: -3.54% Day Change: -0.07 | |
| Week Change: 0.53% Year-to-date Change: -3.5% | |
| CGEN Links: Profile News Message Board | |
| Charts:- Daily , Weekly | |
| Add CGEN to Watchlist: View: Get Complete CGEN Trend Analysis ➞ | |
 | SNDX Syndax Pharmaceuticals, Inc. |
| Sector: Health Care | |
| SubSector: Biotechnology | |
| MarketCap: 365.985 Millions | |
| Recent Price: 20.79 Smart Investing & Trading Score: 54 | |
| Day Percent Change: -0.86% Day Change: -0.18 | |
| Week Change: -0.05% Year-to-date Change: -3.8% | |
| SNDX Links: Profile News Message Board | |
| Charts:- Daily , Weekly | |
| Add SNDX to Watchlist: View: Get Complete SNDX Trend Analysis ➞ | |
 | PCVX Vaxcyte, Inc. |
| Sector: Health Care | |
| SubSector: Biotechnology | |
| MarketCap: 13887 Millions | |
| Recent Price: 60.25 Smart Investing & Trading Score: 25 | |
| Day Percent Change: -1.03% Day Change: -0.63 | |
| Week Change: -0.76% Year-to-date Change: -4.0% | |
| PCVX Links: Profile News Message Board | |
| Charts:- Daily , Weekly | |
| Add PCVX to Watchlist: View: Get Complete PCVX Trend Analysis ➞ | |
 | KIDS OrthoPediatrics Corp. |
| Sector: Health Care | |
| SubSector: Medical Appliances & Equipment | |
| MarketCap: 742.28 Millions | |
| Recent Price: 31.20 Smart Investing & Trading Score: 73 | |
| Day Percent Change: 1.86% Day Change: 0.57 | |
| Week Change: 2.8% Year-to-date Change: -4.0% | |
| KIDS Links: Profile News Message Board | |
| Charts:- Daily , Weekly | |
| Add KIDS to Watchlist: View: Get Complete KIDS Trend Analysis ➞ | |
| For tabular summary view of above stock list: Summary View ➞ 0 - 25 , 25 - 50 , 50 - 75 , 75 - 100 , 100 - 125 , 125 - 150 , 150 - 175 , 175 - 200 , 200 - 225 , 225 - 250 , 250 - 275 , 275 - 300 , 300 - 325 , 325 - 350 , 350 - 375 , 375 - 400 , 400 - 425 , 425 - 450 , 450 - 475 , 475 - 500 , 500 - 525 , 525 - 550 , 550 - 575 , 575 - 600 , 600 - 625 , 625 - 650 , 650 - 675 , 675 - 700 , 700 - 725 | ||
| Click To Change The Sort Order: By Market Cap or Company Size Performance: Year-to-date, Week and Day | |
| Select Chart Type: | ||
|
Best Stocks Today 12Stocks.com |
© 2024 12Stocks.com Terms & Conditions Privacy Contact Us
All Information Provided Only For Education And Not To Be Used For Investing or Trading. See Terms & Conditions


One More Thing ... Get Best Stocks Delivered Daily!
Never Ever Miss A Move With Our Top Ten Stocks Lists
Find Best Stocks In Any Market - Bull or Bear Market
Take A Peek At Our Top Ten Stocks Lists: Daily, Weekly, Year-to-Date & Top Trends
Find Best Stocks In Any Market - Bull or Bear Market
Take A Peek At Our Top Ten Stocks Lists: Daily, Weekly, Year-to-Date & Top Trends
Healthcare Stocks With Best Up Trends [0-bearish to 100-bullish]: Annovis Bio[100], Boston Scientific[100], Integer [100], Quest Diagnostics[100], AstraZeneca [100], Oscar Health[100], PureTech Health[100], Glaukos [100], Agios [100], Pieris [100], Avadel [100]
Best Healthcare Stocks Year-to-Date:
Pieris [6427.47%], Precision BioSciences[2590.41%], Inovio [1892.16%], Assembly Biosciences[1543.7%], Aurora Cannabis[1411.97%], Adverum Biotechnologies[1253.61%], NuCana [1198.17%], Agenus [796.24%], Affimed N.V[680.8%], CareMax [574.23%], Corbus [488.41%] Best Healthcare Stocks This Week:
Pieris [8093.1%], Aesthetic [53.58%], Agenus [39.74%], BeyondSpring [35%], Seres [30.29%], VolitionRx [29.87%], Annovis Bio[27.4%], CareMax [27.24%], ProKidney [23.28%], GeneDx [22.61%], Cullinan Oncology[20.69%] Best Healthcare Stocks Daily:
Aesthetic [44.75%], Agenus [14.86%], Apyx [13.64%], Cullinan Oncology[13.55%], Amneal [12.04%], HOOKIPA Pharma[11.11%], Gritstone Oncology[10.06%], DURECT [9.75%], Sage [8.11%], Relay [7.46%], Annovis Bio[7.24%]