
 Login Sign Up


| |||||
 |  | ||||

| 12Stocks.com Market Intelligence |
Best Financial Stocks
| In a hurry? Financial Stocks Lists: Performance Trends Table, Stock Charts
Sort Financial stocks: Daily, Weekly, Year-to-Date, Market Cap & Trends. Filter Financial stocks list by size:All Financial Large Mid-Range Small & MicroCap |
| 12Stocks.com Financial Stocks Performances & Trends Daily | |||||||||
|
|  The overall Smart Investing & Trading Score is 33 (0-bearish to 100-bullish) which puts Financial sector in short term bearish to neutral trend. The Smart Investing & Trading Score from previous trading session is 26 and hence an improvement of trend.
| ||||||||
Here are the Smart Investing & Trading Scores of the most requested Financial stocks at 12Stocks.com (click stock name for detailed review):
|


| 12Stocks.com: Investing in Financial sector with Stocks | |
|
The following table helps investors and traders sort through current performance and trends (as measured by Smart Investing & Trading Score) of various
stocks in the Financial sector. Quick View: Move mouse or cursor over stock symbol (ticker) to view short-term Technical chart and over stock name to view long term chart. Click on  to add stock symbol to your watchlist and to add stock symbol to your watchlist and  to view watchlist. Click on any ticker or stock name for detailed market intelligence report for that stock. to view watchlist. Click on any ticker or stock name for detailed market intelligence report for that stock. |
12Stocks.com Performance of Stocks in Financial Sector
| Ticker | Stock Name | Watchlist | Category | Recent Price | Trend Score | Change % | YTD Change% |
| WTBA | West Ban |   | Regional - Southwest Banks | 18.35 | 25 | 2.17% | -14.28% |
| UBSI | United Bankshares | | Regional Banks | 35.77 | 25 | 2.11% | -3.69% |
| WASH | Washington Trust | | Regional Banks | 26.97 | 25 | 2.04% | -10.79% |
| SLM | SLM | | Credit Services | 31.86 | 25 | 2.02% | 16.04% |
| GOOD | Gladstone Commercial | | REIT - | 13.24 | 25 | 1.77% | -16.30% |
| OLP | One Liberty | | REIT - | 22.45 | 25 | 1.54% | -16.16% |
| CBSH | Commerce Bancshares | | Regional Banks | 60.81 | 25 | 1.49% | -1.96% |
| EFX | Equifax | | Credit Services | 243.24 | 25 | 1.35% | -4.40% |
| LXP | Lexington Realty | | REIT - | 7.85 | 25 | 1.29% | -1.81% |
| NMIH | NMI | | Insurance | 37.60 | 25 | 1.10% | 2.29% |
| AGM | Federal Agricultural | | Credit Services | 172.07 | 25 | 1.05% | -11.94% |
| AXS | AXIS Capital | | Insurance | 94.09 | 25 | 0.81% | 6.64% |
| STWD | Starwood Property | | Mortgage | 19.51 | 25 | 0.72% | 5.51% |
| BRO | Brown & Brown | | Insurance | 92.70 | 25 | 0.50% | -9.01% |
| SAFE | Safehold | | REIT - | 14.15 | 25 | 0.43% | -22.67% |
| PB | Prosperity Bancshares | | Regional - Southwest Banks | 66.19 | 25 | 0.41% | -11.42% |
| SKWD | Skyward Specialty | | Insurance - Property & Casualty | 49.57 | 25 | 0.36% | -1.92% |
| KNSL | Kinsale Capital | | Insurance | 445.49 | 25 | 0.22% | -4.18% |
| AJG | Arthur J. | | Insurance | 284.61 | 25 | 0.15% | 0.46% |
| MPW | Medical Properties | | REIT | 4.04 | 25 | -0.49% | 3.66% |
| IFN | India Fund | | Asset Mgmt | 15.45 | 25 | -0.58% | 1.03% |
| LCNB | LCNB | | Regional Banks | 14.59 | 23 | 2.75% | -2.18% |
| ONB | Old National | | Regional Banks | 20.77 | 23 | 1.81% | -3.71% |
| VEL | Velocity | | Mortgage Finance | 16.64 | 23 | 1.77% | -14.93% |
| FRME | First Merchants | | Regional Banks | 37.49 | 23 | 1.02% | -5.23% |
| For chart view version of above stock list: Chart View ➞ 0 - 25 , 25 - 50 , 50 - 75 , 75 - 100 , 100 - 125 , 125 - 150 , 150 - 175 , 175 - 200 , 200 - 225 , 225 - 250 , 250 - 275 , 275 - 300 , 300 - 325 , 325 - 350 , 350 - 375 , 375 - 400 , 400 - 425 , 425 - 450 , 450 - 475 , 475 - 500 , 500 - 525 , 525 - 550 , 550 - 575 | ||
 | Click To Change The Sort Order: By Market Cap or Company Size Performance: Year-to-date, Week and Day |  |
|
Get the most comprehensive stock market coverage daily at 12Stocks.com ➞ Best Stocks Today ➞ Best Stocks Weekly ➞ Best Stocks Year-to-Date ➞ Best Stocks Trends ➞  Best Stocks Today 12Stocks.com Best Nasdaq Stocks ➞ Best S&P 500 Stocks ➞ Best Tech Stocks ➞ Best Biotech Stocks ➞ |
| Detailed Overview of Financial Stocks |
| Financial Technical Overview, Leaders & Laggards, Top Financial ETF Funds & Detailed Financial Stocks List, Charts, Trends & More |
| Financial Sector: Technical Analysis, Trends & YTD Performance | |
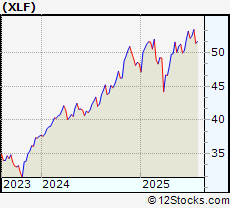
| Financial sector is composed of stocks
from banks, brokers, insurance, REITs
and services subsectors. Financial sector, as represented by XLF, an exchange-traded fund [ETF] that holds basket of Financial stocks (e.g, Bank of America, Goldman Sachs) is up by 7.8% and is currently outperforming the overall market by 0.27% year-to-date. Below is a quick view of Technical charts and trends: |
|
 XLF Weekly Chart |
|
| Long Term Trend: Good | |
| Medium Term Trend: Not Good | |
 XLF Daily Chart |
|
| Short Term Trend: Not Good | |
| Overall Trend Score: 33 | |
| YTD Performance: 7.8% | |
| **Trend Scores & Views Are Only For Educational Purposes And Not For Investing | |
| 12Stocks.com: Top Performing Financial Sector Stocks | ||||||||||||||||||||||||||||||||||||||||||||||||
 The top performing Financial sector stocks year to date are
Now, more recently, over last week, the top performing Financial sector stocks on the move are


|
||||||||||||||||||||||||||||||||||||||||||||||||
| 12Stocks.com: Investing in Financial Sector using Exchange Traded Funds | |
|
The following table shows list of key exchange traded funds (ETF) that
help investors track Financial Index. For detailed view, check out our ETF Funds section of our website. Quick View: Move mouse or cursor over ETF symbol (ticker) to view short-term Technical chart and over ETF name to view long term chart. Click on ticker or stock name for detailed view. Click on to add stock symbol to your watchlist and to view watchlist. |
12Stocks.com List of ETFs that track Financial Index
| Ticker | ETF Name | Watchlist | Recent Price | Smart Investing & Trading Score | Change % | Week % | Year-to-date % |
| XLF | Financial | | 51.91 | 33 | 0.99 | 0.99 | 7.8% |
| IAI | Broker-Dealers & Secs | | 174.97 | 63 | 2.34 | 2.34 | 21.82% |
| KBE | Bank | | 55.98 | 43 | 1.3 | 1.3 | 1.64% |
| FAS | Financial Bull 3X | | 161.82 | 33 | 2.91 | 2.91 | 7.48% |
| FAZ | Financial Bear 3X | | 4.54 | 62 | -2.78 | -2.78 | -27.4% |
| UYG | Financials | | 92.87 | 26 | 1.72 | 1.72 | 9% |
| KIE | Insurance | | 56.42 | 25 | 1.27 | 1.27 | 0.32% |
| 12Stocks.com: Charts, Trends, Fundamental Data and Performances of Financial Stocks | |
|
We now take in-depth look at all Financial stocks including charts, multi-period performances and overall trends (as measured by Smart Investing & Trading Score). One can sort Financial stocks (click link to choose) by Daily, Weekly and by Year-to-Date performances. Also, one can sort by size of the company or by market capitalization. |
| Select Your Default Chart Type: | |||||
| |||||
| Click on stock symbol or name for detailed view. Click on to add stock symbol to your watchlist and to view watchlist. Quick View: Move mouse or cursor over "Daily" to quickly view daily Technical stock chart and over "Weekly" to view weekly Technical stock chart. | |||||

 | WTBA West Bancorporation, Inc. |
| Sector: Financials | |
| SubSector: Regional - Southwest Banks | |
| MarketCap: 272.965 Millions | |
| Recent Price: 18.35 Smart Investing & Trading Score: 25 | |
| Day Percent Change: 2.17% Day Change: 0.39 | |
| Week Change: 2.17% Year-to-date Change: -14.3% | |
| WTBA Links: Profile News Message Board | |
| Charts:- Daily , Weekly | |
| Add WTBA to Watchlist: View: Get Complete WTBA Trend Analysis ➞ | |
 | UBSI United Bankshares, Inc. |
| Sector: Financials | |
| SubSector: Regional - Mid-Atlantic Banks | |
| MarketCap: 2286.79 Millions | |
| Recent Price: 35.77 Smart Investing & Trading Score: 25 | |
| Day Percent Change: 2.11% Day Change: 0.74 | |
| Week Change: 2.11% Year-to-date Change: -3.7% | |
| UBSI Links: Profile News Message Board | |
| Charts:- Daily , Weekly | |
| Add UBSI to Watchlist: View: Get Complete UBSI Trend Analysis ➞ | |
 | WASH Washington Trust Bancorp, Inc. |
| Sector: Financials | |
| SubSector: Regional - Northeast Banks | |
| MarketCap: 590.099 Millions | |
| Recent Price: 26.97 Smart Investing & Trading Score: 25 | |
| Day Percent Change: 2.04% Day Change: 0.54 | |
| Week Change: 2.04% Year-to-date Change: -10.8% | |
| WASH Links: Profile News Message Board | |
| Charts:- Daily , Weekly | |
| Add WASH to Watchlist: View: Get Complete WASH Trend Analysis ➞ | |
 | SLM SLM Corporation |
| Sector: Financials | |
| SubSector: Credit Services | |
| MarketCap: 3099.78 Millions | |
| Recent Price: 31.86 Smart Investing & Trading Score: 25 | |
| Day Percent Change: 2.02% Day Change: 0.63 | |
| Week Change: 2.02% Year-to-date Change: 16.0% | |
| SLM Links: Profile News Message Board | |
| Charts:- Daily , Weekly | |
| Add SLM to Watchlist: View: Get Complete SLM Trend Analysis ➞ | |
 | GOOD Gladstone Commercial Corporation |
| Sector: Financials | |
| SubSector: REIT - Diversified | |
| MarketCap: 425.253 Millions | |
| Recent Price: 13.24 Smart Investing & Trading Score: 25 | |
| Day Percent Change: 1.77% Day Change: 0.23 | |
| Week Change: 1.77% Year-to-date Change: -16.3% | |
| GOOD Links: Profile News Message Board | |
| Charts:- Daily , Weekly | |
| Add GOOD to Watchlist: View: Get Complete GOOD Trend Analysis ➞ | |
 | OLP One Liberty Properties, Inc. |
| Sector: Financials | |
| SubSector: REIT - Diversified | |
| MarketCap: 378.353 Millions | |
| Recent Price: 22.45 Smart Investing & Trading Score: 25 | |
| Day Percent Change: 1.54% Day Change: 0.34 | |
| Week Change: 1.54% Year-to-date Change: -16.2% | |
| OLP Links: Profile News Message Board | |
| Charts:- Daily , Weekly | |
| Add OLP to Watchlist: View: Get Complete OLP Trend Analysis ➞ | |
 | CBSH Commerce Bancshares, Inc. |
| Sector: Financials | |
| SubSector: Regional - Midwest Banks | |
| MarketCap: 6201.5 Millions | |
| Recent Price: 60.81 Smart Investing & Trading Score: 25 | |
| Day Percent Change: 1.49% Day Change: 0.89 | |
| Week Change: 1.49% Year-to-date Change: -2.0% | |
| CBSH Links: Profile News Message Board | |
| Charts:- Daily , Weekly | |
| Add CBSH to Watchlist: View: Get Complete CBSH Trend Analysis ➞ | |
 | EFX Equifax Inc. |
| Sector: Financials | |
| SubSector: Credit Services | |
| MarketCap: 13754.6 Millions | |
| Recent Price: 243.24 Smart Investing & Trading Score: 25 | |
| Day Percent Change: 1.35% Day Change: 3.25 | |
| Week Change: 1.35% Year-to-date Change: -4.4% | |
| EFX Links: Profile News Message Board | |
| Charts:- Daily , Weekly | |
| Add EFX to Watchlist: View: Get Complete EFX Trend Analysis ➞ | |
 | LXP Lexington Realty Trust |
| Sector: Financials | |
| SubSector: REIT - Diversified | |
| MarketCap: 2483.43 Millions | |
| Recent Price: 7.85 Smart Investing & Trading Score: 25 | |
| Day Percent Change: 1.29% Day Change: 0.1 | |
| Week Change: 1.29% Year-to-date Change: -1.8% | |
| LXP Links: Profile News Message Board | |
| Charts:- Daily , Weekly | |
| Add LXP to Watchlist: View: Get Complete LXP Trend Analysis ➞ | |
 | NMIH NMI Holdings, Inc. |
| Sector: Financials | |
| SubSector: Surety & Title Insurance | |
| MarketCap: 816.018 Millions | |
| Recent Price: 37.60 Smart Investing & Trading Score: 25 | |
| Day Percent Change: 1.1% Day Change: 0.41 | |
| Week Change: 1.1% Year-to-date Change: 2.3% | |
| NMIH Links: Profile News Message Board | |
| Charts:- Daily , Weekly | |
| Add NMIH to Watchlist: View: Get Complete NMIH Trend Analysis ➞ | |
 | AGM Federal Agricultural Mortgage Corporation |
| Sector: Financials | |
| SubSector: Credit Services | |
| MarketCap: 542.008 Millions | |
| Recent Price: 172.07 Smart Investing & Trading Score: 25 | |
| Day Percent Change: 1.05% Day Change: 1.79 | |
| Week Change: 1.05% Year-to-date Change: -11.9% | |
| AGM Links: Profile News Message Board | |
| Charts:- Daily , Weekly | |
| Add AGM to Watchlist: View: Get Complete AGM Trend Analysis ➞ | |
 | AXS AXIS Capital Holdings Limited |
| Sector: Financials | |
| SubSector: Property & Casualty Insurance | |
| MarketCap: 3709.12 Millions | |
| Recent Price: 94.09 Smart Investing & Trading Score: 25 | |
| Day Percent Change: 0.81% Day Change: 0.76 | |
| Week Change: 0.81% Year-to-date Change: 6.6% | |
| AXS Links: Profile News Message Board | |
| Charts:- Daily , Weekly | |
| Add AXS to Watchlist: View: Get Complete AXS Trend Analysis ➞ | |
 | STWD Starwood Property Trust, Inc. |
| Sector: Financials | |
| SubSector: Mortgage Investment | |
| MarketCap: 3447.09 Millions | |
| Recent Price: 19.51 Smart Investing & Trading Score: 25 | |
| Day Percent Change: 0.72% Day Change: 0.14 | |
| Week Change: 0.72% Year-to-date Change: 5.5% | |
| STWD Links: Profile News Message Board | |
| Charts:- Daily , Weekly | |
| Add STWD to Watchlist: View: Get Complete STWD Trend Analysis ➞ | |
 | BRO Brown & Brown, Inc. |
| Sector: Financials | |
| SubSector: Insurance Brokers | |
| MarketCap: 10475.7 Millions | |
| Recent Price: 92.70 Smart Investing & Trading Score: 25 | |
| Day Percent Change: 0.5% Day Change: 0.46 | |
| Week Change: 0.5% Year-to-date Change: -9.0% | |
| BRO Links: Profile News Message Board | |
| Charts:- Daily , Weekly | |
| Add BRO to Watchlist: View: Get Complete BRO Trend Analysis ➞ | |
 | SAFE Safehold Inc. |
| Sector: Financials | |
| SubSector: REIT - Diversified | |
| MarketCap: 2994.63 Millions | |
| Recent Price: 14.15 Smart Investing & Trading Score: 25 | |
| Day Percent Change: 0.43% Day Change: 0.06 | |
| Week Change: 0.43% Year-to-date Change: -22.7% | |
| SAFE Links: Profile News Message Board | |
| Charts:- Daily , Weekly | |
| Add SAFE to Watchlist: View: Get Complete SAFE Trend Analysis ➞ | |
 | PB Prosperity Bancshares, Inc. |
| Sector: Financials | |
| SubSector: Regional - Southwest Banks | |
| MarketCap: 4682.25 Millions | |
| Recent Price: 66.19 Smart Investing & Trading Score: 25 | |
| Day Percent Change: 0.41% Day Change: 0.27 | |
| Week Change: 0.41% Year-to-date Change: -11.4% | |
| PB Links: Profile News Message Board | |
| Charts:- Daily , Weekly | |
| Add PB to Watchlist: View: Get Complete PB Trend Analysis ➞ | |
 | SKWD Skyward Specialty Insurance Group, Inc. |
| Sector: Financials | |
| SubSector: Insurance - Property & Casualty | |
| MarketCap: 936 Millions | |
| Recent Price: 49.57 Smart Investing & Trading Score: 25 | |
| Day Percent Change: 0.36% Day Change: 0.18 | |
| Week Change: 0.36% Year-to-date Change: -1.9% | |
| SKWD Links: Profile News Message Board | |
| Charts:- Daily , Weekly | |
| Add SKWD to Watchlist: View: Get Complete SKWD Trend Analysis ➞ | |
 | KNSL Kinsale Capital Group, Inc. |
| Sector: Financials | |
| SubSector: Property & Casualty Insurance | |
| MarketCap: 2198.12 Millions | |
| Recent Price: 445.49 Smart Investing & Trading Score: 25 | |
| Day Percent Change: 0.22% Day Change: 1 | |
| Week Change: 0.22% Year-to-date Change: -4.2% | |
| KNSL Links: Profile News Message Board | |
| Charts:- Daily , Weekly | |
| Add KNSL to Watchlist: View: Get Complete KNSL Trend Analysis ➞ | |
 | AJG Arthur J. Gallagher & Co. |
| Sector: Financials | |
| SubSector: Insurance Brokers | |
| MarketCap: 14852.2 Millions | |
| Recent Price: 284.61 Smart Investing & Trading Score: 25 | |
| Day Percent Change: 0.15% Day Change: 0.44 | |
| Week Change: 0.15% Year-to-date Change: 0.5% | |
| AJG Links: Profile News Message Board | |
| Charts:- Daily , Weekly | |
| Add AJG to Watchlist: View: Get Complete AJG Trend Analysis ➞ | |
 | MPW Medical Properties Trust, Inc. |
| Sector: Financials | |
| SubSector: REIT - Healthcare Facilities | |
| MarketCap: 8586.74 Millions | |
| Recent Price: 4.04 Smart Investing & Trading Score: 25 | |
| Day Percent Change: -0.49% Day Change: -0.02 | |
| Week Change: -0.49% Year-to-date Change: 3.7% | |
| MPW Links: Profile News Message Board | |
| Charts:- Daily , Weekly | |
| Add MPW to Watchlist: View: Get Complete MPW Trend Analysis ➞ | |
 | IFN The India Fund, Inc. |
| Sector: Financials | |
| SubSector: Asset Management | |
| MarketCap: 344.303 Millions | |
| Recent Price: 15.45 Smart Investing & Trading Score: 25 | |
| Day Percent Change: -0.58% Day Change: -0.09 | |
| Week Change: -0.58% Year-to-date Change: 1.0% | |
| IFN Links: Profile News Message Board | |
| Charts:- Daily , Weekly | |
| Add IFN to Watchlist: View: Get Complete IFN Trend Analysis ➞ | |
 | LCNB LCNB Corp. |
| Sector: Financials | |
| SubSector: Regional - Mid-Atlantic Banks | |
| MarketCap: 176.759 Millions | |
| Recent Price: 14.59 Smart Investing & Trading Score: 23 | |
| Day Percent Change: 2.75% Day Change: 0.39 | |
| Week Change: 2.75% Year-to-date Change: -2.2% | |
| LCNB Links: Profile News Message Board | |
| Charts:- Daily , Weekly | |
| Add LCNB to Watchlist: View: Get Complete LCNB Trend Analysis ➞ | |
 | ONB Old National Bancorp |
| Sector: Financials | |
| SubSector: Regional - Midwest Banks | |
| MarketCap: 2340.8 Millions | |
| Recent Price: 20.77 Smart Investing & Trading Score: 23 | |
| Day Percent Change: 1.81% Day Change: 0.37 | |
| Week Change: 1.81% Year-to-date Change: -3.7% | |
| ONB Links: Profile News Message Board | |
| Charts:- Daily , Weekly | |
| Add ONB to Watchlist: View: Get Complete ONB Trend Analysis ➞ | |
 | VEL Velocity Financial, Inc. |
| Sector: Financials | |
| SubSector: Mortgage Finance | |
| MarketCap: 12157 Millions | |
| Recent Price: 16.64 Smart Investing & Trading Score: 23 | |
| Day Percent Change: 1.77% Day Change: 0.29 | |
| Week Change: 1.77% Year-to-date Change: -14.9% | |
| VEL Links: Profile News Message Board | |
| Charts:- Daily , Weekly | |
| Add VEL to Watchlist: View: Get Complete VEL Trend Analysis ➞ | |
 | FRME First Merchants Corporation |
| Sector: Financials | |
| SubSector: Regional - Midwest Banks | |
| MarketCap: 1490.4 Millions | |
| Recent Price: 37.49 Smart Investing & Trading Score: 23 | |
| Day Percent Change: 1.02% Day Change: 0.38 | |
| Week Change: 1.02% Year-to-date Change: -5.2% | |
| FRME Links: Profile News Message Board | |
| Charts:- Daily , Weekly | |
| Add FRME to Watchlist: View: Get Complete FRME Trend Analysis ➞ | |
| For tabular summary view of above stock list: Summary View ➞ 0 - 25 , 25 - 50 , 50 - 75 , 75 - 100 , 100 - 125 , 125 - 150 , 150 - 175 , 175 - 200 , 200 - 225 , 225 - 250 , 250 - 275 , 275 - 300 , 300 - 325 , 325 - 350 , 350 - 375 , 375 - 400 , 400 - 425 , 425 - 450 , 450 - 475 , 475 - 500 , 500 - 525 , 525 - 550 , 550 - 575 | ||
| Click To Change The Sort Order: By Market Cap or Company Size Performance: Year-to-date, Week and Day | |
| Select Chart Type: | ||
|
Best Stocks Today 12Stocks.com |
© 2025 12Stocks.com Terms & Conditions Privacy Contact Us
All Information Provided Only For Education And Not To Be Used For Investing or Trading. See Terms & Conditions


One More Thing ... Get Best Stocks Delivered Daily!
Never Ever Miss A Move With Our Top Ten Stocks Lists
Find Best Stocks In Any Market - Bull or Bear Market
Take A Peek At Our Top Ten Stocks Lists: Daily, Weekly, Year-to-Date & Top Trends
Find Best Stocks In Any Market - Bull or Bear Market
Take A Peek At Our Top Ten Stocks Lists: Daily, Weekly, Year-to-Date & Top Trends
Financial Stocks With Best Up Trends [0-bearish to 100-bullish]: Uniti [100], LendingTree [100], Mercury General[100], Perella Weinberg[100], Broadstone Net[100], LendingClub [100], TPG RE[100], CareTrust REIT[100], Stewart Information[100], Healthcare Realty[100], VICI Properties[100]
Best Financial Stocks Year-to-Date:
ESSA Bancorp[3207.77%], Easterly Government[108.45%], Mr. Cooper[86.58%], Heritage Insurance[75.29%], Root [65.29%], Industrial Logistics[64.89%], Rocket [58.42%], Diversified Healthcare[49.61%], ProAssurance [49.59%], Uniti [47.09%], SoFi Technologies[41.62%] Best Financial Stocks This Week:
Uniti [64.77%], Industrial Logistics[11.36%], LendingTree [7.32%], eXp World[7.27%], EverQuote [6.89%], Camping World[6.84%], First Foundation[6.69%], Diamond Hill[5.46%], Mercury General[5.36%], Cipher Mining[5.27%], AlTi Global[5.13%] Best Financial Stocks Daily:
Uniti [64.77%], Industrial Logistics[11.36%], LendingTree [7.32%], eXp World[7.27%], EverQuote [6.89%], Camping World[6.84%], First Foundation[6.69%], Diamond Hill[5.46%], Mercury General[5.36%], Cipher Mining[5.27%], AlTi Global[5.13%]