
 Login Sign Up


| |||||
 |  | ||||

| 12Stocks.com Market Intelligence |
Best Financial Stocks
| In a hurry? Financial Stocks Lists: Performance Trends Table, Stock Charts
Sort Financial stocks: Daily, Weekly, Year-to-Date, Market Cap & Trends. Filter Financial stocks list by size:All Financial Large Mid-Range Small & MicroCap |
| 12Stocks.com Financial Stocks Performances & Trends Daily | |||||||||
|
|  The overall Smart Investing & Trading Score is 33 (0-bearish to 100-bullish) which puts Financial sector in short term bearish to neutral trend. The Smart Investing & Trading Score from previous trading session is 26 and hence an improvement of trend.
| ||||||||
Here are the Smart Investing & Trading Scores of the most requested Financial stocks at 12Stocks.com (click stock name for detailed review):
|


| 12Stocks.com: Investing in Financial sector with Stocks | |
|
The following table helps investors and traders sort through current performance and trends (as measured by Smart Investing & Trading Score) of various
stocks in the Financial sector. Quick View: Move mouse or cursor over stock symbol (ticker) to view short-term Technical chart and over stock name to view long term chart. Click on  to add stock symbol to your watchlist and to add stock symbol to your watchlist and  to view watchlist. Click on any ticker or stock name for detailed market intelligence report for that stock. to view watchlist. Click on any ticker or stock name for detailed market intelligence report for that stock. |
12Stocks.com Performance of Stocks in Financial Sector
| Ticker | Stock Name | Watchlist | Category | Recent Price | Trend Score | Change % | YTD Change% |
| UNTY | Unity Bancorp |   | Banks | 47.88 | 36 | 0.06% | 10.16% |
| BSRR | Sierra Bancorp | | Regional Banks | 28.60 | 36 | 0.03% | -0.28% |
| AUB | Atlantic Union | | Regional Banks | 31.23 | 36 | -0.22% | -16.81% |
| PLMR | Palomar | | Insurance | 131.53 | 35 | 1.47% | 24.57% |
| CWH | Camping World | | REIT - Office | 14.84 | 35 | 6.84% | -29.05% |
| ECPG | Encore Capital | | Asset Mgmt | 37.05 | 35 | 3.00% | -22.44% |
| UFCS | United Fire | | Insurance | 26.66 | 35 | 2.11% | -5.76% |
| BHF | Brighthouse | | Life Insurance | 46.96 | 35 | 1.69% | -2.25% |
| STAG | STAG Industrial | | REIT - Industrial | 34.87 | 35 | 1.40% | 4.20% |
| SHO | Sunstone Hotel | | REIT | 8.75 | 35 | 1.27% | -25.39% |
| ORI | Old Republic | | Insurance | 36.35 | 35 | 1.23% | 7.18% |
| AMH | American Homes | | REIT | 35.48 | 35 | 0.82% | -4.36% |
| MFA | MFA | | Mortgage | 9.19 | 35 | 0.66% | -6.63% |
| NAVI | Navient | | Credit Services | 12.71 | 35 | 0.39% | -3.24% |
| CB | Chubb | | Insurance | 267.74 | 35 | 0.13% | -2.79% |
| ABCB | Ameris Bancorp | | Regional Banks | 66.60 | 33 | 1.05% | 6.81% |
| PKBK | Parke Bancorp | | Regional Banks | 20.36 | 33 | 0.27% | 1.21% |
| CHCO | City Holding | | Regional Banks | 120.95 | 33 | 0.16% | 3.51% |
| BKU | BankUnited | | Regional Banks | 35.80 | 33 | 0.14% | -4.47% |
| SFNC | Simmons First | | Banks | 19.04 | 33 | 0.11% | -13.24% |
| VIRT | Virtu | | Brokerage | 43.41 | 33 | 0.09% | 22.49% |
| NFBK | Northfield Bancorp | | Regional Banks | 10.74 | 32 | 3.27% | -6.55% |
| IBKR | Interactive Brokers | | Brokerage | 64.90 | 32 | 2.03% | -63.22% |
| FIHL | Fidelis Insurance | | Insurance - | 15.15 | 32 | 1.88% | -15.86% |
| EQH | Equitable | | Insurance | 50.99 | 32 | 1.80% | 8.61% |
| For chart view version of above stock list: Chart View ➞ 0 - 25 , 25 - 50 , 50 - 75 , 75 - 100 , 100 - 125 , 125 - 150 , 150 - 175 , 175 - 200 , 200 - 225 , 225 - 250 , 250 - 275 , 275 - 300 , 300 - 325 , 325 - 350 , 350 - 375 , 375 - 400 , 400 - 425 , 425 - 450 , 450 - 475 , 475 - 500 , 500 - 525 , 525 - 550 , 550 - 575 | ||
 | Click To Change The Sort Order: By Market Cap or Company Size Performance: Year-to-date, Week and Day |  |
|
Get the most comprehensive stock market coverage daily at 12Stocks.com ➞ Best Stocks Today ➞ Best Stocks Weekly ➞ Best Stocks Year-to-Date ➞ Best Stocks Trends ➞  Best Stocks Today 12Stocks.com Best Nasdaq Stocks ➞ Best S&P 500 Stocks ➞ Best Tech Stocks ➞ Best Biotech Stocks ➞ |
| Detailed Overview of Financial Stocks |
| Financial Technical Overview, Leaders & Laggards, Top Financial ETF Funds & Detailed Financial Stocks List, Charts, Trends & More |
| Financial Sector: Technical Analysis, Trends & YTD Performance | |
| Financial sector is composed of stocks
from banks, brokers, insurance, REITs
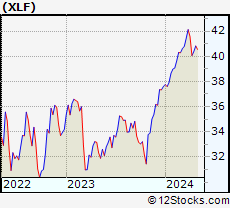
and services subsectors. Financial sector, as represented by XLF, an exchange-traded fund [ETF] that holds basket of Financial stocks (e.g, Bank of America, Goldman Sachs) is up by 7.8% and is currently outperforming the overall market by 0.27% year-to-date. Below is a quick view of Technical charts and trends: |
|
 XLF Weekly Chart |
|
| Long Term Trend: Good | |
| Medium Term Trend: Not Good | |
 XLF Daily Chart |
|
| Short Term Trend: Not Good | |
| Overall Trend Score: 33 | |
| YTD Performance: 7.8% | |
| **Trend Scores & Views Are Only For Educational Purposes And Not For Investing | |
| 12Stocks.com: Top Performing Financial Sector Stocks | ||||||||||||||||||||||||||||||||||||||||||||||||
 The top performing Financial sector stocks year to date are
Now, more recently, over last week, the top performing Financial sector stocks on the move are


|
||||||||||||||||||||||||||||||||||||||||||||||||
| 12Stocks.com: Investing in Financial Sector using Exchange Traded Funds | |
|
The following table shows list of key exchange traded funds (ETF) that
help investors track Financial Index. For detailed view, check out our ETF Funds section of our website. Quick View: Move mouse or cursor over ETF symbol (ticker) to view short-term Technical chart and over ETF name to view long term chart. Click on ticker or stock name for detailed view. Click on to add stock symbol to your watchlist and to view watchlist. |
12Stocks.com List of ETFs that track Financial Index
| Ticker | ETF Name | Watchlist | Recent Price | Smart Investing & Trading Score | Change % | Week % | Year-to-date % |
| XLF | Financial | | 51.91 | 33 | 0.99 | 0.99 | 7.8% |
| IAI | Broker-Dealers & Secs | | 174.97 | 63 | 2.34 | 2.34 | 21.82% |
| KBE | Bank | | 55.98 | 43 | 1.3 | 1.3 | 1.64% |
| FAS | Financial Bull 3X | | 161.82 | 33 | 2.91 | 2.91 | 7.48% |
| FAZ | Financial Bear 3X | | 4.54 | 62 | -2.78 | -2.78 | -27.4% |
| UYG | Financials | | 92.87 | 26 | 1.72 | 1.72 | 9% |
| KIE | Insurance | | 56.42 | 25 | 1.27 | 1.27 | 0.32% |
| 12Stocks.com: Charts, Trends, Fundamental Data and Performances of Financial Stocks | |
|
We now take in-depth look at all Financial stocks including charts, multi-period performances and overall trends (as measured by Smart Investing & Trading Score). One can sort Financial stocks (click link to choose) by Daily, Weekly and by Year-to-Date performances. Also, one can sort by size of the company or by market capitalization. |
| Select Your Default Chart Type: | |||||
| |||||
| Click on stock symbol or name for detailed view. Click on to add stock symbol to your watchlist and to view watchlist. Quick View: Move mouse or cursor over "Daily" to quickly view daily Technical stock chart and over "Weekly" to view weekly Technical stock chart. | |||||

 | UNTY Unity Bancorp, Inc. |
| Sector: Financials | |
| SubSector: Money Center Banks | |
| MarketCap: 149.099 Millions | |
| Recent Price: 47.88 Smart Investing & Trading Score: 36 | |
| Day Percent Change: 0.06% Day Change: 0.03 | |
| Week Change: 0.06% Year-to-date Change: 10.2% | |
| UNTY Links: Profile News Message Board | |
| Charts:- Daily , Weekly | |
| Add UNTY to Watchlist: View: Get Complete UNTY Trend Analysis ➞ | |
 | BSRR Sierra Bancorp |
| Sector: Financials | |
| SubSector: Regional - Pacific Banks | |
| MarketCap: 256.929 Millions | |
| Recent Price: 28.60 Smart Investing & Trading Score: 36 | |
| Day Percent Change: 0.03% Day Change: 0.01 | |
| Week Change: 0.03% Year-to-date Change: -0.3% | |
| BSRR Links: Profile News Message Board | |
| Charts:- Daily , Weekly | |
| Add BSRR to Watchlist: View: Get Complete BSRR Trend Analysis ➞ | |
 | AUB Atlantic Union Bankshares Corporation |
| Sector: Financials | |
| SubSector: Regional - Mid-Atlantic Banks | |
| MarketCap: 1728.79 Millions | |
| Recent Price: 31.23 Smart Investing & Trading Score: 36 | |
| Day Percent Change: -0.22% Day Change: -0.07 | |
| Week Change: -0.22% Year-to-date Change: -16.8% | |
| AUB Links: Profile News Message Board | |
| Charts:- Daily , Weekly | |
| Add AUB to Watchlist: View: Get Complete AUB Trend Analysis ➞ | |
 | PLMR Palomar Holdings, Inc. |
| Sector: Financials | |
| SubSector: Property & Casualty Insurance | |
| MarketCap: 1297.42 Millions | |
| Recent Price: 131.53 Smart Investing & Trading Score: 35 | |
| Day Percent Change: 1.47% Day Change: 1.91 | |
| Week Change: 1.47% Year-to-date Change: 24.6% | |
| PLMR Links: Profile News Message Board | |
| Charts:- Daily , Weekly | |
| Add PLMR to Watchlist: View: Get Complete PLMR Trend Analysis ➞ | |
 | CWH Camping World Holdings, Inc. |
| Sector: Financials | |
| SubSector: REIT - Office | |
| MarketCap: 473.566 Millions | |
| Recent Price: 14.84 Smart Investing & Trading Score: 35 | |
| Day Percent Change: 6.84% Day Change: 0.95 | |
| Week Change: 6.84% Year-to-date Change: -29.1% | |
| CWH Links: Profile News Message Board | |
| Charts:- Daily , Weekly | |
| Add CWH to Watchlist: View: Get Complete CWH Trend Analysis ➞ | |
 | ECPG Encore Capital Group, Inc. |
| Sector: Financials | |
| SubSector: Asset Management | |
| MarketCap: 661.503 Millions | |
| Recent Price: 37.05 Smart Investing & Trading Score: 35 | |
| Day Percent Change: 3% Day Change: 1.08 | |
| Week Change: 3% Year-to-date Change: -22.4% | |
| ECPG Links: Profile News Message Board | |
| Charts:- Daily , Weekly | |
| Add ECPG to Watchlist: View: Get Complete ECPG Trend Analysis ➞ | |
 | UFCS United Fire Group, Inc. |
| Sector: Financials | |
| SubSector: Property & Casualty Insurance | |
| MarketCap: 862.812 Millions | |
| Recent Price: 26.66 Smart Investing & Trading Score: 35 | |
| Day Percent Change: 2.11% Day Change: 0.55 | |
| Week Change: 2.11% Year-to-date Change: -5.8% | |
| UFCS Links: Profile News Message Board | |
| Charts:- Daily , Weekly | |
| Add UFCS to Watchlist: View: Get Complete UFCS Trend Analysis ➞ | |
 | BHF Brighthouse Financial, Inc. |
| Sector: Financials | |
| SubSector: Life Insurance | |
| MarketCap: 2045.06 Millions | |
| Recent Price: 46.96 Smart Investing & Trading Score: 35 | |
| Day Percent Change: 1.69% Day Change: 0.78 | |
| Week Change: 1.69% Year-to-date Change: -2.3% | |
| BHF Links: Profile News Message Board | |
| Charts:- Daily , Weekly | |
| Add BHF to Watchlist: View: Get Complete BHF Trend Analysis ➞ | |
 | STAG STAG Industrial, Inc. |
| Sector: Financials | |
| SubSector: REIT - Industrial | |
| MarketCap: 3767.49 Millions | |
| Recent Price: 34.87 Smart Investing & Trading Score: 35 | |
| Day Percent Change: 1.4% Day Change: 0.48 | |
| Week Change: 1.4% Year-to-date Change: 4.2% | |
| STAG Links: Profile News Message Board | |
| Charts:- Daily , Weekly | |
| Add STAG to Watchlist: View: Get Complete STAG Trend Analysis ➞ | |
 | SHO Sunstone Hotel Investors, Inc. |
| Sector: Financials | |
| SubSector: REIT - Hotel/Motel | |
| MarketCap: 1861.04 Millions | |
| Recent Price: 8.75 Smart Investing & Trading Score: 35 | |
| Day Percent Change: 1.27% Day Change: 0.11 | |
| Week Change: 1.27% Year-to-date Change: -25.4% | |
| SHO Links: Profile News Message Board | |
| Charts:- Daily , Weekly | |
| Add SHO to Watchlist: View: Get Complete SHO Trend Analysis ➞ | |
 | ORI Old Republic International Corporation |
| Sector: Financials | |
| SubSector: Property & Casualty Insurance | |
| MarketCap: 4420.92 Millions | |
| Recent Price: 36.35 Smart Investing & Trading Score: 35 | |
| Day Percent Change: 1.23% Day Change: 0.44 | |
| Week Change: 1.23% Year-to-date Change: 7.2% | |
| ORI Links: Profile News Message Board | |
| Charts:- Daily , Weekly | |
| Add ORI to Watchlist: View: Get Complete ORI Trend Analysis ➞ | |
 | AMH American Homes 4 Rent |
| Sector: Financials | |
| SubSector: REIT - Residential | |
| MarketCap: 6135.31 Millions | |
| Recent Price: 35.48 Smart Investing & Trading Score: 35 | |
| Day Percent Change: 0.82% Day Change: 0.29 | |
| Week Change: 0.82% Year-to-date Change: -4.4% | |
| AMH Links: Profile News Message Board | |
| Charts:- Daily , Weekly | |
| Add AMH to Watchlist: View: Get Complete AMH Trend Analysis ➞ | |
 | MFA MFA Financial, Inc. |
| Sector: Financials | |
| SubSector: Mortgage Investment | |
| MarketCap: 1869.69 Millions | |
| Recent Price: 9.19 Smart Investing & Trading Score: 35 | |
| Day Percent Change: 0.66% Day Change: 0.06 | |
| Week Change: 0.66% Year-to-date Change: -6.6% | |
| MFA Links: Profile News Message Board | |
| Charts:- Daily , Weekly | |
| Add MFA to Watchlist: View: Get Complete MFA Trend Analysis ➞ | |
 | NAVI Navient Corporation |
| Sector: Financials | |
| SubSector: Credit Services | |
| MarketCap: 1362.48 Millions | |
| Recent Price: 12.71 Smart Investing & Trading Score: 35 | |
| Day Percent Change: 0.39% Day Change: 0.05 | |
| Week Change: 0.39% Year-to-date Change: -3.2% | |
| NAVI Links: Profile News Message Board | |
| Charts:- Daily , Weekly | |
| Add NAVI to Watchlist: View: Get Complete NAVI Trend Analysis ➞ | |
 | CB Chubb Limited |
| Sector: Financials | |
| SubSector: Property & Casualty Insurance | |
| MarketCap: 51615.9 Millions | |
| Recent Price: 267.74 Smart Investing & Trading Score: 35 | |
| Day Percent Change: 0.13% Day Change: 0.34 | |
| Week Change: 0.13% Year-to-date Change: -2.8% | |
| CB Links: Profile News Message Board | |
| Charts:- Daily , Weekly | |
| Add CB to Watchlist: View: Get Complete CB Trend Analysis ➞ | |
 | ABCB Ameris Bancorp |
| Sector: Financials | |
| SubSector: Regional - Mid-Atlantic Banks | |
| MarketCap: 1537.79 Millions | |
| Recent Price: 66.60 Smart Investing & Trading Score: 33 | |
| Day Percent Change: 1.05% Day Change: 0.69 | |
| Week Change: 1.05% Year-to-date Change: 6.8% | |
| ABCB Links: Profile News Message Board | |
| Charts:- Daily , Weekly | |
| Add ABCB to Watchlist: View: Get Complete ABCB Trend Analysis ➞ | |
 | PKBK Parke Bancorp, Inc. |
| Sector: Financials | |
| SubSector: Regional - Northeast Banks | |
| MarketCap: 165.799 Millions | |
| Recent Price: 20.36 Smart Investing & Trading Score: 33 | |
| Day Percent Change: 0.27% Day Change: 0.05 | |
| Week Change: 0.27% Year-to-date Change: 1.2% | |
| PKBK Links: Profile News Message Board | |
| Charts:- Daily , Weekly | |
| Add PKBK to Watchlist: View: Get Complete PKBK Trend Analysis ➞ | |
 | CHCO City Holding Company |
| Sector: Financials | |
| SubSector: Regional - Mid-Atlantic Banks | |
| MarketCap: 1059.59 Millions | |
| Recent Price: 120.95 Smart Investing & Trading Score: 33 | |
| Day Percent Change: 0.16% Day Change: 0.19 | |
| Week Change: 0.16% Year-to-date Change: 3.5% | |
| CHCO Links: Profile News Message Board | |
| Charts:- Daily , Weekly | |
| Add CHCO to Watchlist: View: Get Complete CHCO Trend Analysis ➞ | |
 | BKU BankUnited, Inc. |
| Sector: Financials | |
| SubSector: Regional - Mid-Atlantic Banks | |
| MarketCap: 1905.99 Millions | |
| Recent Price: 35.80 Smart Investing & Trading Score: 33 | |
| Day Percent Change: 0.14% Day Change: 0.05 | |
| Week Change: 0.14% Year-to-date Change: -4.5% | |
| BKU Links: Profile News Message Board | |
| Charts:- Daily , Weekly | |
| Add BKU to Watchlist: View: Get Complete BKU Trend Analysis ➞ | |
 | SFNC Simmons First National Corporation |
| Sector: Financials | |
| SubSector: Money Center Banks | |
| MarketCap: 2125.49 Millions | |
| Recent Price: 19.04 Smart Investing & Trading Score: 33 | |
| Day Percent Change: 0.11% Day Change: 0.02 | |
| Week Change: 0.11% Year-to-date Change: -13.2% | |
| SFNC Links: Profile News Message Board | |
| Charts:- Daily , Weekly | |
| Add SFNC to Watchlist: View: Get Complete SFNC Trend Analysis ➞ | |
 | VIRT Virtu Financial, Inc. |
| Sector: Financials | |
| SubSector: Investment Brokerage - National | |
| MarketCap: 4305.15 Millions | |
| Recent Price: 43.41 Smart Investing & Trading Score: 33 | |
| Day Percent Change: 0.09% Day Change: 0.04 | |
| Week Change: 0.09% Year-to-date Change: 22.5% | |
| VIRT Links: Profile News Message Board | |
| Charts:- Daily , Weekly | |
| Add VIRT to Watchlist: View: Get Complete VIRT Trend Analysis ➞ | |
 | NFBK Northfield Bancorp, Inc. (Staten Island, NY) |
| Sector: Financials | |
| SubSector: Regional - Northeast Banks | |
| MarketCap: 540.699 Millions | |
| Recent Price: 10.74 Smart Investing & Trading Score: 32 | |
| Day Percent Change: 3.27% Day Change: 0.34 | |
| Week Change: 3.27% Year-to-date Change: -6.6% | |
| NFBK Links: Profile News Message Board | |
| Charts:- Daily , Weekly | |
| Add NFBK to Watchlist: View: Get Complete NFBK Trend Analysis ➞ | |
 | IBKR Interactive Brokers Group, Inc. |
| Sector: Financials | |
| SubSector: Investment Brokerage - National | |
| MarketCap: 16975.7 Millions | |
| Recent Price: 64.90 Smart Investing & Trading Score: 32 | |
| Day Percent Change: 2.03% Day Change: 1.29 | |
| Week Change: 2.03% Year-to-date Change: -63.2% | |
| IBKR Links: Profile News Message Board | |
| Charts:- Daily , Weekly | |
| Add IBKR to Watchlist: View: Get Complete IBKR Trend Analysis ➞ | |
 | FIHL Fidelis Insurance Holdings Limited |
| Sector: Financials | |
| SubSector: Insurance - Diversified | |
| MarketCap: 1590 Millions | |
| Recent Price: 15.15 Smart Investing & Trading Score: 32 | |
| Day Percent Change: 1.88% Day Change: 0.28 | |
| Week Change: 1.88% Year-to-date Change: -15.9% | |
| FIHL Links: Profile News Message Board | |
| Charts:- Daily , Weekly | |
| Add FIHL to Watchlist: View: Get Complete FIHL Trend Analysis ➞ | |
 | EQH Equitable Holdings, Inc. |
| Sector: Financials | |
| SubSector: Insurance Brokers | |
| MarketCap: 5520.07 Millions | |
| Recent Price: 50.99 Smart Investing & Trading Score: 32 | |
| Day Percent Change: 1.8% Day Change: 0.9 | |
| Week Change: 1.8% Year-to-date Change: 8.6% | |
| EQH Links: Profile News Message Board | |
| Charts:- Daily , Weekly | |
| Add EQH to Watchlist: View: Get Complete EQH Trend Analysis ➞ | |
| For tabular summary view of above stock list: Summary View ➞ 0 - 25 , 25 - 50 , 50 - 75 , 75 - 100 , 100 - 125 , 125 - 150 , 150 - 175 , 175 - 200 , 200 - 225 , 225 - 250 , 250 - 275 , 275 - 300 , 300 - 325 , 325 - 350 , 350 - 375 , 375 - 400 , 400 - 425 , 425 - 450 , 450 - 475 , 475 - 500 , 500 - 525 , 525 - 550 , 550 - 575 | ||
| Click To Change The Sort Order: By Market Cap or Company Size Performance: Year-to-date, Week and Day | |
| Select Chart Type: | ||
|
Best Stocks Today 12Stocks.com |
© 2025 12Stocks.com Terms & Conditions Privacy Contact Us
All Information Provided Only For Education And Not To Be Used For Investing or Trading. See Terms & Conditions


One More Thing ... Get Best Stocks Delivered Daily!
Never Ever Miss A Move With Our Top Ten Stocks Lists
Find Best Stocks In Any Market - Bull or Bear Market
Take A Peek At Our Top Ten Stocks Lists: Daily, Weekly, Year-to-Date & Top Trends
Find Best Stocks In Any Market - Bull or Bear Market
Take A Peek At Our Top Ten Stocks Lists: Daily, Weekly, Year-to-Date & Top Trends
Financial Stocks With Best Up Trends [0-bearish to 100-bullish]: Uniti [100], LendingTree [100], Mercury General[100], Perella Weinberg[100], Broadstone Net[100], LendingClub [100], TPG RE[100], CareTrust REIT[100], Stewart Information[100], Healthcare Realty[100], VICI Properties[100]
Best Financial Stocks Year-to-Date:
ESSA Bancorp[3207.77%], Easterly Government[108.45%], Mr. Cooper[86.58%], Heritage Insurance[75.29%], Root [65.29%], Industrial Logistics[64.89%], Rocket [58.42%], Diversified Healthcare[49.61%], ProAssurance [49.59%], Uniti [47.09%], SoFi Technologies[41.62%] Best Financial Stocks This Week:
Uniti [64.77%], Industrial Logistics[11.36%], LendingTree [7.32%], eXp World[7.27%], EverQuote [6.89%], Camping World[6.84%], First Foundation[6.69%], Diamond Hill[5.46%], Mercury General[5.36%], Cipher Mining[5.27%], AlTi Global[5.13%] Best Financial Stocks Daily:
Uniti [64.77%], Industrial Logistics[11.36%], LendingTree [7.32%], eXp World[7.27%], EverQuote [6.89%], Camping World[6.84%], First Foundation[6.69%], Diamond Hill[5.46%], Mercury General[5.36%], Cipher Mining[5.27%], AlTi Global[5.13%]