
 Login Sign Up


| |||||
 |  | ||||

| 12Stocks.com Market Intelligence |
Best Financial Stocks
| In a hurry? Financial Stocks Lists: Performance Trends Table, Stock Charts
Sort Financial stocks: Daily, Weekly, Year-to-Date, Market Cap & Trends. Filter Financial stocks list by size:All Financial Large Mid-Range Small & MicroCap |
| 12Stocks.com Financial Stocks Performances & Trends Daily | |||||||||
|
|  The overall Smart Investing & Trading Score is 90 (0-bearish to 100-bullish) which puts Financial sector in short term bullish trend. The Smart Investing & Trading Score from previous trading session is 60 and an improvement of trend continues.
| ||||||||
Here are the Smart Investing & Trading Scores of the most requested Financial stocks at 12Stocks.com (click stock name for detailed review):
|


| 12Stocks.com: Investing in Financial sector with Stocks | |
|
The following table helps investors and traders sort through current performance and trends (as measured by Smart Investing & Trading Score) of various
stocks in the Financial sector. Quick View: Move mouse or cursor over stock symbol (ticker) to view short-term Technical chart and over stock name to view long term chart. Click on  to add stock symbol to your watchlist and to add stock symbol to your watchlist and  to view watchlist. Click on any ticker or stock name for detailed market intelligence report for that stock. to view watchlist. Click on any ticker or stock name for detailed market intelligence report for that stock. |
12Stocks.com Performance of Stocks in Financial Sector
| Ticker | Stock Name | Watchlist | Category | Recent Price | Smart Investing & Trading Score | Change % | Weekly Change% |
| EVBS | Eastern Virginia |   | Regional Banks | 3.52 | 10 | -0.56% | -64.73% |
| BNCN | BNC Bancorp | | Regional Banks | 17.57 | 0 | 1.44% | -65.13% |
| CHSP | Chesapeake Lodging | | REIT | 35.00 | 30 | 1.04% | -65.97% |
| MRLN | Marlin Business | | Mortgage | 7.98 | 20 | 2.05% | -66.03% |
| Y | Alleghany | | Insurance | 282.86 | 30 | 1.00% | -66.64% |
| BNCL | Beneficial Bancorp | | Regional Banks | 1.74 | 10 | -0.57% | -67.42% |
| FNFV | Fidelity National | | Insurance | 12.51 | 0 | 0.89% | -68.82% |
| BRG | Bluerock Residential | | REIT | 8.11 | 0 | 1.00% | -69.51% |
| ICBK | County Bancorp | | S&L | 10.28 | 0 | -0.58% | -70.28% |
| KCG | KCG | | Brokerage | 8.11 | 0 | 0.00% | -70.54% |
| ACFC | Atlantic Coast | | Regional Banks | 7.54 | 30 | 1.48% | -71.44% |
| ENFC | Entegra | | Regional Banks | 8.85 | 40 | 1.14% | -71.48% |
| AWH | Allied World | | Insurance | 0.03 | 10 | -67.07% | -72.31% |
| OKSB | Southwest Bancorp | | Regional - Southwest Banks | 6.94 | 10 | 0.14% | -72.66% |
| SMMF | Summit | | Regional Banks | 7.05 | 30 | 7.80% | -73.25% |
| BSF | Bear State | | S&L | 1.69 | 0 | 1.81% | -74.24% |
| UCFC | United Community | | S&L | 13.34 | 0 | -0.74% | -75.07% |
| MCBC | Macatawa Bank | | Regional Banks | 3.46 | 0 | -3.62% | -76.86% |
| MEN | BlackRock MuniEnhanced | | Closed-End Fund - Debt | 2.44 | 0 | 2.09% | -79.80% |
| MORE | Monogram Residential | | REIT | 4.27 | 0 | 2.89% | -80.88% |
| FCFP | First Community | | Regional Banks | 14.56 | 0 | 3.70% | -81.56% |
| ABTX | Allegiance Bancshares | | Regional Banks | 7.06 | 30 | 2.32% | -83.04% |
| HPT | Hospitality Properties | | REIT - Retail | 8.48 | 0 | 0.00% | -84.18% |
| ISBC | Investors Bancorp | | S&L | 2.04 | 0 | -0.97% | -85.65% |
| AMNB | American National | | Regional Banks | 6.75 | 0 | -1.32% | -85.91% |
| For chart view version of above stock list: Chart View ➞ 0 - 25 , 25 - 50 , 50 - 75 , 75 - 100 , 100 - 125 , 125 - 150 , 150 - 175 , 175 - 200 , 200 - 225 , 225 - 250 , 250 - 275 , 275 - 300 , 300 - 325 , 325 - 350 , 350 - 375 , 375 - 400 , 400 - 425 , 425 - 450 , 450 - 475 , 475 - 500 , 500 - 525 , 525 - 550 , 550 - 575 , 575 - 600 , 600 - 625 , 625 - 650 , 650 - 675 , 675 - 700 , 700 - 725 , 725 - 750 , 750 - 775 , 775 - 800 , 800 - 825 , 825 - 850 , 850 - 875 , 875 - 900 , 900 - 925 , 925 - 950 , 950 - 975 , 975 - 1000 , 1000 - 1025 , 1025 - 1050 , 1050 - 1075 , 1075 - 1100 , 1100 - 1125 , 1125 - 1150 , 1150 - 1175 , 1175 - 1200 , 1200 - 1225 , 1225 - 1250 , 1250 - 1275 , 1275 - 1300 , 1300 - 1325 , 1325 - 1350 , 1350 - 1375 , 1375 - 1400 , 1400 - 1425 , 1425 - 1450 , 1450 - 1475 , 1475 - 1500 , 1500 - 1525 , 1525 - 1550 | ||
 | Click To Change The Sort Order: By Market Cap or Company Size Performance: Year-to-date, Week and Day |  |
|
Get the most comprehensive stock market coverage daily at 12Stocks.com ➞ Best Stocks Today ➞ Best Stocks Weekly ➞ Best Stocks Year-to-Date ➞ Best Stocks Trends ➞  Best Stocks Today 12Stocks.com Best Nasdaq Stocks ➞ Best S&P 500 Stocks ➞ Best Tech Stocks ➞ Best Biotech Stocks ➞ |
| Detailed Overview of Financial Stocks |
| Financial Technical Overview, Leaders & Laggards, Top Financial ETF Funds & Detailed Financial Stocks List, Charts, Trends & More |
| Financial Sector: Technical Analysis, Trends & YTD Performance | |
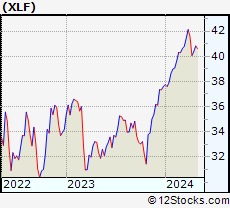
| Financial sector is composed of stocks
from banks, brokers, insurance, REITs
and services subsectors. Financial sector, as represented by XLF, an exchange-traded fund [ETF] that holds basket of Financial stocks (e.g, Bank of America, Goldman Sachs) is up by 13.1362% and is currently underperforming the overall market by -0.884% year-to-date. Below is a quick view of Technical charts and trends: |
|
 XLF Weekly Chart |
|
| Long Term Trend: Good | |
| Medium Term Trend: Good | |
 XLF Daily Chart |
|
| Short Term Trend: Very Good | |
| Overall Trend Score: 90 | |
| YTD Performance: 13.1362% | |
| **Trend Scores & Views Are Only For Educational Purposes And Not For Investing | |
| 12Stocks.com: Top Performing Financial Sector Stocks | |||||||||||||||||||||||||||||||||||||||||||||||
 The top performing Financial sector stocks year to date are
Now, more recently, over last week, the top performing Financial sector stocks on the move are


|
|||||||||||||||||||||||||||||||||||||||||||||||
| 12Stocks.com: Investing in Financial Sector using Exchange Traded Funds | |
|
The following table shows list of key exchange traded funds (ETF) that
help investors track Financial Index. For detailed view, check out our ETF Funds section of our website. Quick View: Move mouse or cursor over ETF symbol (ticker) to view short-term Technical chart and over ETF name to view long term chart. Click on ticker or stock name for detailed view. Click on to add stock symbol to your watchlist and to view watchlist. |
12Stocks.com List of ETFs that track Financial Index
| Ticker | ETF Name | Watchlist | Recent Price | Smart Investing & Trading Score | Change % | Week % | Year-to-date % |
| CHIX | China Financials | | 10.57 | 20 | 0 | 0 | 0% |
| 12Stocks.com: Charts, Trends, Fundamental Data and Performances of Financial Stocks | |
|
We now take in-depth look at all Financial stocks including charts, multi-period performances and overall trends (as measured by Smart Investing & Trading Score). One can sort Financial stocks (click link to choose) by Daily, Weekly and by Year-to-Date performances. Also, one can sort by size of the company or by market capitalization. |
| Select Your Default Chart Type: | |||||
| |||||
| Click on stock symbol or name for detailed view. Click on to add stock symbol to your watchlist and to view watchlist. Quick View: Move mouse or cursor over "Daily" to quickly view daily Technical stock chart and over "Weekly" to view weekly Technical stock chart. | |||||

 | EVBS Eastern Virginia Bankshares, Inc. |
| Sector: Financials | |
| SubSector: Regional - Southeast Banks | |
| MarketCap: 141.64 Millions | |
| Recent Price: 3.52 Smart Investing & Trading Score: 10 | |
| Day Percent Change: -0.564972% Day Change: -9999 | |
| Week Change: -64.7295% Year-to-date Change: 0.0% | |
| EVBS Links: Profile News Message Board | |
| Charts:- Daily , Weekly | |
| Add EVBS to Watchlist: View: Get Complete EVBS Trend Analysis ➞ | |
 | BNCN BNC Bancorp |
| Sector: Financials | |
| SubSector: Regional - Mid-Atlantic Banks | |
| MarketCap: 1840.1 Millions | |
| Recent Price: 17.57 Smart Investing & Trading Score: 0 | |
| Day Percent Change: 1.44342% Day Change: -9999 | |
| Week Change: -65.1251% Year-to-date Change: 0.0% | |
| BNCN Links: Profile News Message Board | |
| Charts:- Daily , Weekly | |
| Add BNCN to Watchlist: View: Get Complete BNCN Trend Analysis ➞ | |
 | CHSP Chesapeake Lodging Trust |
| Sector: Financials | |
| SubSector: REIT - Hotel/Motel | |
| MarketCap: 1430.96 Millions | |
| Recent Price: 35.00 Smart Investing & Trading Score: 30 | |
| Day Percent Change: 1.03926% Day Change: -9999 | |
| Week Change: -65.9732% Year-to-date Change: 0.0% | |
| CHSP Links: Profile News Message Board | |
| Charts:- Daily , Weekly | |
| Add CHSP to Watchlist: View: Get Complete CHSP Trend Analysis ➞ | |
 | MRLN Marlin Business Services Corp. |
| Sector: Financials | |
| SubSector: Mortgage Investment | |
| MarketCap: 107.739 Millions | |
| Recent Price: 7.98 Smart Investing & Trading Score: 20 | |
| Day Percent Change: 2.04604% Day Change: -9999 | |
| Week Change: -66.0281% Year-to-date Change: 0.0% | |
| MRLN Links: Profile News Message Board | |
| Charts:- Daily , Weekly | |
| Add MRLN to Watchlist: View: Get Complete MRLN Trend Analysis ➞ | |
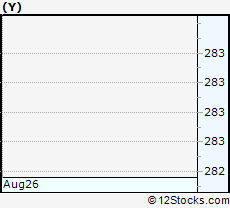 | Y Alleghany Corporation |
| Sector: Financials | |
| SubSector: Property & Casualty Insurance | |
| MarketCap: 7431.92 Millions | |
| Recent Price: 282.86 Smart Investing & Trading Score: 30 | |
| Day Percent Change: 1.00339% Day Change: -9999 | |
| Week Change: -66.6356% Year-to-date Change: 0.0% | |
| Y Links: Profile News Message Board | |
| Charts:- Daily , Weekly | |
| Add Y to Watchlist: View: Get Complete Y Trend Analysis ➞ | |
 | BNCL Beneficial Bancorp, Inc. |
| Sector: Financials | |
| SubSector: Regional - Northeast Banks | |
| MarketCap: 1249.72 Millions | |
| Recent Price: 1.74 Smart Investing & Trading Score: 10 | |
| Day Percent Change: -0.571429% Day Change: -9999 | |
| Week Change: -67.4157% Year-to-date Change: 0.0% | |
| BNCL Links: Profile News Message Board | |
| Charts:- Daily , Weekly | |
| Add BNCL to Watchlist: View: Get Complete BNCL Trend Analysis ➞ | |
 | FNFV Fidelity National Financial Ventures |
| Sector: Financials | |
| SubSector: Property & Casualty Insurance | |
| MarketCap: 783.72 Millions | |
| Recent Price: 12.51 Smart Investing & Trading Score: 0 | |
| Day Percent Change: 0.887097% Day Change: -9999 | |
| Week Change: -68.8185% Year-to-date Change: 0.0% | |
| FNFV Links: Profile News Message Board | |
| Charts:- Daily , Weekly | |
| Add FNFV to Watchlist: View: Get Complete FNFV Trend Analysis ➞ | |
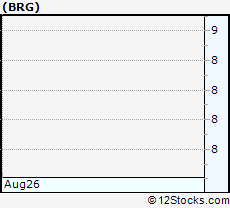 | BRG Bluerock Residential Growth REIT, Inc. |
| Sector: Financials | |
| SubSector: REIT - Residential | |
| MarketCap: 183.961 Millions | |
| Recent Price: 8.11 Smart Investing & Trading Score: 0 | |
| Day Percent Change: 0.996264% Day Change: -9999 | |
| Week Change: -69.5113% Year-to-date Change: 0.0% | |
| BRG Links: Profile News Message Board | |
| Charts:- Daily , Weekly | |
| Add BRG to Watchlist: View: Get Complete BRG Trend Analysis ➞ | |
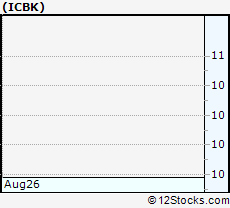 | ICBK County Bancorp, Inc. |
| Sector: Financials | |
| SubSector: Savings & Loans | |
| MarketCap: 120.83 Millions | |
| Recent Price: 10.28 Smart Investing & Trading Score: 0 | |
| Day Percent Change: -0.580271% Day Change: -9999 | |
| Week Change: -70.2804% Year-to-date Change: 0.0% | |
| ICBK Links: Profile News Message Board | |
| Charts:- Daily , Weekly | |
| Add ICBK to Watchlist: View: Get Complete ICBK Trend Analysis ➞ | |
 | KCG KCG Holdings, Inc. |
| Sector: Financials | |
| SubSector: Investment Brokerage - National | |
| MarketCap: 1121.31 Millions | |
| Recent Price: 8.11 Smart Investing & Trading Score: 0 | |
| Day Percent Change: 0% Day Change: -9999 | |
| Week Change: -70.5412% Year-to-date Change: 0.0% | |
| KCG Links: Profile News Message Board | |
| Charts:- Daily , Weekly | |
| Add KCG to Watchlist: View: Get Complete KCG Trend Analysis ➞ | |
 | ACFC Atlantic Coast Financial Corporation |
| Sector: Financials | |
| SubSector: Regional - Southeast Banks | |
| MarketCap: 119.04 Millions | |
| Recent Price: 7.54 Smart Investing & Trading Score: 30 | |
| Day Percent Change: 1.48048% Day Change: -9999 | |
| Week Change: -71.4394% Year-to-date Change: 0.0% | |
| ACFC Links: Profile News Message Board | |
| Charts:- Daily , Weekly | |
| Add ACFC to Watchlist: View: Get Complete ACFC Trend Analysis ➞ | |
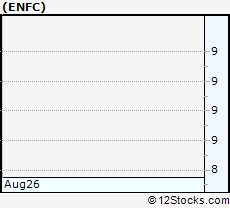 | ENFC Entegra Financial Corp. |
| Sector: Financials | |
| SubSector: Regional - Southeast Banks | |
| MarketCap: 148.81 Millions | |
| Recent Price: 8.85 Smart Investing & Trading Score: 40 | |
| Day Percent Change: 1.14286% Day Change: -9999 | |
| Week Change: -71.4792% Year-to-date Change: 0.0% | |
| ENFC Links: Profile News Message Board | |
| Charts:- Daily , Weekly | |
| Add ENFC to Watchlist: View: Get Complete ENFC Trend Analysis ➞ | |
 | AWH Allied World Assurance Company Holdings, AG |
| Sector: Financials | |
| SubSector: Property & Casualty Insurance | |
| MarketCap: 4663.47 Millions | |
| Recent Price: 0.03 Smart Investing & Trading Score: 10 | |
| Day Percent Change: -67.0732% Day Change: -9999 | |
| Week Change: -72.3077% Year-to-date Change: -96.2% | |
| AWH Links: Profile News Message Board | |
| Charts:- Daily , Weekly | |
| Add AWH to Watchlist: View: Get Complete AWH Trend Analysis ➞ | |
 | OKSB Southwest Bancorp, Inc. |
| Sector: Financials | |
| SubSector: Regional - Southwest Banks | |
| MarketCap: 497.81 Millions | |
| Recent Price: 6.94 Smart Investing & Trading Score: 10 | |
| Day Percent Change: 0.1443% Day Change: -9999 | |
| Week Change: -72.6556% Year-to-date Change: 0.0% | |
| OKSB Links: Profile News Message Board | |
| Charts:- Daily , Weekly | |
| Add OKSB to Watchlist: View: Get Complete OKSB Trend Analysis ➞ | |
 | SMMF Summit Financial Group, Inc. |
| Sector: Financials | |
| SubSector: Regional - Mid-Atlantic Banks | |
| MarketCap: 228.959 Millions | |
| Recent Price: 7.05 Smart Investing & Trading Score: 30 | |
| Day Percent Change: 7.79817% Day Change: -9999 | |
| Week Change: -73.2549% Year-to-date Change: 0.0% | |
| SMMF Links: Profile News Message Board | |
| Charts:- Daily , Weekly | |
| Add SMMF to Watchlist: View: Get Complete SMMF Trend Analysis ➞ | |
 | BSF Bear State Financial, Inc. |
| Sector: Financials | |
| SubSector: Savings & Loans | |
| MarketCap: 361.48 Millions | |
| Recent Price: 1.69 Smart Investing & Trading Score: 0 | |
| Day Percent Change: 1.80723% Day Change: -9999 | |
| Week Change: -74.2378% Year-to-date Change: 0.0% | |
| BSF Links: Profile News Message Board | |
| Charts:- Daily , Weekly | |
| Add BSF to Watchlist: View: Get Complete BSF Trend Analysis ➞ | |
 | UCFC United Community Financial Corp. |
| Sector: Financials | |
| SubSector: Savings & Loans | |
| MarketCap: 397.8 Millions | |
| Recent Price: 13.34 Smart Investing & Trading Score: 0 | |
| Day Percent Change: -0.744048% Day Change: -9999 | |
| Week Change: -75.0654% Year-to-date Change: 0.0% | |
| UCFC Links: Profile News Message Board | |
| Charts:- Daily , Weekly | |
| Add UCFC to Watchlist: View: Get Complete UCFC Trend Analysis ➞ | |
 | MCBC Macatawa Bank Corporation |
| Sector: Financials | |
| SubSector: Regional - Midwest Banks | |
| MarketCap: 264.37 Millions | |
| Recent Price: 3.46 Smart Investing & Trading Score: 0 | |
| Day Percent Change: -3.62117% Day Change: -9999 | |
| Week Change: -76.8562% Year-to-date Change: 0.0% | |
| MCBC Links: Profile News Message Board | |
| Charts:- Daily , Weekly | |
| Add MCBC to Watchlist: View: Get Complete MCBC Trend Analysis ➞ | |
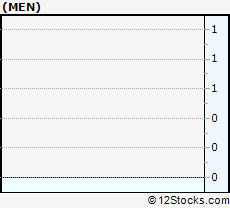 | MEN BlackRock MuniEnhanced Fund, Inc. |
| Sector: Financials | |
| SubSector: Closed-End Fund - Debt | |
| MarketCap: 270.407 Millions | |
| Recent Price: 2.44 Smart Investing & Trading Score: 0 | |
| Day Percent Change: 2.09205% Day Change: -9999 | |
| Week Change: -79.8013% Year-to-date Change: 0.0% | |
| MEN Links: Profile News Message Board | |
| Charts:- Daily , Weekly | |
| Add MEN to Watchlist: View: Get Complete MEN Trend Analysis ➞ | |
 | MORE Monogram Residential Trust, Inc. |
| Sector: Financials | |
| SubSector: REIT - Residential | |
| MarketCap: 1698.96 Millions | |
| Recent Price: 4.27 Smart Investing & Trading Score: 0 | |
| Day Percent Change: 2.89157% Day Change: -9999 | |
| Week Change: -80.8819% Year-to-date Change: 0.0% | |
| MORE Links: Profile News Message Board | |
| Charts:- Daily , Weekly | |
| Add MORE to Watchlist: View: Get Complete MORE Trend Analysis ➞ | |
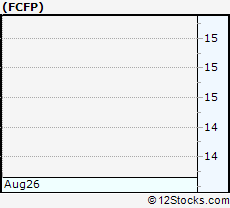 | FCFP First Community Financial Partners, Inc. |
| Sector: Financials | |
| SubSector: Regional - Midwest Banks | |
| MarketCap: 229.94 Millions | |
| Recent Price: 14.56 Smart Investing & Trading Score: 0 | |
| Day Percent Change: 3.7037% Day Change: -9999 | |
| Week Change: -81.5579% Year-to-date Change: 0.0% | |
| FCFP Links: Profile News Message Board | |
| Charts:- Daily , Weekly | |
| Add FCFP to Watchlist: View: Get Complete FCFP Trend Analysis ➞ | |
 | ABTX Allegiance Bancshares, Inc. |
| Sector: Financials | |
| SubSector: Regional - Southwest Banks | |
| MarketCap: 544.865 Millions | |
| Recent Price: 7.06 Smart Investing & Trading Score: 30 | |
| Day Percent Change: 2.31884% Day Change: -9999 | |
| Week Change: -83.0411% Year-to-date Change: 0.0% | |
| ABTX Links: Profile News Message Board | |
| Charts:- Daily , Weekly | |
| Add ABTX to Watchlist: View: Get Complete ABTX Trend Analysis ➞ | |
 | HPT Hospitality Properties Trust |
| Sector: Financials | |
| SubSector: REIT - Retail | |
| MarketCap: 5078.82 Millions | |
| Recent Price: 8.48 Smart Investing & Trading Score: 0 | |
| Day Percent Change: 0% Day Change: -9999 | |
| Week Change: -84.1762% Year-to-date Change: 0.0% | |
| HPT Links: Profile News Message Board | |
| Charts:- Daily , Weekly | |
| Add HPT to Watchlist: View: Get Complete HPT Trend Analysis ➞ | |
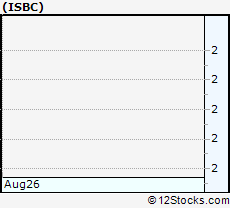 | ISBC Investors Bancorp, Inc. |
| Sector: Financials | |
| SubSector: Savings & Loans | |
| MarketCap: 2182.3 Millions | |
| Recent Price: 2.04 Smart Investing & Trading Score: 0 | |
| Day Percent Change: -0.970874% Day Change: -9999 | |
| Week Change: -85.654% Year-to-date Change: 0.0% | |
| ISBC Links: Profile News Message Board | |
| Charts:- Daily , Weekly | |
| Add ISBC to Watchlist: View: Get Complete ISBC Trend Analysis ➞ | |
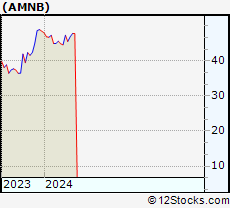 | AMNB American National Bankshares Inc. |
| Sector: Financials | |
| SubSector: Regional - Mid-Atlantic Banks | |
| MarketCap: 274.459 Millions | |
| Recent Price: 6.75 Smart Investing & Trading Score: 0 | |
| Day Percent Change: -1.31579% Day Change: -9999 | |
| Week Change: -85.914% Year-to-date Change: 0.0% | |
| AMNB Links: Profile News Message Board | |
| Charts:- Daily , Weekly | |
| Add AMNB to Watchlist: View: Get Complete AMNB Trend Analysis ➞ | |
| For tabular summary view of above stock list: Summary View ➞ 0 - 25 , 25 - 50 , 50 - 75 , 75 - 100 , 100 - 125 , 125 - 150 , 150 - 175 , 175 - 200 , 200 - 225 , 225 - 250 , 250 - 275 , 275 - 300 , 300 - 325 , 325 - 350 , 350 - 375 , 375 - 400 , 400 - 425 , 425 - 450 , 450 - 475 , 475 - 500 , 500 - 525 , 525 - 550 , 550 - 575 , 575 - 600 , 600 - 625 , 625 - 650 , 650 - 675 , 675 - 700 , 700 - 725 , 725 - 750 , 750 - 775 , 775 - 800 , 800 - 825 , 825 - 850 , 850 - 875 , 875 - 900 , 900 - 925 , 925 - 950 , 950 - 975 , 975 - 1000 , 1000 - 1025 , 1025 - 1050 , 1050 - 1075 , 1075 - 1100 , 1100 - 1125 , 1125 - 1150 , 1150 - 1175 , 1175 - 1200 , 1200 - 1225 , 1225 - 1250 , 1250 - 1275 , 1275 - 1300 , 1300 - 1325 , 1325 - 1350 , 1350 - 1375 , 1375 - 1400 , 1400 - 1425 , 1425 - 1450 , 1450 - 1475 , 1475 - 1500 , 1500 - 1525 , 1525 - 1550 | ||
| Click To Change The Sort Order: By Market Cap or Company Size Performance: Year-to-date, Week and Day | |
| Select Chart Type: | ||
|
Best Stocks Today 12Stocks.com |
© 2025 12Stocks.com Terms & Conditions Privacy Contact Us
All Information Provided Only For Education And Not To Be Used For Investing or Trading. See Terms & Conditions


One More Thing ... Get Best Stocks Delivered Daily!
Never Ever Miss A Move With Our Top Ten Stocks Lists
Find Best Stocks In Any Market - Bull or Bear Market
Take A Peek At Our Top Ten Stocks Lists: Daily, Weekly, Year-to-Date & Top Trends
Find Best Stocks In Any Market - Bull or Bear Market
Take A Peek At Our Top Ten Stocks Lists: Daily, Weekly, Year-to-Date & Top Trends
Financial Stocks With Best Up Trends [0-bearish to 100-bullish]: PIMCO California[100], Torchmark [100], B. Riley[100], PIMCO California[100], Better Home[100], Triumph Bancorp[100], Cipher Mining[100], PIMCO Municipal[100], PIMCO Municipal[100], SuRo Capital[100], Jefferies [100]
Best Financial Stocks Year-to-Date:
Insight Select[12384.6%], Oxford Lane[292.029%], Better Home[209.081%], Robinhood Markets[200.811%], Metalpha Technology[196.46%], Cipher Mining[156.315%], Mr. Cooper[135%], LoanDepot [133.846%], Banco Santander[129.354%], IHS Holding[117.61%], Deutsche Bank[114.955%] Best Financial Stocks This Week:
Colony Starwood[15929900%], Blackhawk Network[91300%], Macquarie Global[81662.9%], Credit Suisse[63241.6%], Pennsylvania Real[23823%], First Republic[22570.9%], Select ome[14000%], CorEnergy Infrastructure[6797.78%], FedNat Holding[5525%], BlackRock Municipal[5340%], BlackRock MuniYield[3379.04%] Best Financial Stocks Daily:
Offerpad [12.3487%], PIMCO California[11.9545%], Torchmark [11.8363%], B. Riley[11.5556%], PIMCO California[11.4754%], BlackRock Muni[10.8108%], Blackrock MuniYield[10.72%], Better Home[10.5675%], Triumph Bancorp[10.2661%], Coinbase Global[8.50387%], BlackRock MuniYield[8.15348%]