
 Login Sign Up


| |||||
 |  | ||||

| 12Stocks.com Market Intelligence |
Best Financial Stocks
| In a hurry? Financial Stocks Lists: Performance Trends Table, Stock Charts
Sort Financial stocks: Daily, Weekly, Year-to-Date, Market Cap & Trends. Filter Financial stocks list by size:All Financial Large Mid-Range Small & MicroCap |
| 12Stocks.com Financial Stocks Performances & Trends Daily | |||||||||
|
|  The overall Smart Investing & Trading Score is 90 (0-bearish to 100-bullish) which puts Financial sector in short term bullish trend. The Smart Investing & Trading Score from previous trading session is 60 and an improvement of trend continues.
| ||||||||
Here are the Smart Investing & Trading Scores of the most requested Financial stocks at 12Stocks.com (click stock name for detailed review):
|


| 12Stocks.com: Investing in Financial sector with Stocks | |
|
The following table helps investors and traders sort through current performance and trends (as measured by Smart Investing & Trading Score) of various
stocks in the Financial sector. Quick View: Move mouse or cursor over stock symbol (ticker) to view short-term Technical chart and over stock name to view long term chart. Click on  to add stock symbol to your watchlist and to add stock symbol to your watchlist and  to view watchlist. Click on any ticker or stock name for detailed market intelligence report for that stock. to view watchlist. Click on any ticker or stock name for detailed market intelligence report for that stock. |
12Stocks.com Performance of Stocks in Financial Sector
| Ticker | Stock Name | Watchlist | Category | Recent Price | Smart Investing & Trading Score | Change % | Weekly Change% |
| LAQ | Aberdeen Latin |   | Asset Mgmt | 4.69 | 40 | 0.21% | -45.53% |
| CARO | Carolina | | Regional Banks | 47.23 | 0 | 1.46% | -46.15% |
| FFKT | Farmers Capital | | Regional Banks | 37.00 | 0 | 0.08% | -47.14% |
| LHO | LaSalle Hotel | | REIT | 14.06 | 30 | 0.50% | -47.96% |
| STL | Sterling Bancorp | | Banks | 14.06 | 30 | 0.50% | -48.25% |
| MBVT | Merchants Bancshares | | Regional Banks | 2.44 | 10 | 0.41% | -48.31% |
| NCBS | Nicolet Bankshares | | Banks | 40.15 | 10 | 0.40% | -48.68% |
| CUNB | CU Bancorp | | Regional Banks | 3.23 | 30 | 2.87% | -49.29% |
| PMBC | Pacific Mercantile | | Regional Banks | 4.69 | 30 | 0.21% | -50.11% |
| OAK | Oaktree Capital | | Asset Mgmt | 3.29 | 30 | 1.23% | -50.30% |
| STOR | STORE Capital | | REIT - | 15.81 | 0 | -0.38% | -50.92% |
| ASBB | ASB Bancorp | | Regional Banks | 7.01 | 10 | 0.14% | -51.05% |
| CVLY | Codorus Valley | | Regional Banks | 10.79 | 10 | -0.46% | -52.88% |
| BBF | BlackRock Municipal | | Closed-End Fund - Debt | 6.78 | 20 | 1.80% | -52.98% |
| CIIC | CIIG Merger | | SPAC | 9.81 | 20 | 0.10% | -54.58% |
| WFBI | WashingtonFirst Bankshares | | Regional Banks | 1.52 | 10 | -0.65% | -55.43% |
| ZBK | Zions Ban | | Regional Banks | 16.07 | 10 | 1.26% | -55.48% |
| CURO | CURO | | Credit Services | 0.06 | 20 | -14.14% | -56.13% |
| BMTC | Bryn Mawr | | Regional Banks | 20.01 | 30 | 5.09% | -56.40% |
| FSIC | FS | | Investments | 10.27 | 0 | -0.39% | -56.94% |
| PCBK | Pacific Continental | | Regional Banks | 2.00 | 10 | 0.00% | -57.63% |
| ABDC | Alcentra Capital | | Asset Mgmt | 2.64 | 20 | -4.00% | -57.76% |
| ACSF | American Capital | | Asset Mgmt | 5.75 | 10 | 0.35% | -57.88% |
| SLCT | Select Bancorp | | Regional Banks | 7.01 | 10 | 0.14% | -62.87% |
| NUM | Nuveen Michigan | | Asset Mgmt | 60.69 | 10 | -0.93% | -63.16% |
| For chart view version of above stock list: Chart View ➞ 0 - 25 , 25 - 50 , 50 - 75 , 75 - 100 , 100 - 125 , 125 - 150 , 150 - 175 , 175 - 200 , 200 - 225 , 225 - 250 , 250 - 275 , 275 - 300 , 300 - 325 , 325 - 350 , 350 - 375 , 375 - 400 , 400 - 425 , 425 - 450 , 450 - 475 , 475 - 500 , 500 - 525 , 525 - 550 , 550 - 575 , 575 - 600 , 600 - 625 , 625 - 650 , 650 - 675 , 675 - 700 , 700 - 725 , 725 - 750 , 750 - 775 , 775 - 800 , 800 - 825 , 825 - 850 , 850 - 875 , 875 - 900 , 900 - 925 , 925 - 950 , 950 - 975 , 975 - 1000 , 1000 - 1025 , 1025 - 1050 , 1050 - 1075 , 1075 - 1100 , 1100 - 1125 , 1125 - 1150 , 1150 - 1175 , 1175 - 1200 , 1200 - 1225 , 1225 - 1250 , 1250 - 1275 , 1275 - 1300 , 1300 - 1325 , 1325 - 1350 , 1350 - 1375 , 1375 - 1400 , 1400 - 1425 , 1425 - 1450 , 1450 - 1475 , 1475 - 1500 , 1500 - 1525 , 1525 - 1550 | ||
 | Click To Change The Sort Order: By Market Cap or Company Size Performance: Year-to-date, Week and Day |  |
|
Get the most comprehensive stock market coverage daily at 12Stocks.com ➞ Best Stocks Today ➞ Best Stocks Weekly ➞ Best Stocks Year-to-Date ➞ Best Stocks Trends ➞  Best Stocks Today 12Stocks.com Best Nasdaq Stocks ➞ Best S&P 500 Stocks ➞ Best Tech Stocks ➞ Best Biotech Stocks ➞ |
| Detailed Overview of Financial Stocks |
| Financial Technical Overview, Leaders & Laggards, Top Financial ETF Funds & Detailed Financial Stocks List, Charts, Trends & More |
| Financial Sector: Technical Analysis, Trends & YTD Performance | |
| Financial sector is composed of stocks
from banks, brokers, insurance, REITs
and services subsectors. Financial sector, as represented by XLF, an exchange-traded fund [ETF] that holds basket of Financial stocks (e.g, Bank of America, Goldman Sachs) is up by 13.1362% and is currently underperforming the overall market by -0.884% year-to-date. Below is a quick view of Technical charts and trends: |
|
 XLF Weekly Chart |
|
| Long Term Trend: Good | |
| Medium Term Trend: Good | |
 XLF Daily Chart |
|
| Short Term Trend: Very Good | |
| Overall Trend Score: 90 | |
| YTD Performance: 13.1362% | |
| **Trend Scores & Views Are Only For Educational Purposes And Not For Investing | |
| 12Stocks.com: Top Performing Financial Sector Stocks | |||||||||||||||||||||||||||||||||||||||||||||||
 The top performing Financial sector stocks year to date are
Now, more recently, over last week, the top performing Financial sector stocks on the move are


|
|||||||||||||||||||||||||||||||||||||||||||||||
| 12Stocks.com: Investing in Financial Sector using Exchange Traded Funds | |
|
The following table shows list of key exchange traded funds (ETF) that
help investors track Financial Index. For detailed view, check out our ETF Funds section of our website. Quick View: Move mouse or cursor over ETF symbol (ticker) to view short-term Technical chart and over ETF name to view long term chart. Click on ticker or stock name for detailed view. Click on to add stock symbol to your watchlist and to view watchlist. |
12Stocks.com List of ETFs that track Financial Index
| Ticker | ETF Name | Watchlist | Recent Price | Smart Investing & Trading Score | Change % | Week % | Year-to-date % |
| CHIX | China Financials | | 10.57 | 20 | 0 | 0 | 0% |
| 12Stocks.com: Charts, Trends, Fundamental Data and Performances of Financial Stocks | |
|
We now take in-depth look at all Financial stocks including charts, multi-period performances and overall trends (as measured by Smart Investing & Trading Score). One can sort Financial stocks (click link to choose) by Daily, Weekly and by Year-to-Date performances. Also, one can sort by size of the company or by market capitalization. |
| Select Your Default Chart Type: | |||||
| |||||
| Click on stock symbol or name for detailed view. Click on to add stock symbol to your watchlist and to view watchlist. Quick View: Move mouse or cursor over "Daily" to quickly view daily Technical stock chart and over "Weekly" to view weekly Technical stock chart. | |||||

 | LAQ Aberdeen Latin America Equity Fund, Inc. |
| Sector: Financials | |
| SubSector: Asset Management | |
| MarketCap: 167.89 Millions | |
| Recent Price: 4.69 Smart Investing & Trading Score: 40 | |
| Day Percent Change: 0.213675% Day Change: -9999 | |
| Week Change: -45.5285% Year-to-date Change: 0.0% | |
| LAQ Links: Profile News Message Board | |
| Charts:- Daily , Weekly | |
| Add LAQ to Watchlist: View: Get Complete LAQ Trend Analysis ➞ | |
 | CARO Carolina Financial Corporation |
| Sector: Financials | |
| SubSector: Regional - Mid-Atlantic Banks | |
| MarketCap: 661.359 Millions | |
| Recent Price: 47.23 Smart Investing & Trading Score: 0 | |
| Day Percent Change: 1.46079% Day Change: -9999 | |
| Week Change: -46.146% Year-to-date Change: 0.0% | |
| CARO Links: Profile News Message Board | |
| Charts:- Daily , Weekly | |
| Add CARO to Watchlist: View: Get Complete CARO Trend Analysis ➞ | |
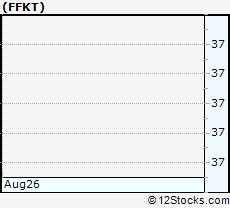 | FFKT Farmers Capital Bank Corporation |
| Sector: Financials | |
| SubSector: Regional - Southeast Banks | |
| MarketCap: 287.66 Millions | |
| Recent Price: 37.00 Smart Investing & Trading Score: 0 | |
| Day Percent Change: 0.0811469% Day Change: -9999 | |
| Week Change: -47.1429% Year-to-date Change: 0.0% | |
| FFKT Links: Profile News Message Board | |
| Charts:- Daily , Weekly | |
| Add FFKT to Watchlist: View: Get Complete FFKT Trend Analysis ➞ | |
 | LHO LaSalle Hotel Properties |
| Sector: Financials | |
| SubSector: REIT - Hotel/Motel | |
| MarketCap: 3287.63 Millions | |
| Recent Price: 14.06 Smart Investing & Trading Score: 30 | |
| Day Percent Change: 0.500357% Day Change: -9999 | |
| Week Change: -47.9645% Year-to-date Change: 0.0% | |
| LHO Links: Profile News Message Board | |
| Charts:- Daily , Weekly | |
| Add LHO to Watchlist: View: Get Complete LHO Trend Analysis ➞ | |
 | STL Sterling Bancorp |
| Sector: Financials | |
| SubSector: Money Center Banks | |
| MarketCap: 1932.09 Millions | |
| Recent Price: 14.06 Smart Investing & Trading Score: 30 | |
| Day Percent Change: 0.500357% Day Change: -9999 | |
| Week Change: -48.2517% Year-to-date Change: 0.0% | |
| STL Links: Profile News Message Board | |
| Charts:- Daily , Weekly | |
| Add STL to Watchlist: View: Get Complete STL Trend Analysis ➞ | |
 | MBVT Merchants Bancshares, Inc. |
| Sector: Financials | |
| SubSector: Regional - Northeast Banks | |
| MarketCap: 345.5 Millions | |
| Recent Price: 2.44 Smart Investing & Trading Score: 10 | |
| Day Percent Change: 0.411523% Day Change: -9999 | |
| Week Change: -48.3051% Year-to-date Change: 0.0% | |
| MBVT Links: Profile News Message Board | |
| Charts:- Daily , Weekly | |
| Add MBVT to Watchlist: View: Get Complete MBVT Trend Analysis ➞ | |
 | NCBS Nicolet Bankshares, Inc. |
| Sector: Financials | |
| SubSector: Money Center Banks | |
| MarketCap: 624.299 Millions | |
| Recent Price: 40.15 Smart Investing & Trading Score: 10 | |
| Day Percent Change: 0.4001% Day Change: -9999 | |
| Week Change: -48.6835% Year-to-date Change: 0.0% | |
| NCBS Links: Profile News Message Board | |
| Charts:- Daily , Weekly | |
| Add NCBS to Watchlist: View: Get Complete NCBS Trend Analysis ➞ | |
 | CUNB CU Bancorp |
| Sector: Financials | |
| SubSector: Regional - Pacific Banks | |
| MarketCap: 693.44 Millions | |
| Recent Price: 3.23 Smart Investing & Trading Score: 30 | |
| Day Percent Change: 2.86624% Day Change: -9999 | |
| Week Change: -49.2936% Year-to-date Change: 0.0% | |
| CUNB Links: Profile News Message Board | |
| Charts:- Daily , Weekly | |
| Add CUNB to Watchlist: View: Get Complete CUNB Trend Analysis ➞ | |
 | PMBC Pacific Mercantile Bancorp |
| Sector: Financials | |
| SubSector: Regional - Pacific Banks | |
| MarketCap: 103.329 Millions | |
| Recent Price: 4.69 Smart Investing & Trading Score: 30 | |
| Day Percent Change: 0.213675% Day Change: -9999 | |
| Week Change: -50.1064% Year-to-date Change: 0.0% | |
| PMBC Links: Profile News Message Board | |
| Charts:- Daily , Weekly | |
| Add PMBC to Watchlist: View: Get Complete PMBC Trend Analysis ➞ | |
 | OAK Oaktree Capital Group, LLC |
| Sector: Financials | |
| SubSector: Asset Management | |
| MarketCap: 6915.5 Millions | |
| Recent Price: 3.29 Smart Investing & Trading Score: 30 | |
| Day Percent Change: 1.23077% Day Change: -9999 | |
| Week Change: -50.3021% Year-to-date Change: 0.0% | |
| OAK Links: Profile News Message Board | |
| Charts:- Daily , Weekly | |
| Add OAK to Watchlist: View: Get Complete OAK Trend Analysis ➞ | |
 | STOR STORE Capital Corporation |
| Sector: Financials | |
| SubSector: REIT - Diversified | |
| MarketCap: 4760.23 Millions | |
| Recent Price: 15.81 Smart Investing & Trading Score: 0 | |
| Day Percent Change: -0.378072% Day Change: -9999 | |
| Week Change: -50.9159% Year-to-date Change: 0.0% | |
| STOR Links: Profile News Message Board | |
| Charts:- Daily , Weekly | |
| Add STOR to Watchlist: View: Get Complete STOR Trend Analysis ➞ | |
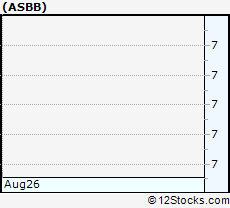 | ASBB ASB Bancorp, Inc. |
| Sector: Financials | |
| SubSector: Regional - Mid-Atlantic Banks | |
| MarketCap: 127.34 Millions | |
| Recent Price: 7.01 Smart Investing & Trading Score: 10 | |
| Day Percent Change: 0.142857% Day Change: -9999 | |
| Week Change: -51.0475% Year-to-date Change: 0.0% | |
| ASBB Links: Profile News Message Board | |
| Charts:- Daily , Weekly | |
| Add ASBB to Watchlist: View: Get Complete ASBB Trend Analysis ➞ | |
 | CVLY Codorus Valley Bancorp, Inc. |
| Sector: Financials | |
| SubSector: Regional - Northeast Banks | |
| MarketCap: 173.799 Millions | |
| Recent Price: 10.79 Smart Investing & Trading Score: 10 | |
| Day Percent Change: -0.461255% Day Change: -9999 | |
| Week Change: -52.8821% Year-to-date Change: 0.0% | |
| CVLY Links: Profile News Message Board | |
| Charts:- Daily , Weekly | |
| Add CVLY to Watchlist: View: Get Complete CVLY Trend Analysis ➞ | |
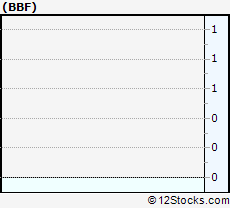 | BBF BlackRock Municipal Income Investment Trust |
| Sector: Financials | |
| SubSector: Closed-End Fund - Debt | |
| MarketCap: 115.207 Millions | |
| Recent Price: 6.78 Smart Investing & Trading Score: 20 | |
| Day Percent Change: 1.8018% Day Change: -9999 | |
| Week Change: -52.982% Year-to-date Change: 0.0% | |
| BBF Links: Profile News Message Board | |
| Charts:- Daily , Weekly | |
| Add BBF to Watchlist: View: Get Complete BBF Trend Analysis ➞ | |
 | CIIC CIIG Merger Corp. |
| Sector: Financials | |
| SubSector: SPAC | |
| MarketCap: 10157 Millions | |
| Recent Price: 9.81 Smart Investing & Trading Score: 20 | |
| Day Percent Change: 0.102041% Day Change: -9999 | |
| Week Change: -54.5833% Year-to-date Change: 0.0% | |
| CIIC Links: Profile News Message Board | |
| Charts:- Daily , Weekly | |
| Add CIIC to Watchlist: View: Get Complete CIIC Trend Analysis ➞ | |
 | WFBI WashingtonFirst Bankshares, Inc. |
| Sector: Financials | |
| SubSector: Regional - Mid-Atlantic Banks | |
| MarketCap: 358.77 Millions | |
| Recent Price: 1.52 Smart Investing & Trading Score: 10 | |
| Day Percent Change: -0.653595% Day Change: -9999 | |
| Week Change: -55.4252% Year-to-date Change: 0.0% | |
| WFBI Links: Profile News Message Board | |
| Charts:- Daily , Weekly | |
| Add WFBI to Watchlist: View: Get Complete WFBI Trend Analysis ➞ | |
 | ZBK Zions Bancorporation |
| Sector: Financials | |
| SubSector: Regional - Pacific Banks | |
| MarketCap: 5960.54 Millions | |
| Recent Price: 16.07 Smart Investing & Trading Score: 10 | |
| Day Percent Change: 1.26024% Day Change: -9999 | |
| Week Change: -55.4848% Year-to-date Change: 0.0% | |
| ZBK Links: Profile News Message Board | |
| Charts:- Daily , Weekly | |
| Add ZBK to Watchlist: View: Get Complete ZBK Trend Analysis ➞ | |
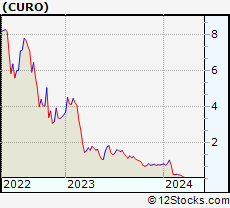 | CURO CURO Group Holdings Corp. |
| Sector: Financials | |
| SubSector: Credit Services | |
| MarketCap: 195.208 Millions | |
| Recent Price: 0.06 Smart Investing & Trading Score: 20 | |
| Day Percent Change: -14.1429% Day Change: -9999 | |
| Week Change: -56.1314% Year-to-date Change: 0.0% | |
| CURO Links: Profile News Message Board | |
| Charts:- Daily , Weekly | |
| Add CURO to Watchlist: View: Get Complete CURO Trend Analysis ➞ | |
 | BMTC Bryn Mawr Bank Corporation |
| Sector: Financials | |
| SubSector: Regional - Mid-Atlantic Banks | |
| MarketCap: 572.459 Millions | |
| Recent Price: 20.01 Smart Investing & Trading Score: 30 | |
| Day Percent Change: 5.09454% Day Change: -9999 | |
| Week Change: -56.3957% Year-to-date Change: 0.0% | |
| BMTC Links: Profile News Message Board | |
| Charts:- Daily , Weekly | |
| Add BMTC to Watchlist: View: Get Complete BMTC Trend Analysis ➞ | |
 | FSIC FS Investment Corporation |
| Sector: Financials | |
| SubSector: Diversified Investments | |
| MarketCap: 2372.58 Millions | |
| Recent Price: 10.27 Smart Investing & Trading Score: 0 | |
| Day Percent Change: -0.387973% Day Change: -9999 | |
| Week Change: -56.9392% Year-to-date Change: 0.0% | |
| FSIC Links: Profile News Message Board | |
| Charts:- Daily , Weekly | |
| Add FSIC to Watchlist: View: Get Complete FSIC Trend Analysis ➞ | |
 | PCBK Pacific Continental Corporation |
| Sector: Financials | |
| SubSector: Regional - Pacific Banks | |
| MarketCap: 553.85 Millions | |
| Recent Price: 2.00 Smart Investing & Trading Score: 10 | |
| Day Percent Change: 0% Day Change: -9999 | |
| Week Change: -57.6271% Year-to-date Change: 0.0% | |
| PCBK Links: Profile News Message Board | |
| Charts:- Daily , Weekly | |
| Add PCBK to Watchlist: View: Get Complete PCBK Trend Analysis ➞ | |
 | ABDC Alcentra Capital Corporation |
| Sector: Financials | |
| SubSector: Asset Management | |
| MarketCap: 179.56 Millions | |
| Recent Price: 2.64 Smart Investing & Trading Score: 20 | |
| Day Percent Change: -4% Day Change: -9999 | |
| Week Change: -57.76% Year-to-date Change: 0.0% | |
| ABDC Links: Profile News Message Board | |
| Charts:- Daily , Weekly | |
| Add ABDC to Watchlist: View: Get Complete ABDC Trend Analysis ➞ | |
 | ACSF American Capital Senior Floating, Ltd. |
| Sector: Financials | |
| SubSector: Asset Management | |
| MarketCap: 133.5 Millions | |
| Recent Price: 5.75 Smart Investing & Trading Score: 10 | |
| Day Percent Change: 0.34904% Day Change: -9999 | |
| Week Change: -57.8755% Year-to-date Change: 0.0% | |
| ACSF Links: Profile News Message Board | |
| Charts:- Daily , Weekly | |
| Add ACSF to Watchlist: View: Get Complete ACSF Trend Analysis ➞ | |
 | SLCT Select Bancorp, Inc. |
| Sector: Financials | |
| SubSector: Regional - Mid-Atlantic Banks | |
| MarketCap: 148.259 Millions | |
| Recent Price: 7.01 Smart Investing & Trading Score: 10 | |
| Day Percent Change: 0.142857% Day Change: -9999 | |
| Week Change: -62.8708% Year-to-date Change: 0.0% | |
| SLCT Links: Profile News Message Board | |
| Charts:- Daily , Weekly | |
| Add SLCT to Watchlist: View: Get Complete SLCT Trend Analysis ➞ | |
 | NUM Nuveen Michigan Quality Municipal Income Fund |
| Sector: Financials | |
| SubSector: Asset Management | |
| MarketCap: 246.103 Millions | |
| Recent Price: 60.69 Smart Investing & Trading Score: 10 | |
| Day Percent Change: -0.93046% Day Change: -9999 | |
| Week Change: -63.1646% Year-to-date Change: 0.0% | |
| NUM Links: Profile News Message Board | |
| Charts:- Daily , Weekly | |
| Add NUM to Watchlist: View: Get Complete NUM Trend Analysis ➞ | |
| For tabular summary view of above stock list: Summary View ➞ 0 - 25 , 25 - 50 , 50 - 75 , 75 - 100 , 100 - 125 , 125 - 150 , 150 - 175 , 175 - 200 , 200 - 225 , 225 - 250 , 250 - 275 , 275 - 300 , 300 - 325 , 325 - 350 , 350 - 375 , 375 - 400 , 400 - 425 , 425 - 450 , 450 - 475 , 475 - 500 , 500 - 525 , 525 - 550 , 550 - 575 , 575 - 600 , 600 - 625 , 625 - 650 , 650 - 675 , 675 - 700 , 700 - 725 , 725 - 750 , 750 - 775 , 775 - 800 , 800 - 825 , 825 - 850 , 850 - 875 , 875 - 900 , 900 - 925 , 925 - 950 , 950 - 975 , 975 - 1000 , 1000 - 1025 , 1025 - 1050 , 1050 - 1075 , 1075 - 1100 , 1100 - 1125 , 1125 - 1150 , 1150 - 1175 , 1175 - 1200 , 1200 - 1225 , 1225 - 1250 , 1250 - 1275 , 1275 - 1300 , 1300 - 1325 , 1325 - 1350 , 1350 - 1375 , 1375 - 1400 , 1400 - 1425 , 1425 - 1450 , 1450 - 1475 , 1475 - 1500 , 1500 - 1525 , 1525 - 1550 | ||
| Click To Change The Sort Order: By Market Cap or Company Size Performance: Year-to-date, Week and Day | |
| Select Chart Type: | ||
|
Best Stocks Today 12Stocks.com |
© 2025 12Stocks.com Terms & Conditions Privacy Contact Us
All Information Provided Only For Education And Not To Be Used For Investing or Trading. See Terms & Conditions


One More Thing ... Get Best Stocks Delivered Daily!
Never Ever Miss A Move With Our Top Ten Stocks Lists
Find Best Stocks In Any Market - Bull or Bear Market
Take A Peek At Our Top Ten Stocks Lists: Daily, Weekly, Year-to-Date & Top Trends
Find Best Stocks In Any Market - Bull or Bear Market
Take A Peek At Our Top Ten Stocks Lists: Daily, Weekly, Year-to-Date & Top Trends
Financial Stocks With Best Up Trends [0-bearish to 100-bullish]: PIMCO California[100], Torchmark [100], B. Riley[100], PIMCO California[100], Better Home[100], Triumph Bancorp[100], Cipher Mining[100], PIMCO Municipal[100], PIMCO Municipal[100], SuRo Capital[100], Jefferies [100]
Best Financial Stocks Year-to-Date:
Insight Select[12384.6%], Oxford Lane[292.029%], Better Home[209.081%], Robinhood Markets[200.811%], Metalpha Technology[196.46%], Cipher Mining[156.315%], Mr. Cooper[135%], LoanDepot [133.846%], Banco Santander[129.354%], IHS Holding[117.61%], Deutsche Bank[114.955%] Best Financial Stocks This Week:
Colony Starwood[15929900%], Blackhawk Network[91300%], Macquarie Global[81662.9%], Credit Suisse[63241.6%], Pennsylvania Real[23823%], First Republic[22570.9%], Select ome[14000%], CorEnergy Infrastructure[6797.78%], FedNat Holding[5525%], BlackRock Municipal[5340%], BlackRock MuniYield[3379.04%] Best Financial Stocks Daily:
Offerpad [12.3487%], PIMCO California[11.9545%], Torchmark [11.8363%], B. Riley[11.5556%], PIMCO California[11.4754%], BlackRock Muni[10.8108%], Blackrock MuniYield[10.72%], Better Home[10.5675%], Triumph Bancorp[10.2661%], Coinbase Global[8.50387%], BlackRock MuniYield[8.15348%]