
 Login Sign Up


| |||||
 |  | ||||

| 12Stocks.com Market Intelligence |
Best Financial Stocks
| In a hurry? Financial Stocks Lists: Performance Trends Table, Stock Charts
Sort Financial stocks: Daily, Weekly, Year-to-Date, Market Cap & Trends. Filter Financial stocks list by size:All Financial Large Mid-Range Small & MicroCap |
| 12Stocks.com Financial Stocks Performances & Trends Daily | |||||||||
|
|  The overall Smart Investing & Trading Score is 90 (0-bearish to 100-bullish) which puts Financial sector in short term bullish trend. The Smart Investing & Trading Score from previous trading session is 60 and an improvement of trend continues.
| ||||||||
Here are the Smart Investing & Trading Scores of the most requested Financial stocks at 12Stocks.com (click stock name for detailed review):
|


| 12Stocks.com: Investing in Financial sector with Stocks | |
|
The following table helps investors and traders sort through current performance and trends (as measured by Smart Investing & Trading Score) of various
stocks in the Financial sector. Quick View: Move mouse or cursor over stock symbol (ticker) to view short-term Technical chart and over stock name to view long term chart. Click on  to add stock symbol to your watchlist and to add stock symbol to your watchlist and  to view watchlist. Click on any ticker or stock name for detailed market intelligence report for that stock. to view watchlist. Click on any ticker or stock name for detailed market intelligence report for that stock. |
12Stocks.com Performance of Stocks in Financial Sector
| Ticker | Stock Name | Watchlist | Category | Recent Price | Smart Investing & Trading Score | Change % | Weekly Change% |
| BSIG | BrightSphere |   | Asset Mgmt | 26.34 | 20 | -0.11% | -2.48% |
| CTBI | Community Trust | | Banks - Regional | 56.09 | 20 | 0.85% | -2.49% |
| THW | abrdn World | | Closed-End Fund - Equity | 11.77 | 30 | 0.00% | -2.49% |
| BGT | BlackRock Floating | | Closed-End Fund - Debt | 12.13 | 0 | -0.98% | -2.49% |
| WRLD | World Acceptance | | Credit Services | 167.83 | 40 | -0.27% | -2.51% |
| LPLA | LPL | | Capital Markets | 341.77 | 40 | 1.66% | -2.53% |
| HFWA | Heritage | | Banks - Regional | 24.24 | 40 | 0.87% | -2.53% |
| PRK | Park National | | Banks - Regional | 165.63 | 0 | 0.70% | -2.55% |
| BMRC | Bank of Marin Bancorp | | Banks - Regional | 24.48 | 30 | 0.49% | -2.55% |
| KREF | KKR Real | | REIT - Mortgage | 9.52 | 50 | 1.71% | -2.56% |
| MOFG | MidWestOne | | Banks - Regional | 28.65 | 0 | 0.42% | -2.58% |
| IBKC | IBERIABANK | | Regional Banks | 22.91 | 40 | -0.30% | -2.59% |
| QD | Qudian | | Credit Services | 4.12 | 30 | -0.72% | -2.60% |
| HHC | Howard Hughes | | Real Estatet | 67.85 | 0 | -0.91% | -2.64% |
| BXMT | Blackstone Mortgage | | REIT - Mortgage | 19.34 | 20 | -0.10% | -2.67% |
| UE | Urban Edge | | REIT - Retail | 20.52 | 30 | 0.49% | -2.70% |
| TRTX | TPG RE | | REIT - Mortgage | 9.25 | 30 | -0.22% | -2.73% |
| RWT | Redwood Trust | | REIT - Mortgage | 6.03 | 30 | -0.17% | -2.74% |
| DRH | Diamondrock Hospitality | | REIT - Hotel & Motel | 8.13 | 30 | -0.97% | -2.75% |
| AXS | Axis Capital | | Insurance - Specialty | 96.35 | 40 | 1.51% | -2.76% |
| CGBD | Carlyle Secured | | Asset Mgmt | 13.32 | 0 | 0.08% | -2.77% |
| LTC | LTC Properties | | REIT | 35.54 | 20 | -0.08% | -2.79% |
| CLDT | Chatham Lodging | | REIT - Hotel & Motel | 6.94 | 20 | -1.56% | -2.80% |
| ECC | Eagle Point | | Closed-End Fund - Debt | 6.94 | 10 | -0.86% | -2.80% |
| CBL | CBL& Associates | | REIT - Retail | 31.11 | 30 | -0.19% | -2.81% |
| For chart view version of above stock list: Chart View ➞ 0 - 25 , 25 - 50 , 50 - 75 , 75 - 100 , 100 - 125 , 125 - 150 , 150 - 175 , 175 - 200 , 200 - 225 , 225 - 250 , 250 - 275 , 275 - 300 , 300 - 325 , 325 - 350 , 350 - 375 , 375 - 400 , 400 - 425 , 425 - 450 , 450 - 475 , 475 - 500 , 500 - 525 , 525 - 550 , 550 - 575 , 575 - 600 , 600 - 625 , 625 - 650 , 650 - 675 , 675 - 700 , 700 - 725 , 725 - 750 , 750 - 775 , 775 - 800 , 800 - 825 , 825 - 850 , 850 - 875 , 875 - 900 , 900 - 925 , 925 - 950 , 950 - 975 , 975 - 1000 , 1000 - 1025 , 1025 - 1050 , 1050 - 1075 , 1075 - 1100 , 1100 - 1125 , 1125 - 1150 , 1150 - 1175 , 1175 - 1200 , 1200 - 1225 , 1225 - 1250 , 1250 - 1275 , 1275 - 1300 , 1300 - 1325 , 1325 - 1350 , 1350 - 1375 , 1375 - 1400 , 1400 - 1425 , 1425 - 1450 , 1450 - 1475 , 1475 - 1500 , 1500 - 1525 , 1525 - 1550 | ||
 | Click To Change The Sort Order: By Market Cap or Company Size Performance: Year-to-date, Week and Day |  |
|
Get the most comprehensive stock market coverage daily at 12Stocks.com ➞ Best Stocks Today ➞ Best Stocks Weekly ➞ Best Stocks Year-to-Date ➞ Best Stocks Trends ➞  Best Stocks Today 12Stocks.com Best Nasdaq Stocks ➞ Best S&P 500 Stocks ➞ Best Tech Stocks ➞ Best Biotech Stocks ➞ |
| Detailed Overview of Financial Stocks |
| Financial Technical Overview, Leaders & Laggards, Top Financial ETF Funds & Detailed Financial Stocks List, Charts, Trends & More |
| Financial Sector: Technical Analysis, Trends & YTD Performance | |
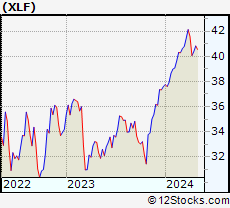
| Financial sector is composed of stocks
from banks, brokers, insurance, REITs
and services subsectors. Financial sector, as represented by XLF, an exchange-traded fund [ETF] that holds basket of Financial stocks (e.g, Bank of America, Goldman Sachs) is up by 13.1362% and is currently underperforming the overall market by -0.884% year-to-date. Below is a quick view of Technical charts and trends: |
|
 XLF Weekly Chart |
|
| Long Term Trend: Good | |
| Medium Term Trend: Good | |
 XLF Daily Chart |
|
| Short Term Trend: Very Good | |
| Overall Trend Score: 90 | |
| YTD Performance: 13.1362% | |
| **Trend Scores & Views Are Only For Educational Purposes And Not For Investing | |
| 12Stocks.com: Top Performing Financial Sector Stocks | |||||||||||||||||||||||||||||||||||||||||||||||
 The top performing Financial sector stocks year to date are
Now, more recently, over last week, the top performing Financial sector stocks on the move are


|
|||||||||||||||||||||||||||||||||||||||||||||||
| 12Stocks.com: Investing in Financial Sector using Exchange Traded Funds | |
|
The following table shows list of key exchange traded funds (ETF) that
help investors track Financial Index. For detailed view, check out our ETF Funds section of our website. Quick View: Move mouse or cursor over ETF symbol (ticker) to view short-term Technical chart and over ETF name to view long term chart. Click on ticker or stock name for detailed view. Click on to add stock symbol to your watchlist and to view watchlist. |
12Stocks.com List of ETFs that track Financial Index
| Ticker | ETF Name | Watchlist | Recent Price | Smart Investing & Trading Score | Change % | Week % | Year-to-date % |
| CHIX | China Financials | | 10.57 | 20 | 0 | 0 | 0% |
| 12Stocks.com: Charts, Trends, Fundamental Data and Performances of Financial Stocks | |
|
We now take in-depth look at all Financial stocks including charts, multi-period performances and overall trends (as measured by Smart Investing & Trading Score). One can sort Financial stocks (click link to choose) by Daily, Weekly and by Year-to-Date performances. Also, one can sort by size of the company or by market capitalization. |
| Select Your Default Chart Type: | |||||
| |||||
| Click on stock symbol or name for detailed view. Click on to add stock symbol to your watchlist and to view watchlist. Quick View: Move mouse or cursor over "Daily" to quickly view daily Technical stock chart and over "Weekly" to view weekly Technical stock chart. | |||||

 | BSIG BrightSphere Investment Group Inc. |
| Sector: Financials | |
| SubSector: Asset Management | |
| MarketCap: 430.103 Millions | |
| Recent Price: 26.34 Smart Investing & Trading Score: 20 | |
| Day Percent Change: -0.113766% Day Change: -9999 | |
| Week Change: -2.48056% Year-to-date Change: 0.0% | |
| BSIG Links: Profile News Message Board | |
| Charts:- Daily , Weekly | |
| Add BSIG to Watchlist: View: Get Complete BSIG Trend Analysis ➞ | |
 | CTBI Community Trust Bancorp, Inc |
| Sector: Financials | |
| SubSector: Banks - Regional | |
| MarketCap: 1057.11 Millions | |
| Recent Price: 56.09 Smart Investing & Trading Score: 20 | |
| Day Percent Change: 0.84502% Day Change: -0.33 | |
| Week Change: -2.48609% Year-to-date Change: 10.0% | |
| CTBI Links: Profile News Message Board | |
| Charts:- Daily , Weekly | |
| Add CTBI to Watchlist: View: Get Complete CTBI Trend Analysis ➞ | |
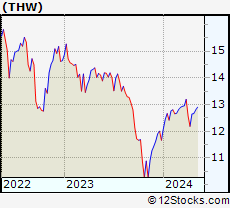 | THW abrdn World Healthcare Fund |
| Sector: Financials | |
| SubSector: Closed-End Fund - Equity | |
| MarketCap: 478.6 Millions | |
| Recent Price: 11.77 Smart Investing & Trading Score: 30 | |
| Day Percent Change: 0% Day Change: 0.08 | |
| Week Change: -2.4855% Year-to-date Change: 14.3% | |
| THW Links: Profile News Message Board | |
| Charts:- Daily , Weekly | |
| Add THW to Watchlist: View: Get Complete THW Trend Analysis ➞ | |
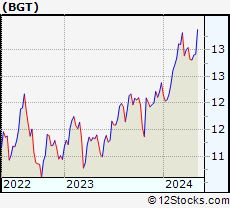 | BGT BlackRock Floating Rate Income Trust |
| Sector: Financials | |
| SubSector: Closed-End Fund - Debt | |
| MarketCap: 335.32 Millions | |
| Recent Price: 12.13 Smart Investing & Trading Score: 0 | |
| Day Percent Change: -0.979592% Day Change: 0.05 | |
| Week Change: -2.49196% Year-to-date Change: 0.4% | |
| BGT Links: Profile News Message Board | |
| Charts:- Daily , Weekly | |
| Add BGT to Watchlist: View: Get Complete BGT Trend Analysis ➞ | |
 | WRLD World Acceptance Corp |
| Sector: Financials | |
| SubSector: Credit Services | |
| MarketCap: 942.18 Millions | |
| Recent Price: 167.83 Smart Investing & Trading Score: 40 | |
| Day Percent Change: -0.273338% Day Change: 0.68 | |
| Week Change: -2.50944% Year-to-date Change: 49.4% | |
| WRLD Links: Profile News Message Board | |
| Charts:- Daily , Weekly | |
| Add WRLD to Watchlist: View: Get Complete WRLD Trend Analysis ➞ | |
 | LPLA LPL Financial Holdings Inc |
| Sector: Financials | |
| SubSector: Capital Markets | |
| MarketCap: 26640.6 Millions | |
| Recent Price: 341.77 Smart Investing & Trading Score: 40 | |
| Day Percent Change: 1.66% Day Change: 5.58 | |
| Week Change: -2.53% Year-to-date Change: -6.7% | |
| LPLA Links: Profile News Message Board | |
| Charts:- Daily , Weekly | |
| Add LPLA to Watchlist: View: Get Complete LPLA Trend Analysis ➞ | |
 | HFWA Heritage Financial Corp |
| Sector: Financials | |
| SubSector: Banks - Regional | |
| MarketCap: 842.04 Millions | |
| Recent Price: 24.24 Smart Investing & Trading Score: 40 | |
| Day Percent Change: 0.873908% Day Change: -0.24 | |
| Week Change: -2.53317% Year-to-date Change: 3.9% | |
| HFWA Links: Profile News Message Board | |
| Charts:- Daily , Weekly | |
| Add HFWA to Watchlist: View: Get Complete HFWA Trend Analysis ➞ | |
 | PRK Park National Corp |
| Sector: Financials | |
| SubSector: Banks - Regional | |
| MarketCap: 2765.72 Millions | |
| Recent Price: 165.63 Smart Investing & Trading Score: 0 | |
| Day Percent Change: 0.699173% Day Change: -1.2 | |
| Week Change: -2.55339% Year-to-date Change: -1.8% | |
| PRK Links: Profile News Message Board | |
| Charts:- Daily , Weekly | |
| Add PRK to Watchlist: View: Get Complete PRK Trend Analysis ➞ | |
 | BMRC Bank of Marin Bancorp |
| Sector: Financials | |
| SubSector: Banks - Regional | |
| MarketCap: 399.75 Millions | |
| Recent Price: 24.48 Smart Investing & Trading Score: 30 | |
| Day Percent Change: 0.492611% Day Change: -0.14 | |
| Week Change: -2.54777% Year-to-date Change: 7.6% | |
| BMRC Links: Profile News Message Board | |
| Charts:- Daily , Weekly | |
| Add BMRC to Watchlist: View: Get Complete BMRC Trend Analysis ➞ | |
 | KREF KKR Real Estate Finance Trust Inc |
| Sector: Financials | |
| SubSector: REIT - Mortgage | |
| MarketCap: 650.59 Millions | |
| Recent Price: 9.52 Smart Investing & Trading Score: 50 | |
| Day Percent Change: 1.7094% Day Change: -0.23 | |
| Week Change: -2.55885% Year-to-date Change: -1.9% | |
| KREF Links: Profile News Message Board | |
| Charts:- Daily , Weekly | |
| Add KREF to Watchlist: View: Get Complete KREF Trend Analysis ➞ | |
 | MOFG MidWestOne Financial Group Inc |
| Sector: Financials | |
| SubSector: Banks - Regional | |
| MarketCap: 617.67 Millions | |
| Recent Price: 28.65 Smart Investing & Trading Score: 0 | |
| Day Percent Change: 0.42061% Day Change: -0.04 | |
| Week Change: -2.58416% Year-to-date Change: 2.2% | |
| MOFG Links: Profile News Message Board | |
| Charts:- Daily , Weekly | |
| Add MOFG to Watchlist: View: Get Complete MOFG Trend Analysis ➞ | |
 | IBKC IBERIABANK Corporation |
| Sector: Financials | |
| SubSector: Regional - Southeast Banks | |
| MarketCap: 1874.75 Millions | |
| Recent Price: 22.91 Smart Investing & Trading Score: 40 | |
| Day Percent Change: -0.304613% Day Change: -9999 | |
| Week Change: -2.59354% Year-to-date Change: 0.0% | |
| IBKC Links: Profile News Message Board | |
| Charts:- Daily , Weekly | |
| Add IBKC to Watchlist: View: Get Complete IBKC Trend Analysis ➞ | |
 | QD Qudian Inc ADR |
| Sector: Financials | |
| SubSector: Credit Services | |
| MarketCap: 451.28 Millions | |
| Recent Price: 4.12 Smart Investing & Trading Score: 30 | |
| Day Percent Change: -0.722892% Day Change: -0.19 | |
| Week Change: -2.60047% Year-to-date Change: 47.1% | |
| QD Links: Profile News Message Board | |
| Charts:- Daily , Weekly | |
| Add QD to Watchlist: View: Get Complete QD Trend Analysis ➞ | |
 | HHC The Howard Hughes Corporation |
| Sector: Financials | |
| SubSector: Real Estate Development | |
| MarketCap: 2002.49 Millions | |
| Recent Price: 67.85 Smart Investing & Trading Score: 0 | |
| Day Percent Change: -0.905506% Day Change: -9999 | |
| Week Change: -2.64026% Year-to-date Change: 0.0% | |
| HHC Links: Profile News Message Board | |
| Charts:- Daily , Weekly | |
| Add HHC to Watchlist: View: Get Complete HHC Trend Analysis ➞ | |
 | BXMT Blackstone Mortgage Trust Inc |
| Sector: Financials | |
| SubSector: REIT - Mortgage | |
| MarketCap: 3445.3 Millions | |
| Recent Price: 19.34 Smart Investing & Trading Score: 20 | |
| Day Percent Change: -0.103306% Day Change: -0.21 | |
| Week Change: -2.66734% Year-to-date Change: 14.2% | |
| BXMT Links: Profile News Message Board | |
| Charts:- Daily , Weekly | |
| Add BXMT to Watchlist: View: Get Complete BXMT Trend Analysis ➞ | |
 | UE Urban Edge Properties |
| Sector: Financials | |
| SubSector: REIT - Retail | |
| MarketCap: 2806.92 Millions | |
| Recent Price: 20.52 Smart Investing & Trading Score: 30 | |
| Day Percent Change: 0.489716% Day Change: -0.2 | |
| Week Change: -2.7027% Year-to-date Change: -1.3% | |
| UE Links: Profile News Message Board | |
| Charts:- Daily , Weekly | |
| Add UE to Watchlist: View: Get Complete UE Trend Analysis ➞ | |
 | TRTX TPG RE Finance Trust Inc |
| Sector: Financials | |
| SubSector: REIT - Mortgage | |
| MarketCap: 760.76 Millions | |
| Recent Price: 9.25 Smart Investing & Trading Score: 30 | |
| Day Percent Change: -0.21575% Day Change: -0.16 | |
| Week Change: -2.73396% Year-to-date Change: 14.6% | |
| TRTX Links: Profile News Message Board | |
| Charts:- Daily , Weekly | |
| Add TRTX to Watchlist: View: Get Complete TRTX Trend Analysis ➞ | |
 | RWT Redwood Trust Inc |
| Sector: Financials | |
| SubSector: REIT - Mortgage | |
| MarketCap: 823.15 Millions | |
| Recent Price: 6.03 Smart Investing & Trading Score: 30 | |
| Day Percent Change: -0.165563% Day Change: -0.18 | |
| Week Change: -2.74194% Year-to-date Change: -1.2% | |
| RWT Links: Profile News Message Board | |
| Charts:- Daily , Weekly | |
| Add RWT to Watchlist: View: Get Complete RWT Trend Analysis ➞ | |
 | DRH Diamondrock Hospitality Co |
| Sector: Financials | |
| SubSector: REIT - Hotel & Motel | |
| MarketCap: 1767.32 Millions | |
| Recent Price: 8.13 Smart Investing & Trading Score: 30 | |
| Day Percent Change: -0.974421% Day Change: 0.01 | |
| Week Change: -2.7512% Year-to-date Change: -7.0% | |
| DRH Links: Profile News Message Board | |
| Charts:- Daily , Weekly | |
| Add DRH to Watchlist: View: Get Complete DRH Trend Analysis ➞ | |
 | AXS Axis Capital Holdings Ltd |
| Sector: Financials | |
| SubSector: Insurance - Specialty | |
| MarketCap: 7616.49 Millions | |
| Recent Price: 96.35 Smart Investing & Trading Score: 40 | |
| Day Percent Change: 1.51% Day Change: 1.43 | |
| Week Change: -2.76% Year-to-date Change: 6.8% | |
| AXS Links: Profile News Message Board | |
| Charts:- Daily , Weekly | |
| Add AXS to Watchlist: View: Get Complete AXS Trend Analysis ➞ | |
 | CGBD Carlyle Secured Lending Inc |
| Sector: Financials | |
| SubSector: Asset Management | |
| MarketCap: 1005.33 Millions | |
| Recent Price: 13.32 Smart Investing & Trading Score: 0 | |
| Day Percent Change: 0.0751315% Day Change: -0.01 | |
| Week Change: -2.77372% Year-to-date Change: -22.2% | |
| CGBD Links: Profile News Message Board | |
| Charts:- Daily , Weekly | |
| Add CGBD to Watchlist: View: Get Complete CGBD Trend Analysis ➞ | |
 | LTC LTC Properties, Inc |
| Sector: Financials | |
| SubSector: REIT - Healthcare Facilities | |
| MarketCap: 1686.91 Millions | |
| Recent Price: 35.54 Smart Investing & Trading Score: 20 | |
| Day Percent Change: -0.0843407% Day Change: 0.27 | |
| Week Change: -2.78993% Year-to-date Change: 8.5% | |
| LTC Links: Profile News Message Board | |
| Charts:- Daily , Weekly | |
| Add LTC to Watchlist: View: Get Complete LTC Trend Analysis ➞ | |
 | CLDT Chatham Lodging Trust |
| Sector: Financials | |
| SubSector: REIT - Hotel & Motel | |
| MarketCap: 362.93 Millions | |
| Recent Price: 6.94 Smart Investing & Trading Score: 20 | |
| Day Percent Change: -1.56028% Day Change: 0 | |
| Week Change: -2.80112% Year-to-date Change: -19.0% | |
| CLDT Links: Profile News Message Board | |
| Charts:- Daily , Weekly | |
| Add CLDT to Watchlist: View: Get Complete CLDT Trend Analysis ➞ | |
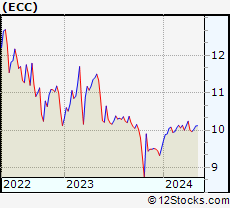 | ECC Eagle Point Credit Company Inc |
| Sector: Financials | |
| SubSector: Closed-End Fund - Debt | |
| MarketCap: 953.8 Millions | |
| Recent Price: 6.94 Smart Investing & Trading Score: 10 | |
| Day Percent Change: -0.857143% Day Change: 0.13 | |
| Week Change: -2.80112% Year-to-date Change: -11.8% | |
| ECC Links: Profile News Message Board | |
| Charts:- Daily , Weekly | |
| Add ECC to Watchlist: View: Get Complete ECC Trend Analysis ➞ | |
 | CBL CBL& Associates Properties, Inc |
| Sector: Financials | |
| SubSector: REIT - Retail | |
| MarketCap: 989.86 Millions | |
| Recent Price: 31.11 Smart Investing & Trading Score: 30 | |
| Day Percent Change: -0.192493% Day Change: -0.34 | |
| Week Change: -2.81162% Year-to-date Change: 10.5% | |
| CBL Links: Profile News Message Board | |
| Charts:- Daily , Weekly | |
| Add CBL to Watchlist: View: Get Complete CBL Trend Analysis ➞ | |
| For tabular summary view of above stock list: Summary View ➞ 0 - 25 , 25 - 50 , 50 - 75 , 75 - 100 , 100 - 125 , 125 - 150 , 150 - 175 , 175 - 200 , 200 - 225 , 225 - 250 , 250 - 275 , 275 - 300 , 300 - 325 , 325 - 350 , 350 - 375 , 375 - 400 , 400 - 425 , 425 - 450 , 450 - 475 , 475 - 500 , 500 - 525 , 525 - 550 , 550 - 575 , 575 - 600 , 600 - 625 , 625 - 650 , 650 - 675 , 675 - 700 , 700 - 725 , 725 - 750 , 750 - 775 , 775 - 800 , 800 - 825 , 825 - 850 , 850 - 875 , 875 - 900 , 900 - 925 , 925 - 950 , 950 - 975 , 975 - 1000 , 1000 - 1025 , 1025 - 1050 , 1050 - 1075 , 1075 - 1100 , 1100 - 1125 , 1125 - 1150 , 1150 - 1175 , 1175 - 1200 , 1200 - 1225 , 1225 - 1250 , 1250 - 1275 , 1275 - 1300 , 1300 - 1325 , 1325 - 1350 , 1350 - 1375 , 1375 - 1400 , 1400 - 1425 , 1425 - 1450 , 1450 - 1475 , 1475 - 1500 , 1500 - 1525 , 1525 - 1550 | ||
| Click To Change The Sort Order: By Market Cap or Company Size Performance: Year-to-date, Week and Day | |
| Select Chart Type: | ||
|
Best Stocks Today 12Stocks.com |
© 2025 12Stocks.com Terms & Conditions Privacy Contact Us
All Information Provided Only For Education And Not To Be Used For Investing or Trading. See Terms & Conditions


One More Thing ... Get Best Stocks Delivered Daily!
Never Ever Miss A Move With Our Top Ten Stocks Lists
Find Best Stocks In Any Market - Bull or Bear Market
Take A Peek At Our Top Ten Stocks Lists: Daily, Weekly, Year-to-Date & Top Trends
Find Best Stocks In Any Market - Bull or Bear Market
Take A Peek At Our Top Ten Stocks Lists: Daily, Weekly, Year-to-Date & Top Trends
Financial Stocks With Best Up Trends [0-bearish to 100-bullish]: PIMCO California[100], Torchmark [100], B. Riley[100], PIMCO California[100], Better Home[100], Triumph Bancorp[100], Cipher Mining[100], PIMCO Municipal[100], PIMCO Municipal[100], SuRo Capital[100], Jefferies [100]
Best Financial Stocks Year-to-Date:
Insight Select[12384.6%], Oxford Lane[292.029%], Better Home[209.081%], Robinhood Markets[200.811%], Metalpha Technology[196.46%], Cipher Mining[156.315%], Mr. Cooper[135%], LoanDepot [133.846%], Banco Santander[129.354%], IHS Holding[117.61%], Deutsche Bank[114.955%] Best Financial Stocks This Week:
Colony Starwood[15929900%], Blackhawk Network[91300%], Macquarie Global[81662.9%], Credit Suisse[63241.6%], Pennsylvania Real[23823%], First Republic[22570.9%], Select ome[14000%], CorEnergy Infrastructure[6797.78%], FedNat Holding[5525%], BlackRock Municipal[5340%], BlackRock MuniYield[3379.04%] Best Financial Stocks Daily:
Offerpad [12.3487%], PIMCO California[11.9545%], Torchmark [11.8363%], B. Riley[11.5556%], PIMCO California[11.4754%], BlackRock Muni[10.8108%], Blackrock MuniYield[10.72%], Better Home[10.5675%], Triumph Bancorp[10.2661%], Coinbase Global[8.50387%], BlackRock MuniYield[8.15348%]