
 Login Sign Up


| |||||
 |  | ||||

| 12Stocks.com Market Intelligence |
Best Energy Stocks
| In a hurry? Energy Stocks Lists: Performance Trends Table, Stock Charts
Sort Energy stocks: Daily, Weekly, Year-to-Date, Market Cap & Trends. Filter Energy stocks list by size: All Energy Large Mid-Range Small & MicroCap |
| 12Stocks.com Energy Stocks Performances & Trends Daily | |||||||||
|
|  The overall Smart Investing & Trading Score is 85 (0-bearish to 100-bullish) which puts Energy sector in short term bullish trend. The Smart Investing & Trading Score from previous trading session is 93 and hence a deterioration of trend.
| ||||||||
Here are the Smart Investing & Trading Scores of the most requested Energy stocks at 12Stocks.com (click stock name for detailed review):
|


| 12Stocks.com: Investing in Energy sector with Stocks | |
|
The following table helps investors and traders sort through current performance and trends (as measured by Smart Investing & Trading Score) of various
stocks in the Energy sector. Quick View: Move mouse or cursor over stock symbol (ticker) to view short-term Technical chart and over stock name to view long term chart. Click on  to add stock symbol to your watchlist and to add stock symbol to your watchlist and  to view watchlist. Click on any ticker or stock name for detailed market intelligence report for that stock. to view watchlist. Click on any ticker or stock name for detailed market intelligence report for that stock. |
12Stocks.com Performance of Stocks in Energy Sector
| Ticker | Stock Name | Watchlist | Category | Recent Price | Smart Investing & Trading Score | Change % | Weekly Change% |
| PBF | PBF |   | Refining | 28.65 | 100 | 2.69% | 18.88% |
| NEXT | NextDecade | | Independent | 10.77 | 100 | 16.94% | 17.83% |
| DK | Delek US | | Refining | 26.56 | 100 | -0.41% | 14.83% |
| PARR | Par Pacific | | Refining | 35.06 | 100 | 1.24% | 11.48% |
| SM | SM | | Independent | 28.52 | 100 | 0.49% | 9.99% |
| VAL | Valaris | | Equipment | 49.90 | 90 | -1.31% | 9.82% |
| KOS | Kosmos | | Independent | 2.17 | 85 | 0.93% | 9.60% |
| NBR | Nabors Industries | | Drilling & Exploration | 34.12 | 88 | -1.59% | 9.50% |
| TDW | Tidewater | | Equipment | 52.61 | 95 | -0.79% | 9.35% |
| MUR | Murphy Oil | | Independent | 26.44 | 100 | 0.84% | 8.05% |
| CVI | CVR | | Refining | 32.23 | 95 | -0.80% | 7.94% |
| HAL | Halliburton | | Equipment | 23.08 | 100 | 4.15% | 7.25% |
| ACDC | ProFrac Holding | | Equipment | 7.97 | 68 | 1.27% | 7.12% |
| HES | Hess | | Independent | 153.22 | 100 | 0.78% | 6.38% |
| CNX | CNX Resources | | Independent | 34.03 | 78 | 2.10% | 6.28% |
| NE | Noble | | Drilling | 30.15 | 83 | -2.11% | 6.16% |
| VLO | Valero | | Refining | 153.05 | 95 | -1.14% | 5.86% |
| OXY | Occidental | | Independent | 46.31 | 100 | 1.00% | 5.73% |
| TALO | Talos | | Independent | 9.13 | 85 | 1.11% | 5.31% |
| OVV | Ovintiv | | Independent | 41.94 | 100 | 2.52% | 5.06% |
| SDRL | Seadrill | | Drilling | 30.50 | 83 | -1.36% | 4.77% |
| CVX | Chevron | | Integrated | 155.31 | 100 | 0.74% | 4.68% |
| SLB | Schlumberger | | Equipment | 37.31 | 100 | 1.80% | 4.66% |
| CHRD | Chord | | E&P | 109.19 | 100 | 1.00% | 4.60% |
| NOV | National Oilwell | | Equipment | 13.68 | 100 | -0.58% | 4.59% |
| For chart view version of above stock list: Chart View ➞ 0 - 25 , 25 - 50 , 50 - 75 , 75 - 100 | ||
 | Click To Change The Sort Order: By Market Cap or Company Size Performance: Year-to-date, Week and Day |  |
|
Get the most comprehensive stock market coverage daily at 12Stocks.com ➞ Best Stocks Today ➞ Best Stocks Weekly ➞ Best Stocks Year-to-Date ➞ Best Stocks Trends ➞  Best Stocks Today 12Stocks.com Best Nasdaq Stocks ➞ Best S&P 500 Stocks ➞ Best Tech Stocks ➞ Best Biotech Stocks ➞ |
| Detailed Overview of Energy Stocks |
| Energy Technical Overview, Leaders & Laggards, Top Energy ETF Funds & Detailed Energy Stocks List, Charts, Trends & More |
| Energy Sector: Technical Analysis, Trends & YTD Performance | |
| Energy sector is composed of stocks
from oil production, refining, exploration, drilling
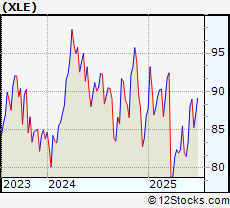
and services subsectors. Energy sector, as represented by XLE, an exchange-traded fund [ETF] that holds basket of Energy stocks (e.g, Exxon, Halliburton) is up by 4.86% and is currently underperforming the overall market by -1.45% year-to-date. Below is a quick view of Technical charts and trends: |
|
 XLE Weekly Chart |
|
| Long Term Trend: Very Good | |
| Medium Term Trend: Very Good | |
 XLE Daily Chart |
|
| Short Term Trend: Very Good | |
| Overall Trend Score: 85 | |
| YTD Performance: 4.86% | |
| **Trend Scores & Views Are Only For Educational Purposes And Not For Investing | |
| 12Stocks.com: Top Performing Energy Sector Stocks | ||||||||||||||||||||||||||||||||||||||||||||||||
 The top performing Energy sector stocks year to date are
Now, more recently, over last week, the top performing Energy sector stocks on the move are


|
||||||||||||||||||||||||||||||||||||||||||||||||
| 12Stocks.com: Investing in Energy Sector using Exchange Traded Funds | |
|
The following table shows list of key exchange traded funds (ETF) that
help investors track Energy Index. For detailed view, check out our ETF Funds section of our website. Quick View: Move mouse or cursor over ETF symbol (ticker) to view short-term Technical chart and over ETF name to view long term chart. Click on ticker or stock name for detailed view. Click on to add stock symbol to your watchlist and to view watchlist. |
12Stocks.com List of ETFs that track Energy Index
| Ticker | ETF Name | Watchlist | Recent Price | Smart Investing & Trading Score | Change % | Week % | Year-to-date % |
| XLE | Energy | | 89.13 | 85 | 0.45 | 2.41 | 4.86% |
| OIH | Oil Services | | 252.23 | 100 | 0.9 | 4.41 | -7.01% |
| USO | Oil | | 77.29 | 73 | 2.52 | 2.79 | 2.3% |
| UNG | Natural Gas | | 14.92 | 25 | 1.15 | -2.16 | -11.24% |
| IYE | Energy | | 47.30 | 93 | 0.42 | 2.01 | 4.51% |
| ERX | Energy Bull 3X | | 56.57 | 100 | 0.87 | 4.37 | 2.27% |
| ERY | Energy Bear 3X | | 20.62 | 0 | -0.82 | -4.58 | -16.89% |
| DIG | Oil & Gas | | 36.65 | 100 | 0.94 | 4.48 | 2.31% |
| DUG | Short Oil & | | 33.97 | 0 | -0.96 | -4.58 | -16.96% |
| XOP | Oil & Gas | | 133.07 | 85 | 0.59 | 3.02 | 1.11% |
| 12Stocks.com: Charts, Trends, Fundamental Data and Performances of Energy Stocks | |
|
We now take in-depth look at all Energy stocks including charts, multi-period performances and overall trends (as measured by Smart Investing & Trading Score). One can sort Energy stocks (click link to choose) by Daily, Weekly and by Year-to-Date performances. Also, one can sort by size of the company or by market capitalization. |
| Select Your Default Chart Type: | |||||
| |||||
| Click on stock symbol or name for detailed view. Click on to add stock symbol to your watchlist and to view watchlist. Quick View: Move mouse or cursor over "Daily" to quickly view daily Technical stock chart and over "Weekly" to view weekly Technical stock chart. | |||||

 | PBF PBF Energy Inc |
| Sector: Energy | |
| SubSector: Oil & Gas Refining & Marketing | |
| MarketCap: 1118.54 Millions | |
| Recent Price: 28.65 Smart Investing & Trading Score: 100 | |
| Day Percent Change: 2.69% Day Change: 0.75 | |
| Week Change: 18.88% Year-to-date Change: 9.3% | |
| PBF Links: Profile News Message Board | |
| Charts:- Daily , Weekly | |
| Add PBF to Watchlist: View: Get Complete PBF Trend Analysis ➞ | |
 | NEXT NextDecade Corporation |
| Sector: Energy | |
| SubSector: Independent Oil & Gas | |
| MarketCap: 270.893 Millions | |
| Recent Price: 10.77 Smart Investing & Trading Score: 100 | |
| Day Percent Change: 16.94% Day Change: 1.56 | |
| Week Change: 17.83% Year-to-date Change: 39.7% | |
| NEXT Links: Profile News Message Board | |
| Charts:- Daily , Weekly | |
| Add NEXT to Watchlist: View: Get Complete NEXT Trend Analysis ➞ | |
 | DK Delek US Holdings, Inc. |
| Sector: Energy | |
| SubSector: Oil & Gas Refining & Marketing | |
| MarketCap: 1328.54 Millions | |
| Recent Price: 26.56 Smart Investing & Trading Score: 100 | |
| Day Percent Change: -0.41% Day Change: -0.11 | |
| Week Change: 14.83% Year-to-date Change: 45.9% | |
| DK Links: Profile News Message Board | |
| Charts:- Daily , Weekly | |
| Add DK to Watchlist: View: Get Complete DK Trend Analysis ➞ | |
 | PARR Par Pacific Holdings, Inc. |
| Sector: Energy | |
| SubSector: Oil & Gas Refining & Marketing | |
| MarketCap: 443.154 Millions | |
| Recent Price: 35.06 Smart Investing & Trading Score: 100 | |
| Day Percent Change: 1.24% Day Change: 0.43 | |
| Week Change: 11.48% Year-to-date Change: 113.9% | |
| PARR Links: Profile News Message Board | |
| Charts:- Daily , Weekly | |
| Add PARR to Watchlist: View: Get Complete PARR Trend Analysis ➞ | |
 | SM SM Energy Company |
| Sector: Energy | |
| SubSector: Independent Oil & Gas | |
| MarketCap: 137.593 Millions | |
| Recent Price: 28.52 Smart Investing & Trading Score: 100 | |
| Day Percent Change: 0.49% Day Change: 0.14 | |
| Week Change: 9.99% Year-to-date Change: -25.4% | |
| SM Links: Profile News Message Board | |
| Charts:- Daily , Weekly | |
| Add SM to Watchlist: View: Get Complete SM Trend Analysis ➞ | |
 | VAL Valaris Limited |
| Sector: Energy | |
| SubSector: Oil & Gas Equipment & Services | |
| MarketCap: 4520 Millions | |
| Recent Price: 49.90 Smart Investing & Trading Score: 90 | |
| Day Percent Change: -1.31% Day Change: -0.66 | |
| Week Change: 9.82% Year-to-date Change: 12.8% | |
| VAL Links: Profile News Message Board | |
| Charts:- Daily , Weekly | |
| Add VAL to Watchlist: View: Get Complete VAL Trend Analysis ➞ | |
 | KOS Kosmos Energy Ltd. |
| Sector: Energy | |
| SubSector: Independent Oil & Gas | |
| MarketCap: 261.693 Millions | |
| Recent Price: 2.17 Smart Investing & Trading Score: 85 | |
| Day Percent Change: 0.93% Day Change: 0.02 | |
| Week Change: 9.6% Year-to-date Change: -36.6% | |
| KOS Links: Profile News Message Board | |
| Charts:- Daily , Weekly | |
| Add KOS to Watchlist: View: Get Complete KOS Trend Analysis ➞ | |
 | NBR Nabors Industries Ltd. |
| Sector: Energy | |
| SubSector: Oil & Gas Drilling & Exploration | |
| MarketCap: 240.539 Millions | |
| Recent Price: 34.12 Smart Investing & Trading Score: 88 | |
| Day Percent Change: -1.59% Day Change: -0.55 | |
| Week Change: 9.5% Year-to-date Change: -40.3% | |
| NBR Links: Profile News Message Board | |
| Charts:- Daily , Weekly | |
| Add NBR to Watchlist: View: Get Complete NBR Trend Analysis ➞ | |
 | TDW Tidewater Inc. |
| Sector: Energy | |
| SubSector: Oil & Gas Equipment & Services | |
| MarketCap: 295.061 Millions | |
| Recent Price: 52.61 Smart Investing & Trading Score: 95 | |
| Day Percent Change: -0.79% Day Change: -0.42 | |
| Week Change: 9.35% Year-to-date Change: -3.8% | |
| TDW Links: Profile News Message Board | |
| Charts:- Daily , Weekly | |
| Add TDW to Watchlist: View: Get Complete TDW Trend Analysis ➞ | |
 | MUR Murphy Oil Corporation |
| Sector: Energy | |
| SubSector: Independent Oil & Gas | |
| MarketCap: 985.993 Millions | |
| Recent Price: 26.44 Smart Investing & Trading Score: 100 | |
| Day Percent Change: 0.84% Day Change: 0.22 | |
| Week Change: 8.05% Year-to-date Change: -11.6% | |
| MUR Links: Profile News Message Board | |
| Charts:- Daily , Weekly | |
| Add MUR to Watchlist: View: Get Complete MUR Trend Analysis ➞ | |
 | CVI CVR Energy, Inc. |
| Sector: Energy | |
| SubSector: Oil & Gas Refining & Marketing | |
| MarketCap: 2482.14 Millions | |
| Recent Price: 32.23 Smart Investing & Trading Score: 95 | |
| Day Percent Change: -0.8% Day Change: -0.26 | |
| Week Change: 7.94% Year-to-date Change: 72.0% | |
| CVI Links: Profile News Message Board | |
| Charts:- Daily , Weekly | |
| Add CVI to Watchlist: View: Get Complete CVI Trend Analysis ➞ | |
 | HAL Halliburton Company |
| Sector: Energy | |
| SubSector: Oil & Gas Equipment & Services | |
| MarketCap: 5419.41 Millions | |
| Recent Price: 23.08 Smart Investing & Trading Score: 100 | |
| Day Percent Change: 4.15% Day Change: 0.92 | |
| Week Change: 7.25% Year-to-date Change: -14.5% | |
| HAL Links: Profile News Message Board | |
| Charts:- Daily , Weekly | |
| Add HAL to Watchlist: View: Get Complete HAL Trend Analysis ➞ | |
 | ACDC ProFrac Holding Corp. |
| Sector: Energy | |
| SubSector: Oil & Gas Equipment & Services | |
| MarketCap: 1830 Millions | |
| Recent Price: 7.97 Smart Investing & Trading Score: 68 | |
| Day Percent Change: 1.27% Day Change: 0.1 | |
| Week Change: 7.12% Year-to-date Change: 2.7% | |
| ACDC Links: Profile News Message Board | |
| Charts:- Daily , Weekly | |
| Add ACDC to Watchlist: View: Get Complete ACDC Trend Analysis ➞ | |
 | HES Hess Corporation |
| Sector: Energy | |
| SubSector: Independent Oil & Gas | |
| MarketCap: 10465.3 Millions | |
| Recent Price: 153.22 Smart Investing & Trading Score: 100 | |
| Day Percent Change: 0.78% Day Change: 1.18 | |
| Week Change: 6.38% Year-to-date Change: 15.6% | |
| HES Links: Profile News Message Board | |
| Charts:- Daily , Weekly | |
| Add HES to Watchlist: View: Get Complete HES Trend Analysis ➞ | |
 | CNX CNX Resources Corporation |
| Sector: Energy | |
| SubSector: Independent Oil & Gas | |
| MarketCap: 1344.33 Millions | |
| Recent Price: 34.03 Smart Investing & Trading Score: 78 | |
| Day Percent Change: 2.1% Day Change: 0.7 | |
| Week Change: 6.28% Year-to-date Change: -7.2% | |
| CNX Links: Profile News Message Board | |
| Charts:- Daily , Weekly | |
| Add CNX to Watchlist: View: Get Complete CNX Trend Analysis ➞ | |
 | NE Noble Corporation Plc |
| Sector: Energy | |
| SubSector: Oil & Gas Drilling | |
| MarketCap: 5520 Millions | |
| Recent Price: 30.15 Smart Investing & Trading Score: 83 | |
| Day Percent Change: -2.11% Day Change: -0.65 | |
| Week Change: 6.16% Year-to-date Change: -1.9% | |
| NE Links: Profile News Message Board | |
| Charts:- Daily , Weekly | |
| Add NE to Watchlist: View: Get Complete NE Trend Analysis ➞ | |
 | VLO Valero Energy Corporation |
| Sector: Energy | |
| SubSector: Oil & Gas Refining & Marketing | |
| MarketCap: 19590.5 Millions | |
| Recent Price: 153.05 Smart Investing & Trading Score: 95 | |
| Day Percent Change: -1.14% Day Change: -1.76 | |
| Week Change: 5.86% Year-to-date Change: 25.9% | |
| VLO Links: Profile News Message Board | |
| Charts:- Daily , Weekly | |
| Add VLO to Watchlist: View: Get Complete VLO Trend Analysis ➞ | |
 | OXY Occidental Petroleum Corporation |
| Sector: Energy | |
| SubSector: Independent Oil & Gas | |
| MarketCap: 9152.73 Millions | |
| Recent Price: 46.31 Smart Investing & Trading Score: 100 | |
| Day Percent Change: 1% Day Change: 0.46 | |
| Week Change: 5.73% Year-to-date Change: -5.8% | |
| OXY Links: Profile News Message Board | |
| Charts:- Daily , Weekly | |
| Add OXY to Watchlist: View: Get Complete OXY Trend Analysis ➞ | |
 | TALO Talos Energy Inc. |
| Sector: Energy | |
| SubSector: Independent Oil & Gas | |
| MarketCap: 396.293 Millions | |
| Recent Price: 9.13 Smart Investing & Trading Score: 85 | |
| Day Percent Change: 1.11% Day Change: 0.1 | |
| Week Change: 5.31% Year-to-date Change: -6.0% | |
| TALO Links: Profile News Message Board | |
| Charts:- Daily , Weekly | |
| Add TALO to Watchlist: View: Get Complete TALO Trend Analysis ➞ | |
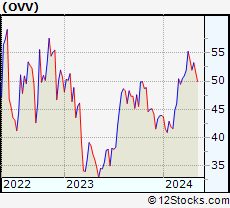 | OVV Ovintiv Inc. |
| Sector: Energy | |
| SubSector: Independent Oil & Gas | |
| MarketCap: 713.793 Millions | |
| Recent Price: 41.94 Smart Investing & Trading Score: 100 | |
| Day Percent Change: 2.52% Day Change: 1.03 | |
| Week Change: 5.06% Year-to-date Change: 4.4% | |
| OVV Links: Profile News Message Board | |
| Charts:- Daily , Weekly | |
| Add OVV to Watchlist: View: Get Complete OVV Trend Analysis ➞ | |
 | SDRL Seadrill Limited |
| Sector: Energy | |
| SubSector: Oil & Gas Drilling | |
| MarketCap: 3300 Millions | |
| Recent Price: 30.50 Smart Investing & Trading Score: 83 | |
| Day Percent Change: -1.36% Day Change: -0.42 | |
| Week Change: 4.77% Year-to-date Change: -21.7% | |
| SDRL Links: Profile News Message Board | |
| Charts:- Daily , Weekly | |
| Add SDRL to Watchlist: View: Get Complete SDRL Trend Analysis ➞ | |
 | CVX Chevron Corporation |
| Sector: Energy | |
| SubSector: Major Integrated Oil & Gas | |
| MarketCap: 121521 Millions | |
| Recent Price: 155.31 Smart Investing & Trading Score: 100 | |
| Day Percent Change: 0.74% Day Change: 1.14 | |
| Week Change: 4.68% Year-to-date Change: 8.4% | |
| CVX Links: Profile News Message Board | |
| Charts:- Daily , Weekly | |
| Add CVX to Watchlist: View: Get Complete CVX Trend Analysis ➞ | |
 | SLB Schlumberger Limited |
| Sector: Energy | |
| SubSector: Oil & Gas Equipment & Services | |
| MarketCap: 23892 Millions | |
| Recent Price: 37.31 Smart Investing & Trading Score: 100 | |
| Day Percent Change: 1.8% Day Change: 0.66 | |
| Week Change: 4.66% Year-to-date Change: -2.0% | |
| SLB Links: Profile News Message Board | |
| Charts:- Daily , Weekly | |
| Add SLB to Watchlist: View: Get Complete SLB Trend Analysis ➞ | |
 | CHRD Chord Energy Corporation |
| Sector: Energy | |
| SubSector: Oil & Gas E&P | |
| MarketCap: 6280 Millions | |
| Recent Price: 109.19 Smart Investing & Trading Score: 100 | |
| Day Percent Change: 1% Day Change: 1.08 | |
| Week Change: 4.6% Year-to-date Change: -5.4% | |
| CHRD Links: Profile News Message Board | |
| Charts:- Daily , Weekly | |
| Add CHRD to Watchlist: View: Get Complete CHRD Trend Analysis ➞ | |
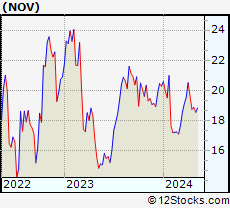 | NOV National Oilwell Varco, Inc. |
| Sector: Energy | |
| SubSector: Oil & Gas Equipment & Services | |
| MarketCap: 4737.41 Millions | |
| Recent Price: 13.68 Smart Investing & Trading Score: 100 | |
| Day Percent Change: -0.58% Day Change: -0.08 | |
| Week Change: 4.59% Year-to-date Change: -5.8% | |
| NOV Links: Profile News Message Board | |
| Charts:- Daily , Weekly | |
| Add NOV to Watchlist: View: Get Complete NOV Trend Analysis ➞ | |
| For tabular summary view of above stock list: Summary View ➞ 0 - 25 , 25 - 50 , 50 - 75 , 75 - 100 | ||
| Click To Change The Sort Order: By Market Cap or Company Size Performance: Year-to-date, Week and Day | |
| Select Chart Type: | ||
|
Best Stocks Today 12Stocks.com |
© 2025 12Stocks.com Terms & Conditions Privacy Contact Us
All Information Provided Only For Education And Not To Be Used For Investing or Trading. See Terms & Conditions


One More Thing ... Get Best Stocks Delivered Daily!
Never Ever Miss A Move With Our Top Ten Stocks Lists
Find Best Stocks In Any Market - Bull or Bear Market
Take A Peek At Our Top Ten Stocks Lists: Daily, Weekly, Year-to-Date & Top Trends
Find Best Stocks In Any Market - Bull or Bear Market
Take A Peek At Our Top Ten Stocks Lists: Daily, Weekly, Year-to-Date & Top Trends
Energy Stocks With Best Up Trends [0-bearish to 100-bullish]: NextDecade [100], Halliburton [100], PBF [100], Ovintiv [100], Schlumberger [100], Par Pacific[100], Occidental [100], Chord [100], Oceaneering [100], Murphy Oil[100], Hess [100]
Best Energy Stocks Year-to-Date:
Par Pacific[113.91%], CVR [71.99%], Delek US[45.85%], Genie [40.25%], NextDecade [39.69%], National Fuel[37.38%], Marathon [29.67%], Valero [25.87%], TechnipFMC [23.44%], Comstock Resources[22.94%], EQT [20.36%] Best Energy Stocks This Week:
PBF [18.88%], NextDecade [17.83%], Delek US[14.83%], Par Pacific[11.48%], SM [9.99%], Valaris [9.82%], Kosmos [9.6%], Nabors Industries[9.5%], Tidewater [9.35%], Murphy Oil[8.05%], CVR [7.94%] Best Energy Stocks Daily:
NextDecade [16.94%], Gulfport [4.84%], Halliburton [4.15%], Viper [3.91%], PBF [2.69%], Ovintiv [2.52%], CNX Resources[2.1%], Schlumberger [1.8%], W&T Offshore[1.69%], Range Resources[1.59%], EQT [1.49%]