
 Login Sign Up


| |||||
 |  | ||||

| 12Stocks.com Market Intelligence |
Best Energy Stocks
| In a hurry? Energy Stocks Lists: Performance Trends Table, Stock Charts
Sort Energy stocks: Daily, Weekly, Year-to-Date, Market Cap & Trends. Filter Energy stocks list by size: All Energy Large Mid-Range Small & MicroCap |
| 12Stocks.com Energy Stocks Performances & Trends Daily | |||||||||
|
|  The overall Smart Investing & Trading Score is 40 (0-bearish to 100-bullish) which puts Energy sector in short term bearish to neutral trend. The Smart Investing & Trading Score from previous trading session is 50 and hence a deterioration of trend.
| ||||||||
Here are the Smart Investing & Trading Scores of the most requested Energy stocks at 12Stocks.com (click stock name for detailed review):
|


| 12Stocks.com: Investing in Energy sector with Stocks | |
|
The following table helps investors and traders sort through current performance and trends (as measured by Smart Investing & Trading Score) of various
stocks in the Energy sector. Quick View: Move mouse or cursor over stock symbol (ticker) to view short-term Technical chart and over stock name to view long term chart. Click on  to add stock symbol to your watchlist and to add stock symbol to your watchlist and  to view watchlist. Click on any ticker or stock name for detailed market intelligence report for that stock. to view watchlist. Click on any ticker or stock name for detailed market intelligence report for that stock. |
12Stocks.com Performance of Stocks in Energy Sector
| Ticker | Stock Name | Watchlist | Category | Recent Price | Smart Investing & Trading Score | Change % | YTD Change% |
| NAT | Nordic American |   | Midstream | 3.33 | 80 | -0.60% | 37.27% |
| VLO | Valero | | Refining | 164.70 | 50 | -1.77% | 37.09% |
| DNN | Denison Mines | | Uranium | 2.77 | 60 | 0.00% | 33.17% |
| INSW | Seaways | | Midstream | 46.05 | 30 | -0.17% | 31.88% |
| E | Eni Spa | | Integrated | 34.73 | 30 | -0.94% | 30.67% |
| FTI | TechnipFMC | | Equipment | 38.42 | 30 | -3.37% | 30.37% |
| AM | Antero Midstream | | Midstream | 19.24 | 50 | -0.88% | 29.50% |
| TK | Teekay | | Midstream | 8.10 | 20 | -1.58% | 28.67% |
| TNK | Teekay Tankers | | Midstream | 50.14 | 30 | -1.76% | 25.74% |
| DHT | DHT | | Midstream | 11.74 | 20 | -0.93% | 25.27% |
| SBR | Sabine Royalty | | Midstream | 78.02 | 50 | -1.84% | 25.13% |
| TEN | Tsakos | | Midstream | 21.81 | 30 | -2.11% | 24.91% |
| EC | Ecopetrol SA | | Integrated | 9.07 | 40 | -1.52% | 22.48% |
| LPG | Dorian LPG | | Midstream | 28.80 | 20 | -0.79% | 21.76% |
| NXE | NexGen | | Uranium | 8.82 | 50 | -2.86% | 20.99% |
| PSX | Phillips 66 | | Refining | 134.94 | 50 | 0.26% | 20.15% |
| ENB | Enbridge | | Midstream | 49.70 | 40 | 0.22% | 19.14% |
| EQT | EQT Corp | | E&P | 55.76 | 80 | -0.71% | 18.82% |
| BKR | Baker Hughes | | Equipment | 48.40 | 50 | 0.08% | 18.39% |
| TRP | TC | | Midstream | 54.28 | 100 | 0.72% | 17.50% |
| WMB | Williams Cos | | Midstream | 64.06 | 80 | 0.58% | 16.64% |
| SU | Suncor | | Integrated | 41.11 | 40 | -0.36% | 16.64% |
| BP | BP | | Integrated | 33.86 | 30 | -1.74% | 16.58% |
| OIS | Oil States | | Equipment | 6.09 | 60 | -0.81% | 16.44% |
| NESR | National | | Equipment | 10.16 | 40 | -2.21% | 16.11% |
| For chart view version of above stock list: Chart View ➞ 0 - 25 , 25 - 50 , 50 - 75 , 75 - 100 , 100 - 125 , 125 - 150 , 150 - 175 , 175 - 200 , 200 - 225 , 225 - 250 , 250 - 275 , 275 - 300 , 300 - 325 | ||
 | Click To Change The Sort Order: By Market Cap or Company Size Performance: Year-to-date, Week and Day |  |
|
Get the most comprehensive stock market coverage daily at 12Stocks.com ➞ Best Stocks Today ➞ Best Stocks Weekly ➞ Best Stocks Year-to-Date ➞ Best Stocks Trends ➞  Best Stocks Today 12Stocks.com Best Nasdaq Stocks ➞ Best S&P 500 Stocks ➞ Best Tech Stocks ➞ Best Biotech Stocks ➞ |
| Detailed Overview of Energy Stocks |
| Energy Technical Overview, Leaders & Laggards, Top Energy ETF Funds & Detailed Energy Stocks List, Charts, Trends & More |
| Energy Sector: Technical Analysis, Trends & YTD Performance | |
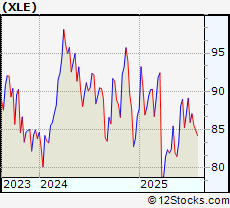
| Energy sector is composed of stocks
from oil production, refining, exploration, drilling
and services subsectors. Energy sector, as represented by XLE, an exchange-traded fund [ETF] that holds basket of Energy stocks (e.g, Exxon, Halliburton) is up by 3.68732% and is currently underperforming the overall market by -11.07058% year-to-date. Below is a quick view of Technical charts and trends: |
|
 XLE Weekly Chart |
|
| Long Term Trend: Very Good | |
| Medium Term Trend: Not Good | |
 XLE Daily Chart |
|
| Short Term Trend: Not Good | |
| Overall Trend Score: 40 | |
| YTD Performance: 3.68732% | |
| **Trend Scores & Views Are Only For Educational Purposes And Not For Investing | |
| 12Stocks.com: Top Performing Energy Sector Stocks | ||||||||||||||||||||||||||||||||||||||||||||||||
 The top performing Energy sector stocks year to date are
Now, more recently, over last week, the top performing Energy sector stocks on the move are


|
||||||||||||||||||||||||||||||||||||||||||||||||
| 12Stocks.com: Investing in Energy Sector using Exchange Traded Funds | |
|
The following table shows list of key exchange traded funds (ETF) that
help investors track Energy Index. For detailed view, check out our ETF Funds section of our website. Quick View: Move mouse or cursor over ETF symbol (ticker) to view short-term Technical chart and over ETF name to view long term chart. Click on ticker or stock name for detailed view. Click on to add stock symbol to your watchlist and to view watchlist. |
12Stocks.com List of ETFs that track Energy Index
| Ticker | ETF Name | Watchlist | Recent Price | Smart Investing & Trading Score | Change % | Week % | Year-to-date % |
| UHN | Diesel-Heating Oil | | 62.75 | 90 | 2.06571 | 216.44 | 0% |
| CHIE | China Energy | | 16.39 | 30 | 0 | 0 | 0% |
| 12Stocks.com: Charts, Trends, Fundamental Data and Performances of Energy Stocks | |
|
We now take in-depth look at all Energy stocks including charts, multi-period performances and overall trends (as measured by Smart Investing & Trading Score). One can sort Energy stocks (click link to choose) by Daily, Weekly and by Year-to-Date performances. Also, one can sort by size of the company or by market capitalization. |
| Select Your Default Chart Type: | |||||
| |||||
| Click on stock symbol or name for detailed view. Click on to add stock symbol to your watchlist and to view watchlist. Quick View: Move mouse or cursor over "Daily" to quickly view daily Technical stock chart and over "Weekly" to view weekly Technical stock chart. | |||||

 | NAT Nordic American Tankers Ltd |
| Sector: Energy | |
| SubSector: Oil & Gas Midstream | |
| MarketCap: 692.42 Millions | |
| Recent Price: 3.33 Smart Investing & Trading Score: 80 | |
| Day Percent Change: -0.597015% Day Change: 0.14 | |
| Week Change: 0.909091% Year-to-date Change: 37.3% | |
| NAT Links: Profile News Message Board | |
| Charts:- Daily , Weekly | |
| Add NAT to Watchlist: View: Get Complete NAT Trend Analysis ➞ | |
 | VLO Valero Energy Corp |
| Sector: Energy | |
| SubSector: Oil & Gas Refining & Marketing | |
| MarketCap: 48700.9 Millions | |
| Recent Price: 164.70 Smart Investing & Trading Score: 50 | |
| Day Percent Change: -1.77134% Day Change: -2.72 | |
| Week Change: -3.58836% Year-to-date Change: 37.1% | |
| VLO Links: Profile News Message Board | |
| Charts:- Daily , Weekly | |
| Add VLO to Watchlist: View: Get Complete VLO Trend Analysis ➞ | |
 | DNN Denison Mines Corp |
| Sector: Energy | |
| SubSector: Uranium | |
| MarketCap: 2106.89 Millions | |
| Recent Price: 2.77 Smart Investing & Trading Score: 60 | |
| Day Percent Change: 0% Day Change: 0.03 | |
| Week Change: 0.727273% Year-to-date Change: 33.2% | |
| DNN Links: Profile News Message Board | |
| Charts:- Daily , Weekly | |
| Add DNN to Watchlist: View: Get Complete DNN Trend Analysis ➞ | |
 | INSW International Seaways Inc |
| Sector: Energy | |
| SubSector: Oil & Gas Midstream | |
| MarketCap: 2309.85 Millions | |
| Recent Price: 46.05 Smart Investing & Trading Score: 30 | |
| Day Percent Change: -0.173423% Day Change: 2.26 | |
| Week Change: -3.11382% Year-to-date Change: 31.9% | |
| INSW Links: Profile News Message Board | |
| Charts:- Daily , Weekly | |
| Add INSW to Watchlist: View: Get Complete INSW Trend Analysis ➞ | |
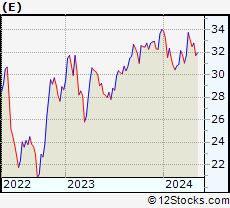 | E Eni Spa ADR |
| Sector: Energy | |
| SubSector: Oil & Gas Integrated | |
| MarketCap: 50306.8 Millions | |
| Recent Price: 34.73 Smart Investing & Trading Score: 30 | |
| Day Percent Change: -0.941244% Day Change: -0.29 | |
| Week Change: -2.14145% Year-to-date Change: 30.7% | |
| E Links: Profile News Message Board | |
| Charts:- Daily , Weekly | |
| Add E to Watchlist: View: Get Complete E Trend Analysis ➞ | |
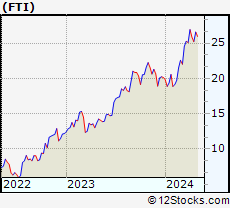 | FTI TechnipFMC plc |
| Sector: Energy | |
| SubSector: Oil & Gas Equipment & Services | |
| MarketCap: 15988.5 Millions | |
| Recent Price: 38.42 Smart Investing & Trading Score: 30 | |
| Day Percent Change: -3.37022% Day Change: -1.07 | |
| Week Change: -2.83257% Year-to-date Change: 30.4% | |
| FTI Links: Profile News Message Board | |
| Charts:- Daily , Weekly | |
| Add FTI to Watchlist: View: Get Complete FTI Trend Analysis ➞ | |
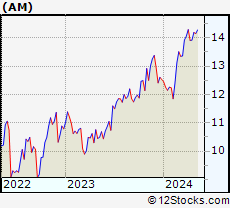 | AM Antero Midstream Corp |
| Sector: Energy | |
| SubSector: Oil & Gas Midstream | |
| MarketCap: 8732.64 Millions | |
| Recent Price: 19.24 Smart Investing & Trading Score: 50 | |
| Day Percent Change: -0.875837% Day Change: -0.11 | |
| Week Change: -1.13052% Year-to-date Change: 29.5% | |
| AM Links: Profile News Message Board | |
| Charts:- Daily , Weekly | |
| Add AM to Watchlist: View: Get Complete AM Trend Analysis ➞ | |
 | TK Teekay Corporation Ltd |
| Sector: Energy | |
| SubSector: Oil & Gas Midstream | |
| MarketCap: 717.97 Millions | |
| Recent Price: 8.10 Smart Investing & Trading Score: 20 | |
| Day Percent Change: -1.57959% Day Change: 0.47 | |
| Week Change: -6.89655% Year-to-date Change: 28.7% | |
| TK Links: Profile News Message Board | |
| Charts:- Daily , Weekly | |
| Add TK to Watchlist: View: Get Complete TK Trend Analysis ➞ | |
 | TNK Teekay Tankers Ltd |
| Sector: Energy | |
| SubSector: Oil & Gas Midstream | |
| MarketCap: 1800.16 Millions | |
| Recent Price: 50.14 Smart Investing & Trading Score: 30 | |
| Day Percent Change: -1.76332% Day Change: 3.24 | |
| Week Change: -6.62942% Year-to-date Change: 25.7% | |
| TNK Links: Profile News Message Board | |
| Charts:- Daily , Weekly | |
| Add TNK to Watchlist: View: Get Complete TNK Trend Analysis ➞ | |
 | DHT DHT Holdings Inc |
| Sector: Energy | |
| SubSector: Oil & Gas Midstream | |
| MarketCap: 2000.55 Millions | |
| Recent Price: 11.74 Smart Investing & Trading Score: 20 | |
| Day Percent Change: -0.92827% Day Change: 0.46 | |
| Week Change: -6.67727% Year-to-date Change: 25.3% | |
| DHT Links: Profile News Message Board | |
| Charts:- Daily , Weekly | |
| Add DHT to Watchlist: View: Get Complete DHT Trend Analysis ➞ | |
 | SBR Sabine Royalty Trust |
| Sector: Energy | |
| SubSector: Oil & Gas Midstream | |
| MarketCap: 1084.56 Millions | |
| Recent Price: 78.02 Smart Investing & Trading Score: 50 | |
| Day Percent Change: -1.83694% Day Change: -0.11 | |
| Week Change: -3.35687% Year-to-date Change: 25.1% | |
| SBR Links: Profile News Message Board | |
| Charts:- Daily , Weekly | |
| Add SBR to Watchlist: View: Get Complete SBR Trend Analysis ➞ | |
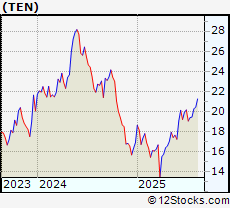 | TEN Tsakos Energy Navigation Limited |
| Sector: Energy | |
| SubSector: Oil & Gas Midstream | |
| MarketCap: 669.44 Millions | |
| Recent Price: 21.81 Smart Investing & Trading Score: 30 | |
| Day Percent Change: -2.10952% Day Change: 0.98 | |
| Week Change: -5.99138% Year-to-date Change: 24.9% | |
| TEN Links: Profile News Message Board | |
| Charts:- Daily , Weekly | |
| Add TEN to Watchlist: View: Get Complete TEN Trend Analysis ➞ | |
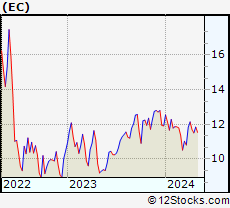 | EC Ecopetrol SA ADR |
| Sector: Energy | |
| SubSector: Oil & Gas Integrated | |
| MarketCap: 18667 Millions | |
| Recent Price: 9.07 Smart Investing & Trading Score: 40 | |
| Day Percent Change: -1.52009% Day Change: -0.26 | |
| Week Change: -5.81516% Year-to-date Change: 22.5% | |
| EC Links: Profile News Message Board | |
| Charts:- Daily , Weekly | |
| Add EC to Watchlist: View: Get Complete EC Trend Analysis ➞ | |
 | LPG Dorian LPG Ltd |
| Sector: Energy | |
| SubSector: Oil & Gas Midstream | |
| MarketCap: 1325.92 Millions | |
| Recent Price: 28.80 Smart Investing & Trading Score: 20 | |
| Day Percent Change: -0.792284% Day Change: 0.75 | |
| Week Change: -9.60452% Year-to-date Change: 21.8% | |
| LPG Links: Profile News Message Board | |
| Charts:- Daily , Weekly | |
| Add LPG to Watchlist: View: Get Complete LPG Trend Analysis ➞ | |
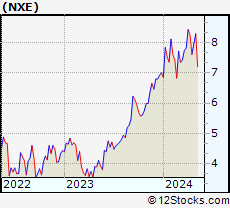 | NXE NexGen Energy Ltd |
| Sector: Energy | |
| SubSector: Uranium | |
| MarketCap: 4455.52 Millions | |
| Recent Price: 8.82 Smart Investing & Trading Score: 50 | |
| Day Percent Change: -2.86344% Day Change: 0.13 | |
| Week Change: 1.6129% Year-to-date Change: 21.0% | |
| NXE Links: Profile News Message Board | |
| Charts:- Daily , Weekly | |
| Add NXE to Watchlist: View: Get Complete NXE Trend Analysis ➞ | |
 | PSX Phillips 66 |
| Sector: Energy | |
| SubSector: Oil & Gas Refining & Marketing | |
| MarketCap: 53162.5 Millions | |
| Recent Price: 134.94 Smart Investing & Trading Score: 50 | |
| Day Percent Change: 0.260049% Day Change: 0.64 | |
| Week Change: -1.20799% Year-to-date Change: 20.2% | |
| PSX Links: Profile News Message Board | |
| Charts:- Daily , Weekly | |
| Add PSX to Watchlist: View: Get Complete PSX Trend Analysis ➞ | |
 | ENB Enbridge Inc |
| Sector: Energy | |
| SubSector: Oil & Gas Midstream | |
| MarketCap: 105232 Millions | |
| Recent Price: 49.70 Smart Investing & Trading Score: 40 | |
| Day Percent Change: 0.221819% Day Change: 0.05 | |
| Week Change: -0.560224% Year-to-date Change: 19.1% | |
| ENB Links: Profile News Message Board | |
| Charts:- Daily , Weekly | |
| Add ENB to Watchlist: View: Get Complete ENB Trend Analysis ➞ | |
 | EQT EQT Corp |
| Sector: Energy | |
| SubSector: Oil & Gas E&P | |
| MarketCap: 32201.7 Millions | |
| Recent Price: 55.76 Smart Investing & Trading Score: 80 | |
| Day Percent Change: -0.712251% Day Change: -0.38 | |
| Week Change: 5.04898% Year-to-date Change: 18.8% | |
| EQT Links: Profile News Message Board | |
| Charts:- Daily , Weekly | |
| Add EQT to Watchlist: View: Get Complete EQT Trend Analysis ➞ | |
 | BKR Baker Hughes Co |
| Sector: Energy | |
| SubSector: Oil & Gas Equipment & Services | |
| MarketCap: 44936.4 Millions | |
| Recent Price: 48.40 Smart Investing & Trading Score: 50 | |
| Day Percent Change: 0.082713% Day Change: 0.08 | |
| Week Change: -2.94766% Year-to-date Change: 18.4% | |
| BKR Links: Profile News Message Board | |
| Charts:- Daily , Weekly | |
| Add BKR to Watchlist: View: Get Complete BKR Trend Analysis ➞ | |
 | TRP TC Energy Corporation |
| Sector: Energy | |
| SubSector: Oil & Gas Midstream | |
| MarketCap: 53934.4 Millions | |
| Recent Price: 54.28 Smart Investing & Trading Score: 100 | |
| Day Percent Change: 0.723696% Day Change: 0.21 | |
| Week Change: 1.36321% Year-to-date Change: 17.5% | |
| TRP Links: Profile News Message Board | |
| Charts:- Daily , Weekly | |
| Add TRP to Watchlist: View: Get Complete TRP Trend Analysis ➞ | |
 | WMB Williams Cos Inc |
| Sector: Energy | |
| SubSector: Oil & Gas Midstream | |
| MarketCap: 69851.4 Millions | |
| Recent Price: 64.06 Smart Investing & Trading Score: 80 | |
| Day Percent Change: 0.580939% Day Change: 0.38 | |
| Week Change: 1.909% Year-to-date Change: 16.6% | |
| WMB Links: Profile News Message Board | |
| Charts:- Daily , Weekly | |
| Add WMB to Watchlist: View: Get Complete WMB Trend Analysis ➞ | |
 | SU Suncor Energy, Inc |
| Sector: Energy | |
| SubSector: Oil & Gas Integrated | |
| MarketCap: 48493.6 Millions | |
| Recent Price: 41.11 Smart Investing & Trading Score: 40 | |
| Day Percent Change: -0.363548% Day Change: -0.07 | |
| Week Change: -3.06531% Year-to-date Change: 16.6% | |
| SU Links: Profile News Message Board | |
| Charts:- Daily , Weekly | |
| Add SU to Watchlist: View: Get Complete SU Trend Analysis ➞ | |
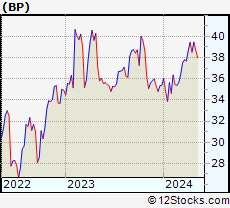 | BP BP plc ADR |
| Sector: Energy | |
| SubSector: Oil & Gas Integrated | |
| MarketCap: 87465.1 Millions | |
| Recent Price: 33.86 Smart Investing & Trading Score: 30 | |
| Day Percent Change: -1.74115% Day Change: -0.42 | |
| Week Change: -3.83414% Year-to-date Change: 16.6% | |
| BP Links: Profile News Message Board | |
| Charts:- Daily , Weekly | |
| Add BP to Watchlist: View: Get Complete BP Trend Analysis ➞ | |
 | OIS Oil States International, Inc |
| Sector: Energy | |
| SubSector: Oil & Gas Equipment & Services | |
| MarketCap: 333.87 Millions | |
| Recent Price: 6.09 Smart Investing & Trading Score: 60 | |
| Day Percent Change: -0.814332% Day Change: 0.12 | |
| Week Change: -0.327332% Year-to-date Change: 16.4% | |
| OIS Links: Profile News Message Board | |
| Charts:- Daily , Weekly | |
| Add OIS to Watchlist: View: Get Complete OIS Trend Analysis ➞ | |
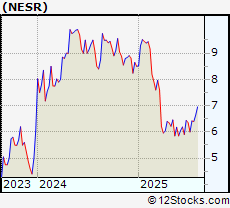 | NESR National Energy Services Reunited Corp |
| Sector: Energy | |
| SubSector: Oil & Gas Equipment & Services | |
| MarketCap: 919.2 Millions | |
| Recent Price: 10.16 Smart Investing & Trading Score: 40 | |
| Day Percent Change: -2.21367% Day Change: 0.22 | |
| Week Change: -3.05344% Year-to-date Change: 16.1% | |
| NESR Links: Profile News Message Board | |
| Charts:- Daily , Weekly | |
| Add NESR to Watchlist: View: Get Complete NESR Trend Analysis ➞ | |
| For tabular summary view of above stock list: Summary View ➞ 0 - 25 , 25 - 50 , 50 - 75 , 75 - 100 , 100 - 125 , 125 - 150 , 150 - 175 , 175 - 200 , 200 - 225 , 225 - 250 , 250 - 275 , 275 - 300 , 300 - 325 | ||
| Click To Change The Sort Order: By Market Cap or Company Size Performance: Year-to-date, Week and Day | |
| Select Chart Type: | ||
|
Best Stocks Today 12Stocks.com |
© 2025 12Stocks.com Terms & Conditions Privacy Contact Us
All Information Provided Only For Education And Not To Be Used For Investing or Trading. See Terms & Conditions


One More Thing ... Get Best Stocks Delivered Daily!
Never Ever Miss A Move With Our Top Ten Stocks Lists
Find Best Stocks In Any Market - Bull or Bear Market
Take A Peek At Our Top Ten Stocks Lists: Daily, Weekly, Year-to-Date & Top Trends
Find Best Stocks In Any Market - Bull or Bear Market
Take A Peek At Our Top Ten Stocks Lists: Daily, Weekly, Year-to-Date & Top Trends
Energy Stocks With Best Up Trends [0-bearish to 100-bullish]: Fuels[100], Centrus [100], Peabody [100], Denbury Resources[100], Centennial Resource[100], Stone [100], Bellatrix Exploration[100], Alon USA[100], Seadrill Partners[100], Weatherford [100], Crescent Point[100]
Best Energy Stocks Year-to-Date:
Centrus [370.828%], Fuels[196.567%], CVR [121.546%], Par Pacific[110.905%], Geospace Technologies[97.4155%], Dominion Midstream[84.3866%], Delek US[83.0509%], Uranium [79.5276%], NCS Multistage[65.4577%], Flotek Industries[65%], Cameco Corp[61.4264%] Best Energy Stocks This Week:
CNOOC [137266%], Parker Drilling[36988.9%], Crescent Point[4066.17%], Spectra [2373.97%], Sinopec Shanghai[1992.58%], Shell Midstream[1402.59%], PetroChina [1137.09%], China [1104.2%], Enable Midstream[966.906%], Alon USA[959.753%], NuStar GP[933.475%] Best Energy Stocks Daily:
USD Partners[33.3333%], CVR Refining[14.734%], Fuels[7.2247%], Gastar Exploration[6.84211%], Halcon Resources[6.19469%], Renewable [5.73556%], Uranium [5.31178%], Centrus [5.29673%], Parker Drilling[3.72902%], Seacor [3.65812%], Peabody [3.64215%]