
 Login Sign Up


| |||||
 |  | ||||

| 12Stocks.com Market Intelligence |
Best Energy Stocks
| In a hurry? Energy Stocks Lists: Performance Trends Table, Stock Charts
Sort Energy stocks: Daily, Weekly, Year-to-Date, Market Cap & Trends. Filter Energy stocks list by size: All Energy Large Mid-Range Small & MicroCap |
| 12Stocks.com Energy Stocks Performances & Trends Daily | |||||||||
|
|  The overall Smart Investing & Trading Score is 30 (0-bearish to 100-bullish) which puts Energy sector in short term bearish to neutral trend. The Smart Investing & Trading Score from previous trading session is 70 and hence a deterioration of trend.
| ||||||||
Here are the Smart Investing & Trading Scores of the most requested Energy stocks at 12Stocks.com (click stock name for detailed review):
|


| 12Stocks.com: Investing in Energy sector with Stocks | |
|
The following table helps investors and traders sort through current performance and trends (as measured by Smart Investing & Trading Score) of various
stocks in the Energy sector. Quick View: Move mouse or cursor over stock symbol (ticker) to view short-term Technical chart and over stock name to view long term chart. Click on  to add stock symbol to your watchlist and to add stock symbol to your watchlist and  to view watchlist. Click on any ticker or stock name for detailed market intelligence report for that stock. to view watchlist. Click on any ticker or stock name for detailed market intelligence report for that stock. |
12Stocks.com Performance of Stocks in Energy Sector
| Ticker | Stock Name | Watchlist | Category | Recent Price | Smart Investing & Trading Score | Change % | YTD Change% |
| PWE | Penn West |   | Drilling & Exploration | 1.26 | 10 | 0.00 | 0.00% |
| BTE | Baytex | | E&P | 2.38 | 100 | 0.00 | -8.75% |
| EXXI | XXI | | Independent | 3.88 | 10 | 0.00 | 0.00% |
| TLLP | Tesoro Logistics | | Equipment | 52.13 | 10 | 0.00 | 0.00% |
| ESTE | Earthstone | | Independent | 13.00 | 10 | 0.00 | 0.00% |
| EQM | EQM Midstream | | Pipelines | 10.28 | 0 | 0.00 | 0.00% |
| NDRO | Enduro Royalty | | Independent | 3.65 | 20 | 0.00 | 0.00% |
| BCEI | Bonanza Creek | | Independent | 56.10 | 30 | 0.00 | 0.00% |
| HFC | HollyFrontier | | Refining | 36.39 | 60 | 0.00 | 0.00% |
| JONE | Jones | | Independent | 22.75 | 50 | 0.00 | 0.00% |
| SRLP | Sprague Resources | | Refining | 20.00 | 30 | 0.00 | 0.00% |
| PSXP | Phillips 66 | | Refining | 42.01 | 30 | 0.00 | 0.00% |
| TEGP | Tallgrass | | Pipelines | 22.16 | 30 | 0.00 | 0.00% |
| CNNX | CONE Midstream | | Pipelines | 17.15 | 20 | 0.00 | 0.00% |
| EXTN | Exterran | | Equipment | 4.58 | 20 | 0.00 | 0.00% |
| NEX | NexTier Oilfield | | Equipment | 10.61 | 30 | 0.00 | 0.00% |
| ALTM | Altus Midstream | | Independent | 5.84 | 40 | 0.00 | 13.18% |
| OMP | Oasis Midstream | | Independent | 23.86 | 20 | 0.00 | 0.00% |
| BPMP | BP Midstream | | Independent | 17.11 | 20 | 0.00 | 0.00% |
| AESI | Atlas | | Equipment | 10.80 | 46 | 0.00 | -47.66% |
| GPOR | Gulfport | | E&P | 174.00 | 60 | -0.01 | -5.38% |
| DTM | DT Midstream | | Midstream | 107.32 | 70 | -0.02 | 7.21% |
| BHI | Baker Hughes | | Equipment | 31.75 | 60 | -0.03 | 0.00% |
| NFG | National Fuel | | Integrated | 88.19 | 80 | -0.03 | 27.56% |
| WES | Western Midstream | | Midstream | 38.35 | 40 | -0.05 | 4.64% |
| For chart view version of above stock list: Chart View ➞ 0 - 25 , 25 - 50 , 50 - 75 , 75 - 100 , 100 - 125 , 125 - 150 , 150 - 175 , 175 - 200 , 200 - 225 , 225 - 250 , 250 - 275 , 275 - 300 , 300 - 325 | ||
 | Click To Change The Sort Order: By Market Cap or Company Size Performance: Year-to-date, Week and Day |  |
|
Get the most comprehensive stock market coverage daily at 12Stocks.com ➞ Best Stocks Today ➞ Best Stocks Weekly ➞ Best Stocks Year-to-Date ➞ Best Stocks Trends ➞  Best Stocks Today 12Stocks.com Best Nasdaq Stocks ➞ Best S&P 500 Stocks ➞ Best Tech Stocks ➞ Best Biotech Stocks ➞ |
| Detailed Overview of Energy Stocks |
| Energy Technical Overview, Leaders & Laggards, Top Energy ETF Funds & Detailed Energy Stocks List, Charts, Trends & More |
| Energy Sector: Technical Analysis, Trends & YTD Performance | |
| Energy sector is composed of stocks
from oil production, refining, exploration, drilling
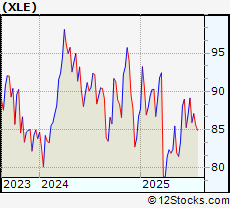
and services subsectors. Energy sector, as represented by XLE, an exchange-traded fund [ETF] that holds basket of Energy stocks (e.g, Exxon, Halliburton) is up by 3.6756% and is currently underperforming the overall market by -9.6834% year-to-date. Below is a quick view of Technical charts and trends: |
|
 XLE Weekly Chart |
|
| Long Term Trend: Very Good | |
| Medium Term Trend: Not Good | |
 XLE Daily Chart |
|
| Short Term Trend: Not Good | |
| Overall Trend Score: 30 | |
| YTD Performance: 3.6756% | |
| **Trend Scores & Views Are Only For Educational Purposes And Not For Investing | |
| 12Stocks.com: Top Performing Energy Sector Stocks | ||||||||||||||||||||||||||||||||||||||||||||||||
 The top performing Energy sector stocks year to date are
Now, more recently, over last week, the top performing Energy sector stocks on the move are


|
||||||||||||||||||||||||||||||||||||||||||||||||
| 12Stocks.com: Investing in Energy Sector using Exchange Traded Funds | |
|
The following table shows list of key exchange traded funds (ETF) that
help investors track Energy Index. For detailed view, check out our ETF Funds section of our website. Quick View: Move mouse or cursor over ETF symbol (ticker) to view short-term Technical chart and over ETF name to view long term chart. Click on ticker or stock name for detailed view. Click on to add stock symbol to your watchlist and to view watchlist. |
12Stocks.com List of ETFs that track Energy Index
| Ticker | ETF Name | Watchlist | Recent Price | Smart Investing & Trading Score | Change % | Week % | Year-to-date % |
| UHN | Diesel-Heating Oil | | 62.75 | 90 | 2.06571 | 216.44 | 0% |
| CHIE | China Energy | | 16.39 | 30 | 0 | 0 | 0% |
| 12Stocks.com: Charts, Trends, Fundamental Data and Performances of Energy Stocks | |
|
We now take in-depth look at all Energy stocks including charts, multi-period performances and overall trends (as measured by Smart Investing & Trading Score). One can sort Energy stocks (click link to choose) by Daily, Weekly and by Year-to-Date performances. Also, one can sort by size of the company or by market capitalization. |
| Select Your Default Chart Type: | |||||
| |||||
| Click on stock symbol or name for detailed view. Click on to add stock symbol to your watchlist and to view watchlist. Quick View: Move mouse or cursor over "Daily" to quickly view daily Technical stock chart and over "Weekly" to view weekly Technical stock chart. | |||||

 | PWE Penn West Petroleum Ltd. |
| Sector: Energy | |
| SubSector: Oil & Gas Drilling & Exploration | |
| MarketCap: 818.85 Millions | |
| Recent Price: 1.26 Smart Investing & Trading Score: 10 | |
| Day Percent Change: 0% Day Change: -9999 | |
| Week Change: 0% Year-to-date Change: 0.0% | |
| PWE Links: Profile News Message Board | |
| Charts:- Daily , Weekly | |
| Add PWE to Watchlist: View: Get Complete PWE Trend Analysis ➞ | |
 | BTE Baytex Energy Corp |
| Sector: Energy | |
| SubSector: Oil & Gas E&P | |
| MarketCap: 1674.89 Millions | |
| Recent Price: 2.38 Smart Investing & Trading Score: 100 | |
| Day Percent Change: 0% Day Change: 0.04 | |
| Week Change: 5.30973% Year-to-date Change: -8.7% | |
| BTE Links: Profile News Message Board | |
| Charts:- Daily , Weekly | |
| Add BTE to Watchlist: View: Get Complete BTE Trend Analysis ➞ | |
 | EXXI Energy XXI Gulf Coast, Inc. |
| Sector: Energy | |
| SubSector: Independent Oil & Gas | |
| MarketCap: 959.82 Millions | |
| Recent Price: 3.88 Smart Investing & Trading Score: 10 | |
| Day Percent Change: 0% Day Change: -9999 | |
| Week Change: 0% Year-to-date Change: 0.0% | |
| EXXI Links: Profile News Message Board | |
| Charts:- Daily , Weekly | |
| Add EXXI to Watchlist: View: Get Complete EXXI Trend Analysis ➞ | |
 | TLLP Tesoro Logistics LP |
| Sector: Energy | |
| SubSector: Oil & Gas Equipment & Services | |
| MarketCap: 5899.12 Millions | |
| Recent Price: 52.13 Smart Investing & Trading Score: 10 | |
| Day Percent Change: 0% Day Change: -9999 | |
| Week Change: 0% Year-to-date Change: 0.0% | |
| TLLP Links: Profile News Message Board | |
| Charts:- Daily , Weekly | |
| Add TLLP to Watchlist: View: Get Complete TLLP Trend Analysis ➞ | |
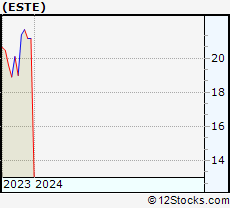 | ESTE Earthstone Energy, Inc. |
| Sector: Energy | |
| SubSector: Independent Oil & Gas | |
| MarketCap: 149.693 Millions | |
| Recent Price: 13.00 Smart Investing & Trading Score: 10 | |
| Day Percent Change: 0% Day Change: -9999 | |
| Week Change: -38.5923% Year-to-date Change: 0.0% | |
| ESTE Links: Profile News Message Board | |
| Charts:- Daily , Weekly | |
| Add ESTE to Watchlist: View: Get Complete ESTE Trend Analysis ➞ | |
 | EQM EQM Midstream Partners, LP |
| Sector: Energy | |
| SubSector: Oil & Gas Pipelines | |
| MarketCap: 3373.05 Millions | |
| Recent Price: 10.28 Smart Investing & Trading Score: 0 | |
| Day Percent Change: 0% Day Change: -9999 | |
| Week Change: -44.8202% Year-to-date Change: 0.0% | |
| EQM Links: Profile News Message Board | |
| Charts:- Daily , Weekly | |
| Add EQM to Watchlist: View: Get Complete EQM Trend Analysis ➞ | |
 | NDRO Enduro Royalty Trust |
| Sector: Energy | |
| SubSector: Independent Oil & Gas | |
| MarketCap: 108.9 Millions | |
| Recent Price: 3.65 Smart Investing & Trading Score: 20 | |
| Day Percent Change: 0% Day Change: -9999 | |
| Week Change: 0% Year-to-date Change: 0.0% | |
| NDRO Links: Profile News Message Board | |
| Charts:- Daily , Weekly | |
| Add NDRO to Watchlist: View: Get Complete NDRO Trend Analysis ➞ | |
 | BCEI Bonanza Creek Energy, Inc. |
| Sector: Energy | |
| SubSector: Independent Oil & Gas | |
| MarketCap: 226.893 Millions | |
| Recent Price: 56.10 Smart Investing & Trading Score: 30 | |
| Day Percent Change: 0% Day Change: -9999 | |
| Week Change: 3.27688% Year-to-date Change: 0.0% | |
| BCEI Links: Profile News Message Board | |
| Charts:- Daily , Weekly | |
| Add BCEI to Watchlist: View: Get Complete BCEI Trend Analysis ➞ | |
 | HFC HollyFrontier Corporation |
| Sector: Energy | |
| SubSector: Oil & Gas Refining & Marketing | |
| MarketCap: 4103.74 Millions | |
| Recent Price: 36.39 Smart Investing & Trading Score: 60 | |
| Day Percent Change: 0% Day Change: -9999 | |
| Week Change: 24.0286% Year-to-date Change: 0.0% | |
| HFC Links: Profile News Message Board | |
| Charts:- Daily , Weekly | |
| Add HFC to Watchlist: View: Get Complete HFC Trend Analysis ➞ | |
 | JONE Jones Energy, Inc. |
| Sector: Energy | |
| SubSector: Independent Oil & Gas | |
| MarketCap: 217.1 Millions | |
| Recent Price: 22.75 Smart Investing & Trading Score: 50 | |
| Day Percent Change: 0% Day Change: -9999 | |
| Week Change: 55.7153% Year-to-date Change: 0.0% | |
| JONE Links: Profile News Message Board | |
| Charts:- Daily , Weekly | |
| Add JONE to Watchlist: View: Get Complete JONE Trend Analysis ➞ | |
 | SRLP Sprague Resources LP |
| Sector: Energy | |
| SubSector: Oil & Gas Refining & Marketing | |
| MarketCap: 276.654 Millions | |
| Recent Price: 20.00 Smart Investing & Trading Score: 30 | |
| Day Percent Change: 0% Day Change: -9999 | |
| Week Change: 0% Year-to-date Change: 0.0% | |
| SRLP Links: Profile News Message Board | |
| Charts:- Daily , Weekly | |
| Add SRLP to Watchlist: View: Get Complete SRLP Trend Analysis ➞ | |
 | PSXP Phillips 66 Partners LP |
| Sector: Energy | |
| SubSector: Oil & Gas Refining & Marketing | |
| MarketCap: 9599.54 Millions | |
| Recent Price: 42.01 Smart Investing & Trading Score: 30 | |
| Day Percent Change: 0% Day Change: -9999 | |
| Week Change: 2.21411% Year-to-date Change: 0.0% | |
| PSXP Links: Profile News Message Board | |
| Charts:- Daily , Weekly | |
| Add PSXP to Watchlist: View: Get Complete PSXP Trend Analysis ➞ | |
 | TEGP Tallgrass Energy GP, LP |
| Sector: Energy | |
| SubSector: Oil & Gas Pipelines | |
| MarketCap: 4358.57 Millions | |
| Recent Price: 22.16 Smart Investing & Trading Score: 30 | |
| Day Percent Change: 0% Day Change: -9999 | |
| Week Change: 0% Year-to-date Change: 0.0% | |
| TEGP Links: Profile News Message Board | |
| Charts:- Daily , Weekly | |
| Add TEGP to Watchlist: View: Get Complete TEGP Trend Analysis ➞ | |
 | CNNX CONE Midstream Partners LP |
| Sector: Energy | |
| SubSector: Oil & Gas Pipelines | |
| MarketCap: 1417.63 Millions | |
| Recent Price: 17.15 Smart Investing & Trading Score: 20 | |
| Day Percent Change: 0% Day Change: -9999 | |
| Week Change: 0% Year-to-date Change: 0.0% | |
| CNNX Links: Profile News Message Board | |
| Charts:- Daily , Weekly | |
| Add CNNX to Watchlist: View: Get Complete CNNX Trend Analysis ➞ | |
 | EXTN Exterran Corporation |
| Sector: Energy | |
| SubSector: Oil & Gas Equipment & Services | |
| MarketCap: 163.761 Millions | |
| Recent Price: 4.58 Smart Investing & Trading Score: 20 | |
| Day Percent Change: 0% Day Change: -9999 | |
| Week Change: 0% Year-to-date Change: 0.0% | |
| EXTN Links: Profile News Message Board | |
| Charts:- Daily , Weekly | |
| Add EXTN to Watchlist: View: Get Complete EXTN Trend Analysis ➞ | |
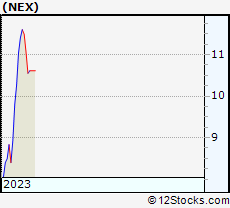 | NEX NexTier Oilfield Solutions Inc. |
| Sector: Energy | |
| SubSector: Oil & Gas Equipment & Services | |
| MarketCap: 303.361 Millions | |
| Recent Price: 10.61 Smart Investing & Trading Score: 30 | |
| Day Percent Change: 0% Day Change: -9999 | |
| Week Change: 0% Year-to-date Change: 0.0% | |
| NEX Links: Profile News Message Board | |
| Charts:- Daily , Weekly | |
| Add NEX to Watchlist: View: Get Complete NEX Trend Analysis ➞ | |
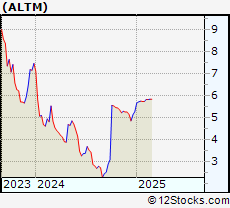 | ALTM Altus Midstream Company |
| Sector: Energy | |
| SubSector: Independent Oil & Gas | |
| MarketCap: 289.593 Millions | |
| Recent Price: 5.84 Smart Investing & Trading Score: 40 | |
| Day Percent Change: 0% Day Change: -9999 | |
| Week Change: 0.343643% Year-to-date Change: 13.2% | |
| ALTM Links: Profile News Message Board | |
| Charts:- Daily , Weekly | |
| Add ALTM to Watchlist: View: Get Complete ALTM Trend Analysis ➞ | |
 | OMP Oasis Midstream Partners LP |
| Sector: Energy | |
| SubSector: Independent Oil & Gas | |
| MarketCap: 189.693 Millions | |
| Recent Price: 23.86 Smart Investing & Trading Score: 20 | |
| Day Percent Change: 0% Day Change: -9999 | |
| Week Change: 0% Year-to-date Change: 0.0% | |
| OMP Links: Profile News Message Board | |
| Charts:- Daily , Weekly | |
| Add OMP to Watchlist: View: Get Complete OMP Trend Analysis ➞ | |
 | BPMP BP Midstream Partners LP |
| Sector: Energy | |
| SubSector: Independent Oil & Gas | |
| MarketCap: 972.993 Millions | |
| Recent Price: 17.11 Smart Investing & Trading Score: 20 | |
| Day Percent Change: 0% Day Change: -9999 | |
| Week Change: -0.465387% Year-to-date Change: 0.0% | |
| BPMP Links: Profile News Message Board | |
| Charts:- Daily , Weekly | |
| Add BPMP to Watchlist: View: Get Complete BPMP Trend Analysis ➞ | |
 | AESI Atlas Energy Solutions Inc |
| Sector: Energy | |
| SubSector: Oil & Gas Equipment & Services | |
| MarketCap: 1335.14 Millions | |
| Recent Price: 10.80 Smart Investing & Trading Score: 46 | |
| Day Percent Change: 0% Day Change: 0 | |
| Week Change: -0.53% Year-to-date Change: -47.7% | |
| AESI Links: Profile News Message Board | |
| Charts:- Daily , Weekly | |
| Add AESI to Watchlist: View: Get Complete AESI Trend Analysis ➞ | |
 | GPOR Gulfport Energy Corp |
| Sector: Energy | |
| SubSector: Oil & Gas E&P | |
| MarketCap: 3075.76 Millions | |
| Recent Price: 174.00 Smart Investing & Trading Score: 60 | |
| Day Percent Change: -0.0057468% Day Change: 1.89 | |
| Week Change: -0.922446% Year-to-date Change: -5.4% | |
| GPOR Links: Profile News Message Board | |
| Charts:- Daily , Weekly | |
| Add GPOR to Watchlist: View: Get Complete GPOR Trend Analysis ➞ | |
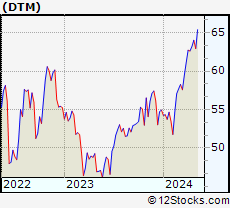 | DTM DT Midstream Inc |
| Sector: Energy | |
| SubSector: Oil & Gas Midstream | |
| MarketCap: 10694.6 Millions | |
| Recent Price: 107.32 Smart Investing & Trading Score: 70 | |
| Day Percent Change: -0.0186324% Day Change: 0.69 | |
| Week Change: 1.91833% Year-to-date Change: 7.2% | |
| DTM Links: Profile News Message Board | |
| Charts:- Daily , Weekly | |
| Add DTM to Watchlist: View: Get Complete DTM Trend Analysis ➞ | |
 | BHI Baker Hughes Incorporated |
| Sector: Energy | |
| SubSector: Oil & Gas Equipment & Services | |
| MarketCap: 25034 Millions | |
| Recent Price: 31.75 Smart Investing & Trading Score: 60 | |
| Day Percent Change: -0.0314861% Day Change: -9999 | |
| Week Change: 9.48276% Year-to-date Change: 0.0% | |
| BHI Links: Profile News Message Board | |
| Charts:- Daily , Weekly | |
| Add BHI to Watchlist: View: Get Complete BHI Trend Analysis ➞ | |
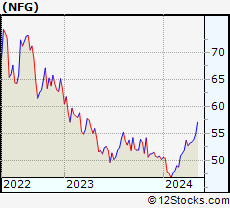 | NFG National Fuel Gas Co |
| Sector: Energy | |
| SubSector: Oil & Gas Integrated | |
| MarketCap: 7821.88 Millions | |
| Recent Price: 88.19 Smart Investing & Trading Score: 80 | |
| Day Percent Change: -0.03% Day Change: -0.03 | |
| Week Change: -0.03% Year-to-date Change: 27.6% | |
| NFG Links: Profile News Message Board | |
| Charts:- Daily , Weekly | |
| Add NFG to Watchlist: View: Get Complete NFG Trend Analysis ➞ | |
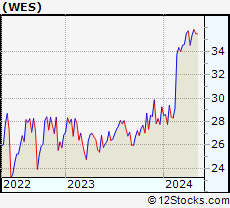 | WES Western Midstream Partners LP |
| Sector: Energy | |
| SubSector: Oil & Gas Midstream | |
| MarketCap: 14505.7 Millions | |
| Recent Price: 38.35 Smart Investing & Trading Score: 40 | |
| Day Percent Change: -0.0521241% Day Change: 0.16 | |
| Week Change: -0.311931% Year-to-date Change: 4.6% | |
| WES Links: Profile News Message Board | |
| Charts:- Daily , Weekly | |
| Add WES to Watchlist: View: Get Complete WES Trend Analysis ➞ | |
| For tabular summary view of above stock list: Summary View ➞ 0 - 25 , 25 - 50 , 50 - 75 , 75 - 100 , 100 - 125 , 125 - 150 , 150 - 175 , 175 - 200 , 200 - 225 , 225 - 250 , 250 - 275 , 275 - 300 , 300 - 325 | ||
| Click To Change The Sort Order: By Market Cap or Company Size Performance: Year-to-date, Week and Day | |
| Select Chart Type: | ||
|
Best Stocks Today 12Stocks.com |
© 2025 12Stocks.com Terms & Conditions Privacy Contact Us
All Information Provided Only For Education And Not To Be Used For Investing or Trading. See Terms & Conditions


One More Thing ... Get Best Stocks Delivered Daily!
Never Ever Miss A Move With Our Top Ten Stocks Lists
Find Best Stocks In Any Market - Bull or Bear Market
Take A Peek At Our Top Ten Stocks Lists: Daily, Weekly, Year-to-Date & Top Trends
Find Best Stocks In Any Market - Bull or Bear Market
Take A Peek At Our Top Ten Stocks Lists: Daily, Weekly, Year-to-Date & Top Trends
Energy Stocks With Best Up Trends [0-bearish to 100-bullish]: Ring [100], Denbury Resources[100], Centennial Resource[100], Stone [100], Bellatrix Exploration[100], Alon USA[100], Seadrill Partners[100], Weatherford [100], Crescent Point[100], China [100], NuStar GP[100]
Best Energy Stocks Year-to-Date:
Centrus [199.973%], Fuels[110.035%], Par Pacific[96.6447%], CVR [85.5745%], Dominion Midstream[84.3866%], NCS Multistage[66.5976%], Forum [66.2747%], Genesis [62.6704%], Geospace Technologies[61.9284%], Frontline [61.806%], Delek US[58.1642%] Best Energy Stocks This Week:
CNOOC [137266%], Parker Drilling[36988.9%], Crescent Point[4066.17%], Spectra [2373.97%], Sinopec Shanghai[1992.58%], Shell Midstream[1402.59%], PetroChina [1137.09%], China [1104.2%], Enable Midstream[966.906%], Alon USA[959.753%], NuStar GP[933.475%] Best Energy Stocks Daily:
USD Partners[33.3333%], CVR Refining[14.734%], New Fortress[6.87023%], Gastar Exploration[6.84211%], Halcon Resources[6.19469%], Renewable [5.73556%], Ring [3.92157%], Hallador [3.7405%], Parker Drilling[3.72902%], Seacor [3.65812%], Alon USA[3.27326%]