
 Login Sign Up


| |||||
 |  | ||||

| 12Stocks.com Market Intelligence |
Best Energy Stocks
| In a hurry? Energy Stocks Lists: Performance Trends Table, Stock Charts
Sort Energy stocks: Daily, Weekly, Year-to-Date, Market Cap & Trends. Filter Energy stocks list by size: All Energy Large Mid-Range Small & MicroCap |
| 12Stocks.com Energy Stocks Performances & Trends Daily | |||||||||
|
|  The overall Smart Investing & Trading Score is 40 (0-bearish to 100-bullish) which puts Energy sector in short term bearish to neutral trend. The Smart Investing & Trading Score from previous trading session is 60 and a deterioration of trend continues.
| ||||||||
Here are the Smart Investing & Trading Scores of the most requested Energy stocks at 12Stocks.com (click stock name for detailed review):
|


| 12Stocks.com: Investing in Energy sector with Stocks | |
|
The following table helps investors and traders sort through current performance and trends (as measured by Smart Investing & Trading Score) of various
stocks in the Energy sector. Quick View: Move mouse or cursor over stock symbol (ticker) to view short-term Technical chart and over stock name to view long term chart. Click on  to add stock symbol to your watchlist and to add stock symbol to your watchlist and  to view watchlist. Click on any ticker or stock name for detailed market intelligence report for that stock. to view watchlist. Click on any ticker or stock name for detailed market intelligence report for that stock. |
12Stocks.com Performance of Stocks in Energy Sector
| Ticker | Stock Name | Watchlist | Category | Recent Price | Smart Investing & Trading Score | Change % | YTD Change% |
| DNN | Denison Mines |   | Uranium | 2.32 | 100 | 1.56% | 8.33% |
| GEL | Genesis | | Midstream | 16.99 | 0 | 1.53% | 76.63% |
| SDRL | Seadrill | | Drilling | 31.91 | 90 | -0.31% | -25.25% |
| HP | Helmerich & Payne | | Drilling | 20.89 | 60 | 1.01% | -42.72% |
| DHT | DHT | | Midstream | 11.72 | 100 | 4.19% | 26.55% |
| DK | Delek US | | Refining | 27.71 | 70 | -8.67% | 28.00% |
| TGS | Transportadora de | | Integrated | 27.16 | 30 | 3.27% | -3.89% |
| TNK | Teekay Tankers | | Midstream | 49.17 | 100 | 7.26% | 24.37% |
| GLP | Global Partners | | Midstream | 53.11 | 40 | 0.99% | 14.50% |
| PARR | Par Pacific | | Refining | 34.64 | 50 | -5.10% | 83.83% |
| LBRT | Liberty | | Equipment | 11.25 | 10 | -0.28% | -45.97% |
| BTE | Baytex | | E&P | 2.23 | 50 | 2.03% | -20.84% |
| MNR | Mach Natural | | E&P | 14.23 | 30 | -2.80% | -13.86% |
| TALO | Talos | | E&P | 9.88 | 60 | 1.64% | -10.50% |
| KRP | Kimbell Royalty | | E&P | 13.97 | 0 | 0.59% | -10.56% |
| FLNG | Flex Lng | | Midstream | 27.25 | 40 | 2.98% | 23.33% |
| NRP | Natural Resource | | Thermal Coal | 103.56 | 10 | -2.00% | -6.21% |
| AESI | Atlas | | Equipment | 11.71 | 46 | 0.00% | -47.66% |
| LPG | Dorian LPG | | Midstream | 31.98 | 80 | 2.46% | 37.57% |
| MRC | MRC Global | | Equipment | 15.08 | 70 | 1.79% | 10.95% |
| DMLP | Dorchester Minerals | | E&P | 25.16 | 30 | -0.29% | -22.02% |
| NVGS | Navigator | | Midstream | 16.09 | 100 | 3.91% | 6.29% |
| VET | Vermilion | | E&P | 7.55 | 30 | 1.97% | -20.89% |
| SBR | Sabine Royalty | | Midstream | 74.30 | 70 | -0.15% | 14.94% |
| RES | RPC | | Equipment | 4.77 | 40 | 1.83% | -23.08% |
| For chart view version of above stock list: Chart View ➞ 0 - 25 , 25 - 50 , 50 - 75 , 75 - 100 , 100 - 125 , 125 - 150 , 150 - 175 , 175 - 200 | ||
 | Click To Change The Sort Order: By Market Cap or Company Size Performance: Year-to-date, Week and Day |  |
|
Get the most comprehensive stock market coverage daily at 12Stocks.com ➞ Best Stocks Today ➞ Best Stocks Weekly ➞ Best Stocks Year-to-Date ➞ Best Stocks Trends ➞  Best Stocks Today 12Stocks.com Best Nasdaq Stocks ➞ Best S&P 500 Stocks ➞ Best Tech Stocks ➞ Best Biotech Stocks ➞ |
| Detailed Overview of Energy Stocks |
| Energy Technical Overview, Leaders & Laggards, Top Energy ETF Funds & Detailed Energy Stocks List, Charts, Trends & More |
| Energy Sector: Technical Analysis, Trends & YTD Performance | |
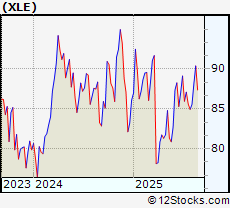
| Energy sector is composed of stocks
from oil production, refining, exploration, drilling
and services subsectors. Energy sector, as represented by XLE, an exchange-traded fund [ETF] that holds basket of Energy stocks (e.g, Exxon, Halliburton) is up by 1.28% and is currently underperforming the overall market by -6.44% year-to-date. Below is a quick view of Technical charts and trends: |
|
 XLE Weekly Chart |
|
| Long Term Trend: Very Good | |
| Medium Term Trend: Good | |
 XLE Daily Chart |
|
| Short Term Trend: Not Good | |
| Overall Trend Score: 40 | |
| YTD Performance: 1.28% | |
| **Trend Scores & Views Are Only For Educational Purposes And Not For Investing | |
| 12Stocks.com: Top Performing Energy Sector Stocks | ||||||||||||||||||||||||||||||||||||||||||||||||
 The top performing Energy sector stocks year to date are
Now, more recently, over last week, the top performing Energy sector stocks on the move are


|
||||||||||||||||||||||||||||||||||||||||||||||||
| 12Stocks.com: Investing in Energy Sector using Exchange Traded Funds | |
|
The following table shows list of key exchange traded funds (ETF) that
help investors track Energy Index. For detailed view, check out our ETF Funds section of our website. Quick View: Move mouse or cursor over ETF symbol (ticker) to view short-term Technical chart and over ETF name to view long term chart. Click on ticker or stock name for detailed view. Click on to add stock symbol to your watchlist and to view watchlist. |
12Stocks.com List of ETFs that track Energy Index
| Ticker | ETF Name | Watchlist | Recent Price | Smart Investing & Trading Score | Change % | Week % | Year-to-date % |
| 12Stocks.com: Charts, Trends, Fundamental Data and Performances of Energy Stocks | |
|
We now take in-depth look at all Energy stocks including charts, multi-period performances and overall trends (as measured by Smart Investing & Trading Score). One can sort Energy stocks (click link to choose) by Daily, Weekly and by Year-to-Date performances. Also, one can sort by size of the company or by market capitalization. |
| Select Your Default Chart Type: | |||||
| |||||
| Click on stock symbol or name for detailed view. Click on to add stock symbol to your watchlist and to view watchlist. Quick View: Move mouse or cursor over "Daily" to quickly view daily Technical stock chart and over "Weekly" to view weekly Technical stock chart. | |||||

 | DNN Denison Mines Corp |
| Sector: Energy | |
| SubSector: Uranium | |
| MarketCap: 2106.89 Millions | |
| Recent Price: 2.32 Smart Investing & Trading Score: 100 | |
| Day Percent Change: 1.56% Day Change: 0.03 | |
| Week Change: -3.94% Year-to-date Change: 8.3% | |
| DNN Links: Profile News Message Board | |
| Charts:- Daily , Weekly | |
| Add DNN to Watchlist: View: Get Complete DNN Trend Analysis ➞ | |
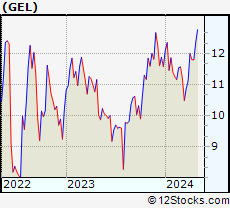 | GEL Genesis Energy L.P |
| Sector: Energy | |
| SubSector: Oil & Gas Midstream | |
| MarketCap: 2034.13 Millions | |
| Recent Price: 16.99 Smart Investing & Trading Score: 0 | |
| Day Percent Change: 1.53% Day Change: 0.26 | |
| Week Change: 2.32% Year-to-date Change: 76.6% | |
| GEL Links: Profile News Message Board | |
| Charts:- Daily , Weekly | |
| Add GEL to Watchlist: View: Get Complete GEL Trend Analysis ➞ | |
 | SDRL Seadrill Ltd |
| Sector: Energy | |
| SubSector: Oil & Gas Drilling | |
| MarketCap: 2030.7 Millions | |
| Recent Price: 31.91 Smart Investing & Trading Score: 90 | |
| Day Percent Change: -0.31% Day Change: -0.09 | |
| Week Change: 0.31% Year-to-date Change: -25.3% | |
| SDRL Links: Profile News Message Board | |
| Charts:- Daily , Weekly | |
| Add SDRL to Watchlist: View: Get Complete SDRL Trend Analysis ➞ | |
 | HP Helmerich & Payne, Inc |
| Sector: Energy | |
| SubSector: Oil & Gas Drilling | |
| MarketCap: 2008.68 Millions | |
| Recent Price: 20.89 Smart Investing & Trading Score: 60 | |
| Day Percent Change: 1.01% Day Change: 0.18 | |
| Week Change: -2.29% Year-to-date Change: -42.7% | |
| HP Links: Profile News Message Board | |
| Charts:- Daily , Weekly | |
| Add HP to Watchlist: View: Get Complete HP Trend Analysis ➞ | |
 | DHT DHT Holdings Inc |
| Sector: Energy | |
| SubSector: Oil & Gas Midstream | |
| MarketCap: 2000.55 Millions | |
| Recent Price: 11.72 Smart Investing & Trading Score: 100 | |
| Day Percent Change: 4.19% Day Change: 0.46 | |
| Week Change: 1.96% Year-to-date Change: 26.6% | |
| DHT Links: Profile News Message Board | |
| Charts:- Daily , Weekly | |
| Add DHT to Watchlist: View: Get Complete DHT Trend Analysis ➞ | |
 | DK Delek US Holdings Inc |
| Sector: Energy | |
| SubSector: Oil & Gas Refining & Marketing | |
| MarketCap: 1883.97 Millions | |
| Recent Price: 27.71 Smart Investing & Trading Score: 70 | |
| Day Percent Change: -8.67% Day Change: -2.15 | |
| Week Change: 7.76% Year-to-date Change: 28.0% | |
| DK Links: Profile News Message Board | |
| Charts:- Daily , Weekly | |
| Add DK to Watchlist: View: Get Complete DK Trend Analysis ➞ | |
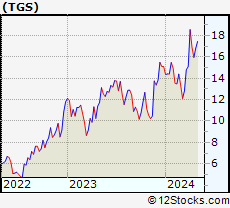 | TGS Transportadora de Gas del Sur ADR |
| Sector: Energy | |
| SubSector: Oil & Gas Integrated | |
| MarketCap: 1837.84 Millions | |
| Recent Price: 27.16 Smart Investing & Trading Score: 30 | |
| Day Percent Change: 3.27% Day Change: 0.89 | |
| Week Change: 0.11% Year-to-date Change: -3.9% | |
| TGS Links: Profile News Message Board | |
| Charts:- Daily , Weekly | |
| Add TGS to Watchlist: View: Get Complete TGS Trend Analysis ➞ | |
 | TNK Teekay Tankers Ltd |
| Sector: Energy | |
| SubSector: Oil & Gas Midstream | |
| MarketCap: 1800.16 Millions | |
| Recent Price: 49.17 Smart Investing & Trading Score: 100 | |
| Day Percent Change: 7.26% Day Change: 3.24 | |
| Week Change: 8.58% Year-to-date Change: 24.4% | |
| TNK Links: Profile News Message Board | |
| Charts:- Daily , Weekly | |
| Add TNK to Watchlist: View: Get Complete TNK Trend Analysis ➞ | |
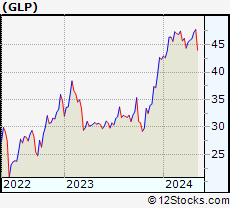 | GLP Global Partners LP |
| Sector: Energy | |
| SubSector: Oil & Gas Midstream | |
| MarketCap: 1749.75 Millions | |
| Recent Price: 53.11 Smart Investing & Trading Score: 40 | |
| Day Percent Change: 0.99% Day Change: 0.5 | |
| Week Change: 0.02% Year-to-date Change: 14.5% | |
| GLP Links: Profile News Message Board | |
| Charts:- Daily , Weekly | |
| Add GLP to Watchlist: View: Get Complete GLP Trend Analysis ➞ | |
 | PARR Par Pacific Holdings Inc |
| Sector: Energy | |
| SubSector: Oil & Gas Refining & Marketing | |
| MarketCap: 1721.6 Millions | |
| Recent Price: 34.64 Smart Investing & Trading Score: 50 | |
| Day Percent Change: -5.1% Day Change: -1.62 | |
| Week Change: 6.77% Year-to-date Change: 83.8% | |
| PARR Links: Profile News Message Board | |
| Charts:- Daily , Weekly | |
| Add PARR to Watchlist: View: Get Complete PARR Trend Analysis ➞ | |
 | LBRT Liberty Energy Inc |
| Sector: Energy | |
| SubSector: Oil & Gas Equipment & Services | |
| MarketCap: 1697.3 Millions | |
| Recent Price: 11.25 Smart Investing & Trading Score: 10 | |
| Day Percent Change: -0.28% Day Change: -0.03 | |
| Week Change: -5.52% Year-to-date Change: -46.0% | |
| LBRT Links: Profile News Message Board | |
| Charts:- Daily , Weekly | |
| Add LBRT to Watchlist: View: Get Complete LBRT Trend Analysis ➞ | |
 | BTE Baytex Energy Corp |
| Sector: Energy | |
| SubSector: Oil & Gas E&P | |
| MarketCap: 1674.89 Millions | |
| Recent Price: 2.23 Smart Investing & Trading Score: 50 | |
| Day Percent Change: 2.03% Day Change: 0.04 | |
| Week Change: -0.5% Year-to-date Change: -20.8% | |
| BTE Links: Profile News Message Board | |
| Charts:- Daily , Weekly | |
| Add BTE to Watchlist: View: Get Complete BTE Trend Analysis ➞ | |
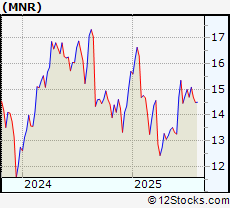 | MNR Mach Natural Resources LP |
| Sector: Energy | |
| SubSector: Oil & Gas E&P | |
| MarketCap: 1661.46 Millions | |
| Recent Price: 14.23 Smart Investing & Trading Score: 30 | |
| Day Percent Change: -2.8% Day Change: -0.39 | |
| Week Change: -6.55% Year-to-date Change: -13.9% | |
| MNR Links: Profile News Message Board | |
| Charts:- Daily , Weekly | |
| Add MNR to Watchlist: View: Get Complete MNR Trend Analysis ➞ | |
 | TALO Talos Energy Inc |
| Sector: Energy | |
| SubSector: Oil & Gas E&P | |
| MarketCap: 1654.01 Millions | |
| Recent Price: 9.88 Smart Investing & Trading Score: 60 | |
| Day Percent Change: 1.64% Day Change: 0.14 | |
| Week Change: 4.2% Year-to-date Change: -10.5% | |
| TALO Links: Profile News Message Board | |
| Charts:- Daily , Weekly | |
| Add TALO to Watchlist: View: Get Complete TALO Trend Analysis ➞ | |
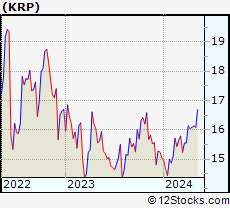 | KRP Kimbell Royalty Partners LP |
| Sector: Energy | |
| SubSector: Oil & Gas E&P | |
| MarketCap: 1641.11 Millions | |
| Recent Price: 13.97 Smart Investing & Trading Score: 0 | |
| Day Percent Change: 0.59% Day Change: 0.08 | |
| Week Change: -5.74% Year-to-date Change: -10.6% | |
| KRP Links: Profile News Message Board | |
| Charts:- Daily , Weekly | |
| Add KRP to Watchlist: View: Get Complete KRP Trend Analysis ➞ | |
 | FLNG Flex Lng Ltd |
| Sector: Energy | |
| SubSector: Oil & Gas Midstream | |
| MarketCap: 1370.18 Millions | |
| Recent Price: 27.25 Smart Investing & Trading Score: 40 | |
| Day Percent Change: 2.98% Day Change: 0.77 | |
| Week Change: 5.43% Year-to-date Change: 23.3% | |
| FLNG Links: Profile News Message Board | |
| Charts:- Daily , Weekly | |
| Add FLNG to Watchlist: View: Get Complete FLNG Trend Analysis ➞ | |
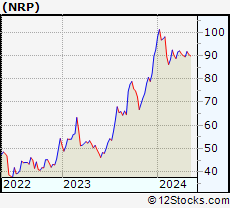 | NRP Natural Resource Partners LP |
| Sector: Energy | |
| SubSector: Thermal Coal | |
| MarketCap: 1346 Millions | |
| Recent Price: 103.56 Smart Investing & Trading Score: 10 | |
| Day Percent Change: -2% Day Change: -2.07 | |
| Week Change: -1.93% Year-to-date Change: -6.2% | |
| NRP Links: Profile News Message Board | |
| Charts:- Daily , Weekly | |
| Add NRP to Watchlist: View: Get Complete NRP Trend Analysis ➞ | |
 | AESI Atlas Energy Solutions Inc |
| Sector: Energy | |
| SubSector: Oil & Gas Equipment & Services | |
| MarketCap: 1335.14 Millions | |
| Recent Price: 11.71 Smart Investing & Trading Score: 46 | |
| Day Percent Change: 0% Day Change: 0 | |
| Week Change: -0.53% Year-to-date Change: -47.7% | |
| AESI Links: Profile News Message Board | |
| Charts:- Daily , Weekly | |
| Add AESI to Watchlist: View: Get Complete AESI Trend Analysis ➞ | |
 | LPG Dorian LPG Ltd |
| Sector: Energy | |
| SubSector: Oil & Gas Midstream | |
| MarketCap: 1325.92 Millions | |
| Recent Price: 31.98 Smart Investing & Trading Score: 80 | |
| Day Percent Change: 2.46% Day Change: 0.75 | |
| Week Change: 3.24% Year-to-date Change: 37.6% | |
| LPG Links: Profile News Message Board | |
| Charts:- Daily , Weekly | |
| Add LPG to Watchlist: View: Get Complete LPG Trend Analysis ➞ | |
 | MRC MRC Global Inc |
| Sector: Energy | |
| SubSector: Oil & Gas Equipment & Services | |
| MarketCap: 1284.78 Millions | |
| Recent Price: 15.08 Smart Investing & Trading Score: 70 | |
| Day Percent Change: 1.79% Day Change: 0.25 | |
| Week Change: 1.36% Year-to-date Change: 11.0% | |
| MRC Links: Profile News Message Board | |
| Charts:- Daily , Weekly | |
| Add MRC to Watchlist: View: Get Complete MRC Trend Analysis ➞ | |
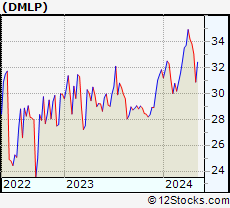 | DMLP Dorchester Minerals LP |
| Sector: Energy | |
| SubSector: Oil & Gas E&P | |
| MarketCap: 1179.23 Millions | |
| Recent Price: 25.16 Smart Investing & Trading Score: 30 | |
| Day Percent Change: -0.29% Day Change: -0.07 | |
| Week Change: -3.39% Year-to-date Change: -22.0% | |
| DMLP Links: Profile News Message Board | |
| Charts:- Daily , Weekly | |
| Add DMLP to Watchlist: View: Get Complete DMLP Trend Analysis ➞ | |
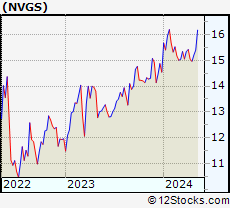 | NVGS Navigator Holdings Ltd |
| Sector: Energy | |
| SubSector: Oil & Gas Midstream | |
| MarketCap: 1151.13 Millions | |
| Recent Price: 16.09 Smart Investing & Trading Score: 100 | |
| Day Percent Change: 3.91% Day Change: 0.61 | |
| Week Change: 3.91% Year-to-date Change: 6.3% | |
| NVGS Links: Profile News Message Board | |
| Charts:- Daily , Weekly | |
| Add NVGS to Watchlist: View: Get Complete NVGS Trend Analysis ➞ | |
 | VET Vermilion Energy Inc |
| Sector: Energy | |
| SubSector: Oil & Gas E&P | |
| MarketCap: 1121.2 Millions | |
| Recent Price: 7.55 Smart Investing & Trading Score: 30 | |
| Day Percent Change: 1.97% Day Change: 0.14 | |
| Week Change: -0.82% Year-to-date Change: -20.9% | |
| VET Links: Profile News Message Board | |
| Charts:- Daily , Weekly | |
| Add VET to Watchlist: View: Get Complete VET Trend Analysis ➞ | |
 | SBR Sabine Royalty Trust |
| Sector: Energy | |
| SubSector: Oil & Gas Midstream | |
| MarketCap: 1084.56 Millions | |
| Recent Price: 74.30 Smart Investing & Trading Score: 70 | |
| Day Percent Change: -0.15% Day Change: -0.11 | |
| Week Change: -0.43% Year-to-date Change: 14.9% | |
| SBR Links: Profile News Message Board | |
| Charts:- Daily , Weekly | |
| Add SBR to Watchlist: View: Get Complete SBR Trend Analysis ➞ | |
 | RES RPC, Inc |
| Sector: Energy | |
| SubSector: Oil & Gas Equipment & Services | |
| MarketCap: 1043.52 Millions | |
| Recent Price: 4.77 Smart Investing & Trading Score: 40 | |
| Day Percent Change: 1.83% Day Change: 0.08 | |
| Week Change: 0.68% Year-to-date Change: -23.1% | |
| RES Links: Profile News Message Board | |
| Charts:- Daily , Weekly | |
| Add RES to Watchlist: View: Get Complete RES Trend Analysis ➞ | |
| For tabular summary view of above stock list: Summary View ➞ 0 - 25 , 25 - 50 , 50 - 75 , 75 - 100 , 100 - 125 , 125 - 150 , 150 - 175 , 175 - 200 | ||
| Click To Change The Sort Order: By Market Cap or Company Size Performance: Year-to-date, Week and Day | |
| Select Chart Type: | ||
|
Best Stocks Today 12Stocks.com |
© 2025 12Stocks.com Terms & Conditions Privacy Contact Us
All Information Provided Only For Education And Not To Be Used For Investing or Trading. See Terms & Conditions


One More Thing ... Get Best Stocks Delivered Daily!
Never Ever Miss A Move With Our Top Ten Stocks Lists
Find Best Stocks In Any Market - Bull or Bear Market
Take A Peek At Our Top Ten Stocks Lists: Daily, Weekly, Year-to-Date & Top Trends
Find Best Stocks In Any Market - Bull or Bear Market
Take A Peek At Our Top Ten Stocks Lists: Daily, Weekly, Year-to-Date & Top Trends
Energy Stocks With Best Up Trends [0-bearish to 100-bullish]: Teekay Tankers[100], Frontline [100], Teekay [100], Seaways[100], Nordic American[100], Tsakos [100], Scorpio Tankers[100], DHT [100], Navigator [100], Torm [100], Valaris [100]
Best Energy Stocks Year-to-Date:
Centrus [166.15%], Par Pacific[83.83%], Fuels[83.24%], Genesis [76.63%], Geospace Technologies[76.45%], CVR [60.19%], Forum [53.13%], San Juan[49.35%], Frontline [46.38%], National Fuel[45.87%], Uranium [43.8%] Best Energy Stocks This Week:
National [23.8%], Geospace Technologies[12.9%], NCS Multistage[9.58%], Frontline [9.02%], Teekay Tankers[8.58%], ProFrac Holding[8.26%], Teekay [8.23%], Delek US[7.76%], Scorpio Tankers[7.59%], Nordic American[7.45%], Seaways[7.2%] Best Energy Stocks Daily:
Fuels[10.2%], Houston American[7.68%], Teekay Tankers[7.26%], New Fortress[6.67%], Frontline [6.62%], Teekay [6.23%], Seaways[5.35%], Helix [5.26%], Ur- [5.08%], Nordic American[4.84%], Tsakos [4.83%]