
 Login Sign Up


| |||||
 |  | ||||

| 12Stocks.com Market Intelligence |
Best Emerging Markets Stocks
| In a hurry? Emerging Markets Stocks Lists: Trends Table, Stock Charts
Sort Emerging Markets stocks: Daily, Weekly, Year-to-Date, Market Cap & Trends. Filter Emerging Markets stocks list by sector: Show all, Tech, Finance, Energy, Staples, Retail, Industrial, Materials, Utilities and HealthCare Filter Emerging Markets stocks list by size:All Large Medium Small |
| 12Stocks.com Emerging Markets Stocks Performances & Trends Daily | |||||||||
|
|  The overall Smart Investing & Trading Score is 100 (0-bearish to 100-bullish) which puts Emerging Markets index in short term bullish trend. The Smart Investing & Trading Score from previous trading session is 100 and an improvement of trend continues.
| ||||||||
Here are the Smart Investing & Trading Scores of the most requested Emerging Markets stocks at 12Stocks.com (click stock name for detailed review):
|


| 12Stocks.com: Top Performing Emerging Markets Index Stocks | |||||||||||||||||||||||||||||||||||||||||||||||
 The top performing Emerging Markets Index stocks year to date are
Now, more recently, over last week, the top performing Emerging Markets Index stocks on the move are


|
|||||||||||||||||||||||||||||||||||||||||||||||
| 12Stocks.com: Investing in Emerging Markets Index with Stocks | |
|
The following table helps investors and traders sort through current performance and trends (as measured by Smart Investing & Trading Score ) of various
stocks in the Emerging Markets Index. Quick View: Move mouse or cursor over stock symbol (ticker) to view short-term technical chart and over stock name to view long term chart. Click on  to add stock symbol to your watchlist and to add stock symbol to your watchlist and  to view watchlist. Click on any ticker or stock name for detailed market intelligence report for that stock. to view watchlist. Click on any ticker or stock name for detailed market intelligence report for that stock. |
12Stocks.com Performance of Stocks in Emerging Markets Index
| Ticker | Stock Name | Watchlist | Category | Recent Price | Smart Investing & Trading Score | Change % | YTD Change% |
| TSM | Taiwan Semiconductor |   | Technology | 259.33 | 100 | 0.16% | 29.62% |
| HDB | HDFC Bank | | Financials | 35.07 | 20 | -0.90% | -44.65% |
| BABA | Alibaba | | Services & Goods | 155.06 | 100 | -0.24% | 83.98% |
| PDD | PDD | | Services & Goods | 125.44 | 40 | -0.22% | 29.47% |
| CHL | China Mobile | | Technology | 170.03 | 60 | 0.57% | 0.00% |
| PTR | PetroChina | | Energy | 521.31 | 70 | 0.60% | 0.00% |
| IBN | ICICI Bank | | Financials | 32.07 | 60 | 0.28% | 8.43% |
| DADA | Dada Nexus | | Services & Goods | 1.96 | 10 | -1.26% | 47.37% |
| LFC | China Life | | Financials | 43.74 | 80 | -0.36% | 0.00% |
| NTES | NetEase | | Technology | 152.77 | 100 | 1.78% | 77.12% |
| SNP | China | | Energy | 510.10 | 100 | 1.35% | 0.00% |
| INFY | Infosys | | Technology | 16.96 | 30 | -0.64% | -23.96% |
| BRLI | Brilliant Acquisition | | Financials | 4.70 | 10 | 0.00% | 0.00% |
| AMX | America Movil | | Technology | 20.34 | 100 | 0.54% | 43.31% |
| PBR | Petroleo Brasileiro | | Energy | 12.63 | 90 | -0.24% | 0.36% |
| VALE | Vale S.A. | | Materials | 10.67 | 100 | 0.38% | 24.86% |
| CEO | CNOOC | | Energy | 903.87 | 70 | 1.82% | 0.00% |
| JD | JD.com | | Services & Goods | 33.67 | 80 | -2.12% | 1.20% |
| ITUB | Itau Unibanco | | Financials | 6.97 | 50 | -1.55% | 64.29% |
| ABEV | Ambev S.A. | | Consumer Staples | 2.30 | 80 | 0.44% | 29.40% |
| CHT | Chunghwa Telecom | | Technology | 44.88 | 80 | -0.22% | 24.29% |
| CLEU | China Liberal | | Consumer Staples | 0.10 | 10 | 0.00% | -99.96% |
| GFI | Gold Fields | | Materials | 37.60 | 90 | -1.10% | 172.35% |
| WIT | Wipro . | | Technology | 2.77 | 20 | -0.72% | -20.34% |
| BIDU | Baidu | | Technology | 114.78 | 100 | 2.65% | 38.79% |
| For chart view version of above stock list: Chart View ➞ 0 - 25 , 25 - 50 , 50 - 75 , 75 - 100 , 100 - 125 , 125 - 150 , 150 - 175 , 175 - 200 , 200 - 225 , 225 - 250 , 250 - 275 | ||
 | Click To Change The Sort Order: By Market Cap or Company Size Performance: Year-to-date, Week and Day |  |
|
Get the most comprehensive stock market coverage daily at 12Stocks.com ➞ Best Stocks Today ➞ Best Stocks Weekly ➞ Best Stocks Year-to-Date ➞ Best Stocks Trends ➞  Best Stocks Today 12Stocks.com Best Nasdaq Stocks ➞ Best S&P 500 Stocks ➞ Best Tech Stocks ➞ Best Biotech Stocks ➞ |
| Detailed Overview of Emerging Markets Stocks |
| Emerging Markets Technical Overview, Leaders & Laggards, Top Emerging Markets ETF Funds & Detailed Emerging Markets Stocks List, Charts, Trends & More |
| Emerging Markets: Technical Analysis, Trends & YTD Performance | |
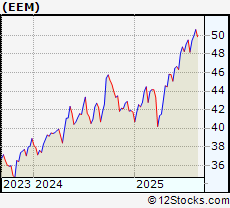
 EEM Weekly Chart |
|
| Long Term Trend: Very Good | |
| Medium Term Trend: Good | |
 EEM Daily Chart |
|
| Short Term Trend: Very Good | |
| Overall Trend Score: 100 | |
| YTD Performance: 26.3561% | |
| **Trend Scores & Views Are Only For Educational Purposes And Not For Investing | |
| 12Stocks.com: Investing in Emerging Markets Index using Exchange Traded Funds | |
|
The following table shows list of key exchange traded funds (ETF) that
help investors play Emerging Markets stock market. For detailed view, check out our ETF Funds section of our website. Quick View: Move mouse or cursor over ETF symbol (ticker) to view short-term technical chart and over ETF name to view long term chart. Click on ticker or stock name for detailed view. Click on to add stock symbol to your watchlist and to view watchlist. |
12Stocks.com List of ETFs that track Emerging Markets Index
| Ticker | ETF Name | Watchlist | Recent Price | Smart Investing & Trading Score | Change % | Week % | Year-to-date % |
| EWEM | Em Mkts Eql | | 95.84 | 70 | -0.457 | 5.08772 | 0% |
| 12Stocks.com: Charts, Trends, Fundamental Data and Performances of Emerging Markets Stocks | |
|
We now take in-depth look at all Emerging Markets stocks including charts, multi-period performances and overall trends (as measured by Smart Investing & Trading Score ). One can sort Emerging Markets stocks (click link to choose) by Daily, Weekly and by Year-to-Date performances. Also, one can sort by size of the company or by market capitalization. |
| Select Your Default Chart Type: | |||||
| |||||
| Click on stock symbol or name for detailed view. Click on to add stock symbol to your watchlist and to view watchlist. Quick View: Move mouse or cursor over "Daily" to quickly view daily technical stock chart and over "Weekly" to view weekly technical stock chart. | |||||

 | TSM Taiwan Semiconductor Manufacturing ADR |
| Sector: Technology | |
| SubSector: Semiconductors | |
| MarketCap: 1262290 Millions | |
| Recent Price: 259.33 Smart Investing & Trading Score : 100 | |
| Day Percent Change: 0.162219% Day Change: -1.27 | |
| Week Change: 10.2547% Year-to-date Change: 29.6% | |
| TSM Links: Profile News Message Board | |
| Charts:- Daily , Weekly | |
| Add TSM to Watchlist: View: Get Complete TSM Trend Analysis ➞ | |
 | HDB HDFC Bank Ltd. ADR |
| Sector: Financials | |
| SubSector: Banks - Regional | |
| MarketCap: 361333 Millions | |
| Recent Price: 35.07 Smart Investing & Trading Score : 20 | |
| Day Percent Change: -0.90421% Day Change: 0.43 | |
| Week Change: -50.3539% Year-to-date Change: -44.6% | |
| HDB Links: Profile News Message Board | |
| Charts:- Daily , Weekly | |
| Add HDB to Watchlist: View: Get Complete HDB Trend Analysis ➞ | |
 | BABA Alibaba Group Holding Ltd ADR |
| Sector: Services & Goods | |
| SubSector: Internet Retail | |
| MarketCap: 302968 Millions | |
| Recent Price: 155.06 Smart Investing & Trading Score : 100 | |
| Day Percent Change: -0.244467% Day Change: -0.13 | |
| Week Change: 18.4387% Year-to-date Change: 84.0% | |
| BABA Links: Profile News Message Board | |
| Charts:- Daily , Weekly | |
| Add BABA to Watchlist: View: Get Complete BABA Trend Analysis ➞ | |
 | PDD PDD Holdings Inc ADR |
| Sector: Services & Goods | |
| SubSector: Internet Retail | |
| MarketCap: 173152 Millions | |
| Recent Price: 125.44 Smart Investing & Trading Score : 40 | |
| Day Percent Change: -0.222717% Day Change: 0.22 | |
| Week Change: 1.26746% Year-to-date Change: 29.5% | |
| PDD Links: Profile News Message Board | |
| Charts:- Daily , Weekly | |
| Add PDD to Watchlist: View: Get Complete PDD Trend Analysis ➞ | |
 | CHL China Mobile Limited |
| Sector: Technology | |
| SubSector: Wireless Communications | |
| MarketCap: 152730 Millions | |
| Recent Price: 170.03 Smart Investing & Trading Score : 60 | |
| Day Percent Change: 0.573761% Day Change: -9999 | |
| Week Change: 27.9576% Year-to-date Change: 0.0% | |
| CHL Links: Profile News Message Board | |
| Charts:- Daily , Weekly | |
| Add CHL to Watchlist: View: Get Complete CHL Trend Analysis ➞ | |
 | PTR PetroChina Company Limited |
| Sector: Energy | |
| SubSector: Major Integrated Oil & Gas | |
| MarketCap: 119480 Millions | |
| Recent Price: 521.31 Smart Investing & Trading Score : 70 | |
| Day Percent Change: 0.596272% Day Change: -9999 | |
| Week Change: 1137.09% Year-to-date Change: 0.0% | |
| PTR Links: Profile News Message Board | |
| Charts:- Daily , Weekly | |
| Add PTR to Watchlist: View: Get Complete PTR Trend Analysis ➞ | |
 | IBN ICICI Bank Ltd. ADR |
| Sector: Financials | |
| SubSector: Banks - Regional | |
| MarketCap: 113060 Millions | |
| Recent Price: 32.07 Smart Investing & Trading Score : 60 | |
| Day Percent Change: 0.281426% Day Change: 0.14 | |
| Week Change: 0.595985% Year-to-date Change: 8.4% | |
| IBN Links: Profile News Message Board | |
| Charts:- Daily , Weekly | |
| Add IBN to Watchlist: View: Get Complete IBN Trend Analysis ➞ | |
 | DADA Dada Nexus Limited |
| Sector: Services & Goods | |
| SubSector: Internet Retail | |
| MarketCap: 98527 Millions | |
| Recent Price: 1.96 Smart Investing & Trading Score : 10 | |
| Day Percent Change: -1.25945% Day Change: -9999 | |
| Week Change: -2.48756% Year-to-date Change: 47.4% | |
| DADA Links: Profile News Message Board | |
| Charts:- Daily , Weekly | |
| Add DADA to Watchlist: View: Get Complete DADA Trend Analysis ➞ | |
 | LFC China Life Insurance Company Limited |
| Sector: Financials | |
| SubSector: Life Insurance | |
| MarketCap: 92028.5 Millions | |
| Recent Price: 43.74 Smart Investing & Trading Score : 80 | |
| Day Percent Change: -0.364465% Day Change: -9999 | |
| Week Change: 690.958% Year-to-date Change: 0.0% | |
| LFC Links: Profile News Message Board | |
| Charts:- Daily , Weekly | |
| Add LFC to Watchlist: View: Get Complete LFC Trend Analysis ➞ | |
 | NTES NetEase Inc ADR |
| Sector: Technology | |
| SubSector: Electronic Gaming & Multimedia | |
| MarketCap: 85372.9 Millions | |
| Recent Price: 152.77 Smart Investing & Trading Score : 100 | |
| Day Percent Change: 1.7822% Day Change: 2.68 | |
| Week Change: 14.7439% Year-to-date Change: 77.1% | |
| NTES Links: Profile News Message Board | |
| Charts:- Daily , Weekly | |
| Add NTES to Watchlist: View: Get Complete NTES Trend Analysis ➞ | |
 | SNP China Petroleum & Chemical Corporation |
| Sector: Energy | |
| SubSector: Major Integrated Oil & Gas | |
| MarketCap: 74664.2 Millions | |
| Recent Price: 510.10 Smart Investing & Trading Score : 100 | |
| Day Percent Change: 1.34504% Day Change: -9999 | |
| Week Change: 1104.2% Year-to-date Change: 0.0% | |
| SNP Links: Profile News Message Board | |
| Charts:- Daily , Weekly | |
| Add SNP to Watchlist: View: Get Complete SNP Trend Analysis ➞ | |
 | INFY Infosys Ltd ADR |
| Sector: Technology | |
| SubSector: Information Technology Services | |
| MarketCap: 68048.6 Millions | |
| Recent Price: 16.96 Smart Investing & Trading Score : 30 | |
| Day Percent Change: -0.644405% Day Change: -0.07 | |
| Week Change: 2.23026% Year-to-date Change: -24.0% | |
| INFY Links: Profile News Message Board | |
| Charts:- Daily , Weekly | |
| Add INFY to Watchlist: View: Get Complete INFY Trend Analysis ➞ | |
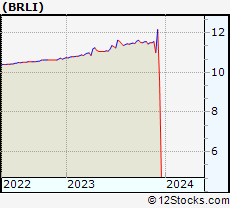 | BRLI Brilliant Acquisition Corporation |
| Sector: Financials | |
| SubSector: SPAC | |
| MarketCap: 60157 Millions | |
| Recent Price: 4.70 Smart Investing & Trading Score : 10 | |
| Day Percent Change: 0% Day Change: -9999 | |
| Week Change: 0% Year-to-date Change: 0.0% | |
| BRLI Links: Profile News Message Board | |
| Charts:- Daily , Weekly | |
| Add BRLI to Watchlist: View: Get Complete BRLI Trend Analysis ➞ | |
 | AMX America Movil S.A.B.DE C.V. ADR |
| Sector: Technology | |
| SubSector: Telecom Services | |
| MarketCap: 59926.6 Millions | |
| Recent Price: 20.34 Smart Investing & Trading Score : 100 | |
| Day Percent Change: 0.543747% Day Change: 0.32 | |
| Week Change: 4.30769% Year-to-date Change: 43.3% | |
| AMX Links: Profile News Message Board | |
| Charts:- Daily , Weekly | |
| Add AMX to Watchlist: View: Get Complete AMX Trend Analysis ➞ | |
 | PBR Petroleo Brasileiro S.A. Petrobras ADR |
| Sector: Energy | |
| SubSector: Oil & Gas Integrated | |
| MarketCap: 45433.4 Millions | |
| Recent Price: 12.63 Smart Investing & Trading Score : 90 | |
| Day Percent Change: -0.236967% Day Change: -0.04 | |
| Week Change: 2.01939% Year-to-date Change: 0.4% | |
| PBR Links: Profile News Message Board | |
| Charts:- Daily , Weekly | |
| Add PBR to Watchlist: View: Get Complete PBR Trend Analysis ➞ | |
 | VALE Vale S.A. ADR |
| Sector: Materials | |
| SubSector: Other Industrial Metals & Mining | |
| MarketCap: 44395.3 Millions | |
| Recent Price: 10.67 Smart Investing & Trading Score : 100 | |
| Day Percent Change: 0.376294% Day Change: 0.09 | |
| Week Change: 3.9961% Year-to-date Change: 24.9% | |
| VALE Links: Profile News Message Board | |
| Charts:- Daily , Weekly | |
| Add VALE to Watchlist: View: Get Complete VALE Trend Analysis ➞ | |
 | CEO CNOOC Limited |
| Sector: Energy | |
| SubSector: Oil & Gas Drilling & Exploration | |
| MarketCap: 44343.2 Millions | |
| Recent Price: 903.87 Smart Investing & Trading Score : 70 | |
| Day Percent Change: 1.82041% Day Change: -9999 | |
| Week Change: 137266% Year-to-date Change: 0.0% | |
| CEO Links: Profile News Message Board | |
| Charts:- Daily , Weekly | |
| Add CEO to Watchlist: View: Get Complete CEO Trend Analysis ➞ | |
 | JD JD.com Inc ADR |
| Sector: Services & Goods | |
| SubSector: Internet Retail | |
| MarketCap: 42508.1 Millions | |
| Recent Price: 33.67 Smart Investing & Trading Score : 80 | |
| Day Percent Change: -2.12209% Day Change: -0.57 | |
| Week Change: 8.85871% Year-to-date Change: 1.2% | |
| JD Links: Profile News Message Board | |
| Charts:- Daily , Weekly | |
| Add JD to Watchlist: View: Get Complete JD Trend Analysis ➞ | |
 | ITUB Itau Unibanco Holding S.A. ADR |
| Sector: Financials | |
| SubSector: Banks - Regional | |
| MarketCap: 37841.9 Millions | |
| Recent Price: 6.97 Smart Investing & Trading Score : 50 | |
| Day Percent Change: -1.55367% Day Change: 0.01 | |
| Week Change: -0.286123% Year-to-date Change: 64.3% | |
| ITUB Links: Profile News Message Board | |
| Charts:- Daily , Weekly | |
| Add ITUB to Watchlist: View: Get Complete ITUB Trend Analysis ➞ | |
 | ABEV Ambev S.A. ADR |
| Sector: Consumer Staples | |
| SubSector: Beverages - Brewers | |
| MarketCap: 34770.6 Millions | |
| Recent Price: 2.30 Smart Investing & Trading Score : 80 | |
| Day Percent Change: 0.436681% Day Change: 0 | |
| Week Change: 5.02283% Year-to-date Change: 29.4% | |
| ABEV Links: Profile News Message Board | |
| Charts:- Daily , Weekly | |
| Add ABEV to Watchlist: View: Get Complete ABEV Trend Analysis ➞ | |
 | CHT Chunghwa Telecom ADR |
| Sector: Technology | |
| SubSector: Telecom Services | |
| MarketCap: 34272.6 Millions | |
| Recent Price: 44.88 Smart Investing & Trading Score : 80 | |
| Day Percent Change: -0.222321% Day Change: 0.01 | |
| Week Change: 2.02319% Year-to-date Change: 24.3% | |
| CHT Links: Profile News Message Board | |
| Charts:- Daily , Weekly | |
| Add CHT to Watchlist: View: Get Complete CHT Trend Analysis ➞ | |
 | CLEU China Liberal Education Holdings Limited |
| Sector: Consumer Staples | |
| SubSector: Education & Training Services | |
| MarketCap: 32347 Millions | |
| Recent Price: 0.10 Smart Investing & Trading Score : 10 | |
| Day Percent Change: 0% Day Change: -9999 | |
| Week Change: 0% Year-to-date Change: -100.0% | |
| CLEU Links: Profile News Message Board | |
| Charts:- Daily , Weekly | |
| Add CLEU to Watchlist: View: Get Complete CLEU Trend Analysis ➞ | |
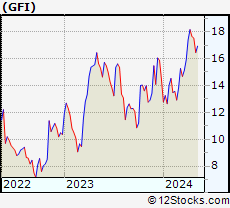 | GFI Gold Fields Ltd ADR |
| Sector: Materials | |
| SubSector: Gold | |
| MarketCap: 30752.9 Millions | |
| Recent Price: 37.60 Smart Investing & Trading Score : 90 | |
| Day Percent Change: -1.10468% Day Change: 0.38 | |
| Week Change: 12.5749% Year-to-date Change: 172.3% | |
| GFI Links: Profile News Message Board | |
| Charts:- Daily , Weekly | |
| Add GFI to Watchlist: View: Get Complete GFI Trend Analysis ➞ | |
 | WIT Wipro Ltd. ADR |
| Sector: Technology | |
| SubSector: Information Technology Services | |
| MarketCap: 28586.7 Millions | |
| Recent Price: 2.77 Smart Investing & Trading Score : 20 | |
| Day Percent Change: -0.716846% Day Change: 0.01 | |
| Week Change: 1.4652% Year-to-date Change: -20.3% | |
| WIT Links: Profile News Message Board | |
| Charts:- Daily , Weekly | |
| Add WIT to Watchlist: View: Get Complete WIT Trend Analysis ➞ | |
 | BIDU Baidu Inc ADR |
| Sector: Technology | |
| SubSector: Internet Content & Information | |
| MarketCap: 28539.6 Millions | |
| Recent Price: 114.78 Smart Investing & Trading Score : 100 | |
| Day Percent Change: 2.64711% Day Change: 3.09 | |
| Week Change: 16.872% Year-to-date Change: 38.8% | |
| BIDU Links: Profile News Message Board | |
| Charts:- Daily , Weekly | |
| Add BIDU to Watchlist: View: Get Complete BIDU Trend Analysis ➞ | |
| For tabular summary view of above stock list: Summary View ➞ 0 - 25 , 25 - 50 , 50 - 75 , 75 - 100 , 100 - 125 , 125 - 150 , 150 - 175 , 175 - 200 , 200 - 225 , 225 - 250 , 250 - 275 | ||
| Click To Change The Sort Order: By Market Cap or Company Size Performance: Year-to-date, Week and Day | |
| Select Chart Type: | ||
|
Best Stocks Today 12Stocks.com |
© 2025 12Stocks.com Terms & Conditions Privacy Contact Us
All Information Provided Only For Education And Not To Be Used For Investing or Trading. See Terms & Conditions


One More Thing ... Get Best Stocks Delivered Daily!
Never Ever Miss A Move With Our Top Ten Stocks Lists
Find Best Stocks In Any Market - Bull or Bear Market
Take A Peek At Our Top Ten Stocks Lists: Daily, Weekly, Year-to-Date & Top Trends
Find Best Stocks In Any Market - Bull or Bear Market
Take A Peek At Our Top Ten Stocks Lists: Daily, Weekly, Year-to-Date & Top Trends
Emerging Markets Stocks With Best Up Trends [0-bearish to 100-bullish]: Net 1[100], Baozun [100], VNET [100], Baidu [100], Grupo Aeroportuario[100], BRF S.A.[100], NetEase [100], China [100], Industrias Bachoco[100], Ctrip.com [100], SINA [100]
Best Emerging Markets Stocks Year-to-Date:
Regencell Bioscience[11493.1%], So-Young [375.53%], Sify [281.373%], QuantaSing [269.91%], Xunlei [259.524%], Oneconnect Financial[196.708%], Gold Fields[172.347%], Yatsen Holding[165.104%], DRDGold .[151.458%], Sibanye Stillwater[151.297%], Niu [132.759%] Best Emerging Markets Stocks This Week:
CNOOC [137266%], Companhia Brasileira[18587.4%], Cosan [16415.2%], Nam Tai[5033.33%], Fang [4150%], Sinopec Shanghai[1992.58%], Grupo Financiero[1283.52%], PetroChina [1137.09%], China [1104.2%], China Life[690.958%], Leju [539.091%] Best Emerging Markets Stocks Daily:
China SXT[15.1163%], Grupo Simec[12.2572%], HUTCHMED (China)[9.52963%], Net 1[9.46197%], Regencell Bioscience[9.29368%], Perfect Corp[8.33333%], Jianpu [7.78054%], Baozun [6.95067%], JinkoSolar Holding[6.31356%], Sibanye Gold[5.06135%], VNET [5.0494%]