
 Login Sign Up


| |||||
 |  | ||||

| 12Stocks.com Market Intelligence |
Best LargeCap Emerging Markets Stocks
| In a hurry? Emerging Markets Stocks Lists: Trends Table, Stock Charts
Sort Emerging Markets stocks: Daily, Weekly, Year-to-Date, Market Cap & Trends. Filter Emerging Markets stocks list by sector: Show all, Tech, Finance, Energy, Staples, Retail, Industrial, Materials, Utilities and HealthCare Filter Emerging Markets stocks list by size:All Large Medium Small |
| 12Stocks.com Emerging Markets Stocks Performances & Trends Daily | |||||||||
|
|  The overall Smart Investing & Trading Score is 70 (0-bearish to 100-bullish) which puts Emerging Markets index in short term neutral to bullish trend. The Smart Investing & Trading Score from previous trading session is 80 and a deterioration of trend continues.
| ||||||||
Here are the Smart Investing & Trading Scores of the most requested Emerging Markets stocks at 12Stocks.com (click stock name for detailed review):
|


| 12Stocks.com: Top Performing Emerging Markets Index Stocks | ||||||||||||||||||||||||||||||||||||||||||||||||
 The top performing Emerging Markets Index stocks year to date are
Now, more recently, over last week, the top performing Emerging Markets Index stocks on the move are


|
||||||||||||||||||||||||||||||||||||||||||||||||
| 12Stocks.com: Investing in Emerging Markets Index with Stocks | |
|
The following table helps investors and traders sort through current performance and trends (as measured by Smart Investing & Trading Score ) of various
stocks in the Emerging Markets Index. Quick View: Move mouse or cursor over stock symbol (ticker) to view short-term technical chart and over stock name to view long term chart. Click on  to add stock symbol to your watchlist and to add stock symbol to your watchlist and  to view watchlist. Click on any ticker or stock name for detailed market intelligence report for that stock. to view watchlist. Click on any ticker or stock name for detailed market intelligence report for that stock. |
12Stocks.com Performance of Stocks in Emerging Markets Index
| Ticker | Stock Name | Watchlist | Category | Recent Price | Smart Investing & Trading Score | Change % | YTD Change% |
| BABA | Alibaba |   | Services & Goods | 135.0 | 100 | 12.90% | 37.67% |
| TSM | Taiwan Semiconductor | | Technology | 239.29 | 20 | -0.56% | 15.98% |
| KC | Kingsoft Cloud | | Technology | 14.12 | 90 | -1.67% | 29.36% |
| OCFT | OneConnect Financial | | Technology | 7.23 | 20 | 1.09% | 205.35% |
| BEKE | KE | | Financials | 17.79 | 10 | -0.22% | 1.60% |
| MNSO | MINISO | | Services & Goods | 24.87 | 90 | 6.38% | -5.28% |
| JD | JD.com | | Technology | 31.07 | 20 | 2.24% | -21.50% |
| ITUB | Itau Unibanco | | Financials | 6.96 | 100 | 0.15% | 56.30% |
| AMX | America Movil | | Technology | 19.91 | 90 | 1.68% | 37.88% |
| VALE | Vale S.A | | Materials | 10.25 | 90 | 0.93% | 14.92% |
| API | Agora | | Technology | 3.51 | 10 | 2.02% | -14.90% |
| WIMI | WiMi Hologram | | Technology | 3.90 | 80 | 0.54% | -79.78% |
| PDD | Pinduoduo | | Services & Goods | 122.22 | 60 | 4.20% | 26.78% |
| YGMZ | MingZhu Logistics | | Industrials | 0.74 | 80 | 2.52% | -30.70% |
| ZCMD | Zhongchao | | Health Care | 0.98 | 80 | 1.38% | -44.38% |
| NTES | NetEase | | Technology | 136.19 | 80 | -1.07% | 34.73% |
| PBR | Petroleo Brasileiro | | Energy | 12.4 | 80 | 0.32% | -8.20% |
| QH | Quhuo | | Technology | 4.59 | 70 | -40.21% | -95.75% |
| ABEV | Ambev S.A | | Consumer Staples | 2.21 | 60 | 0.00% | 21.88% |
| NU | Nu | | Financials | 14.64 | 100 | 0.37% | 31.95% |
| HUIZ | Huize Holding | | Financials | 2.50 | 80 | -5.83% | -30.03% |
| UCL | uCloudlink | | Technology | 3.44 | 40 | -0.93% | 52.86% |
| INFY | Infosys | | Technology | 16.82 | 30 | -1.06% | -22.29% |
| EBON | Ebang | | Technology | 3.93 | 90 | 0.77% | -31.99% |
| BIDU | Baidu | | Technology | 95.3 | 100 | 4.76% | 5.19% |
| For chart view version of above stock list: Chart View ➞ 0 - 25 , 25 - 50 , 50 - 75 | ||
 | Click To Change The Sort Order: By Market Cap or Company Size Performance: Year-to-date, Week and Day |  |
|
Get the most comprehensive stock market coverage daily at 12Stocks.com ➞ Best Stocks Today ➞ Best Stocks Weekly ➞ Best Stocks Year-to-Date ➞ Best Stocks Trends ➞  Best Stocks Today 12Stocks.com Best Nasdaq Stocks ➞ Best S&P 500 Stocks ➞ Best Tech Stocks ➞ Best Biotech Stocks ➞ |
| Detailed Overview of Emerging Markets Stocks |
| Emerging Markets Technical Overview, Leaders & Laggards, Top Emerging Markets ETF Funds & Detailed Emerging Markets Stocks List, Charts, Trends & More |
| Emerging Markets: Technical Analysis, Trends & YTD Performance | |
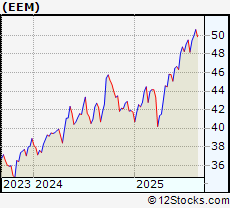
 EEM Weekly Chart |
|
| Long Term Trend: Very Good | |
| Medium Term Trend: Very Good | |
 EEM Daily Chart |
|
| Short Term Trend: Not Good | |
| Overall Trend Score: 70 | |
| YTD Performance: 17.84% | |
| **Trend Scores & Views Are Only For Educational Purposes And Not For Investing | |
| 12Stocks.com: Investing in Emerging Markets Index using Exchange Traded Funds | |
|
The following table shows list of key exchange traded funds (ETF) that
help investors play Emerging Markets stock market. For detailed view, check out our ETF Funds section of our website. Quick View: Move mouse or cursor over ETF symbol (ticker) to view short-term technical chart and over ETF name to view long term chart. Click on ticker or stock name for detailed view. Click on to add stock symbol to your watchlist and to view watchlist. |
12Stocks.com List of ETFs that track Emerging Markets Index
| Ticker | ETF Name | Watchlist | Recent Price | Smart Investing & Trading Score | Change % | Week % | Year-to-date % |
| EEM | Emerging Markets | | 49.86 | 70 | -0.48 | -1.52 | 17.84% |
| VWO | Emerging Markets | | 51.49 | 80 | 1.7 | 1.52 | 17.9% |
| SCHE | Emerging Markets Equity | | 31.47 | 80 | -0.1 | 0.1 | 17.94% |
| EWX | Emerging Markets Small | | 66.14 | 70 | -0.22 | 1.63 | 11.77% |
| EET | Emerging Markets | | 67.77 | 40 | 2.01 | 0.71 | 32.44% |
| EDC | Emrg Mkts Bull | | 42.29 | 60 | 5.67 | 3.57 | 49.54% |
| EEV | Short Emerging | | 11.77 | 30 | 0.38 | 1.02 | -30.13% |
| EUM | Short Emerging | | 22.43 | 50 | -1.68 | -0.98 | -14.92% |
| EDIV | Emerging Markets Dividend | | 38.59 | 40 | -0.34 | -0.67 | 12.36% |
| EMIF | Emerging Markets Infrastructure | | 24.82 | 40 | 0.17 | -0.21 | 21.24% |
| CEW | Emerging Currency Strat | | 18.70 | 70 | -0.13 | -0.45 | 9.76% |
| EBND | Em Mkts Lcl | | 21.30 | 90 | -0.38 | -0.33 | 11.9% |
| EMCB | Emerging Markets Corp | | 66.33 | 40 | 0.16 | -0.28 | 5.84% |
| VWOB | Emerging Mkts Govt | | 65.99 | 80 | -0.33 | -0.44 | 8.32% |
| EEMA | Emerging Markets Asia | | 85.70 | 60 | -0.18 | -0.32 | 19.2% |
| EELV | Em Mkts Low | | 26.35 | 30 | -0.11 | -0.19 | 16.01% |
| DVYE | Emerging Markets Dividend | | 29.77 | 60 | 0.34 | 0.24 | 18.05% |
| SDEM | SuperDividend Em Mkts | | 28.05 | 30 | -0.28 | 0.23 | 21.38% |
| DBEM | Em Mkts Hdgd | | 28.93 | 80 | 0.32 | 0.67 | 15.63% |
| PCY | Emerging Markets Sov | | 20.83 | 90 | -0.29 | -1.19 | 8.18% |
| QEMM | Emerging Mkts StratcFacts | | 64.29 | 40 | -0.02 | 0.38 | 13.84% |
| 12Stocks.com: Charts, Trends, Fundamental Data and Performances of Emerging Markets Stocks | |
|
We now take in-depth look at all Emerging Markets stocks including charts, multi-period performances and overall trends (as measured by Smart Investing & Trading Score ). One can sort Emerging Markets stocks (click link to choose) by Daily, Weekly and by Year-to-Date performances. Also, one can sort by size of the company or by market capitalization. |
| Select Your Default Chart Type: | |||||
| |||||
| Click on stock symbol or name for detailed view. Click on to add stock symbol to your watchlist and to view watchlist. Quick View: Move mouse or cursor over "Daily" to quickly view daily technical stock chart and over "Weekly" to view weekly technical stock chart. | |||||

 | BABA Alibaba Group Holding Limited |
| Sector: Services & Goods | |
| SubSector: Specialty Retail, Other | |
| MarketCap: 522666 Millions | |
| Recent Price: 135.0 Smart Investing & Trading Score : 100 | |
| Day Percent Change: 12.9% Day Change: 15.43 | |
| Week Change: 9.81% Year-to-date Change: 37.7% | |
| BABA Links: Profile News Message Board | |
| Charts:- Daily , Weekly | |
| Add BABA to Watchlist: View: Get Complete BABA Trend Analysis ➞ | |
 | TSM Taiwan Semiconductor Manufacturing Company Limited |
| Sector: Technology | |
| SubSector: Semiconductor - Integrated Circuits | |
| MarketCap: 239384 Millions | |
| Recent Price: 239.29 Smart Investing & Trading Score : 20 | |
| Day Percent Change: -0.56% Day Change: -1.27 | |
| Week Change: -5.67% Year-to-date Change: 16.0% | |
| TSM Links: Profile News Message Board | |
| Charts:- Daily , Weekly | |
| Add TSM to Watchlist: View: Get Complete TSM Trend Analysis ➞ | |
 | KC Kingsoft Cloud Holdings Limited |
| Sector: Technology | |
| SubSector: Software Application | |
| MarketCap: 98487 Millions | |
| Recent Price: 14.12 Smart Investing & Trading Score : 90 | |
| Day Percent Change: -1.67% Day Change: -0.23 | |
| Week Change: 2.34% Year-to-date Change: 29.4% | |
| KC Links: Profile News Message Board | |
| Charts:- Daily , Weekly | |
| Add KC to Watchlist: View: Get Complete KC Trend Analysis ➞ | |
 | OCFT OneConnect Financial Technology Co., Ltd. |
| Sector: Technology | |
| SubSector: Software Application | |
| MarketCap: 80387 Millions | |
| Recent Price: 7.23 Smart Investing & Trading Score : 20 | |
| Day Percent Change: 1.09% Day Change: 0.08 | |
| Week Change: -0.13% Year-to-date Change: 205.4% | |
| OCFT Links: Profile News Message Board | |
| Charts:- Daily , Weekly | |
| Add OCFT to Watchlist: View: Get Complete OCFT Trend Analysis ➞ | |
 | BEKE KE Holdings Inc. |
| Sector: Financials | |
| SubSector: Real Estate Services | |
| MarketCap: 80167 Millions | |
| Recent Price: 17.79 Smart Investing & Trading Score : 10 | |
| Day Percent Change: -0.22% Day Change: -0.04 | |
| Week Change: -0.33% Year-to-date Change: 1.6% | |
| BEKE Links: Profile News Message Board | |
| Charts:- Daily , Weekly | |
| Add BEKE to Watchlist: View: Get Complete BEKE Trend Analysis ➞ | |
 | MNSO MINISO Group Holding Limited |
| Sector: Services & Goods | |
| SubSector: Specialty Retail | |
| MarketCap: 69427 Millions | |
| Recent Price: 24.87 Smart Investing & Trading Score : 90 | |
| Day Percent Change: 6.38% Day Change: 1.33 | |
| Week Change: 13.58% Year-to-date Change: -5.3% | |
| MNSO Links: Profile News Message Board | |
| Charts:- Daily , Weekly | |
| Add MNSO to Watchlist: View: Get Complete MNSO Trend Analysis ➞ | |
 | JD JD.com, Inc. |
| Sector: Technology | |
| SubSector: Internet Information Providers | |
| MarketCap: 59907.3 Millions | |
| Recent Price: 31.07 Smart Investing & Trading Score : 20 | |
| Day Percent Change: 2.24% Day Change: 0.68 | |
| Week Change: -2.54% Year-to-date Change: -21.5% | |
| JD Links: Profile News Message Board | |
| Charts:- Daily , Weekly | |
| Add JD to Watchlist: View: Get Complete JD Trend Analysis ➞ | |
 | ITUB Itau Unibanco Holding S.A. |
| Sector: Financials | |
| SubSector: Foreign Regional Banks | |
| MarketCap: 48121 Millions | |
| Recent Price: 6.96 Smart Investing & Trading Score : 100 | |
| Day Percent Change: 0.15% Day Change: 0.01 | |
| Week Change: -4.73% Year-to-date Change: 56.3% | |
| ITUB Links: Profile News Message Board | |
| Charts:- Daily , Weekly | |
| Add ITUB to Watchlist: View: Get Complete ITUB Trend Analysis ➞ | |
 | AMX America Movil, S.A.B. de C.V. |
| Sector: Technology | |
| SubSector: Wireless Communications | |
| MarketCap: 44726.6 Millions | |
| Recent Price: 19.91 Smart Investing & Trading Score : 90 | |
| Day Percent Change: 1.68% Day Change: 0.32 | |
| Week Change: 2.97% Year-to-date Change: 37.9% | |
| AMX Links: Profile News Message Board | |
| Charts:- Daily , Weekly | |
| Add AMX to Watchlist: View: Get Complete AMX Trend Analysis ➞ | |
 | VALE Vale S.A. |
| Sector: Materials | |
| SubSector: Industrial Metals & Minerals | |
| MarketCap: 43601 Millions | |
| Recent Price: 10.25 Smart Investing & Trading Score : 90 | |
| Day Percent Change: 0.93% Day Change: 0.09 | |
| Week Change: -1.01% Year-to-date Change: 14.9% | |
| VALE Links: Profile News Message Board | |
| Charts:- Daily , Weekly | |
| Add VALE to Watchlist: View: Get Complete VALE Trend Analysis ➞ | |
 | API Agora, Inc. |
| Sector: Technology | |
| SubSector: Software Application | |
| MarketCap: 42787 Millions | |
| Recent Price: 3.51 Smart Investing & Trading Score : 10 | |
| Day Percent Change: 2.02% Day Change: 0.07 | |
| Week Change: -3.01% Year-to-date Change: -14.9% | |
| API Links: Profile News Message Board | |
| Charts:- Daily , Weekly | |
| Add API to Watchlist: View: Get Complete API Trend Analysis ➞ | |
 | WIMI WiMi Hologram Cloud Inc. |
| Sector: Technology | |
| SubSector: Advertising Agencies | |
| MarketCap: 41837 Millions | |
| Recent Price: 3.90 Smart Investing & Trading Score : 80 | |
| Day Percent Change: 0.54% Day Change: 0.02 | |
| Week Change: -8.33% Year-to-date Change: -79.8% | |
| WIMI Links: Profile News Message Board | |
| Charts:- Daily , Weekly | |
| Add WIMI to Watchlist: View: Get Complete WIMI Trend Analysis ➞ | |
 | PDD Pinduoduo Inc. |
| Sector: Services & Goods | |
| SubSector: Specialty Retail, Other | |
| MarketCap: 41696.2 Millions | |
| Recent Price: 122.22 Smart Investing & Trading Score : 60 | |
| Day Percent Change: 4.2% Day Change: 4.96 | |
| Week Change: 7.16% Year-to-date Change: 26.8% | |
| PDD Links: Profile News Message Board | |
| Charts:- Daily , Weekly | |
| Add PDD to Watchlist: View: Get Complete PDD Trend Analysis ➞ | |
 | YGMZ MingZhu Logistics Holdings Limited |
| Sector: Industrials | |
| SubSector: Trucking | |
| MarketCap: 41627 Millions | |
| Recent Price: 0.74 Smart Investing & Trading Score : 80 | |
| Day Percent Change: 2.52% Day Change: 0.02 | |
| Week Change: -12.31% Year-to-date Change: -30.7% | |
| YGMZ Links: Profile News Message Board | |
| Charts:- Daily , Weekly | |
| Add YGMZ to Watchlist: View: Get Complete YGMZ Trend Analysis ➞ | |
 | ZCMD Zhongchao Inc. |
| Sector: Health Care | |
| SubSector: Health Information Services | |
| MarketCap: 41487 Millions | |
| Recent Price: 0.98 Smart Investing & Trading Score : 80 | |
| Day Percent Change: 1.38% Day Change: 0.01 | |
| Week Change: -7.11% Year-to-date Change: -44.4% | |
| ZCMD Links: Profile News Message Board | |
| Charts:- Daily , Weekly | |
| Add ZCMD to Watchlist: View: Get Complete ZCMD Trend Analysis ➞ | |
 | NTES NetEase, Inc. |
| Sector: Technology | |
| SubSector: Internet Software & Services | |
| MarketCap: 40105.1 Millions | |
| Recent Price: 136.19 Smart Investing & Trading Score : 80 | |
| Day Percent Change: -1.07% Day Change: -1.47 | |
| Week Change: 3.26% Year-to-date Change: 34.7% | |
| NTES Links: Profile News Message Board | |
| Charts:- Daily , Weekly | |
| Add NTES to Watchlist: View: Get Complete NTES Trend Analysis ➞ | |
 | PBR Petroleo Brasileiro S.A. - Petrobras |
| Sector: Energy | |
| SubSector: Oil & Gas Drilling & Exploration | |
| MarketCap: 38939.2 Millions | |
| Recent Price: 12.4 Smart Investing & Trading Score : 80 | |
| Day Percent Change: 0.32% Day Change: 0.04 | |
| Week Change: 0.57% Year-to-date Change: -8.2% | |
| PBR Links: Profile News Message Board | |
| Charts:- Daily , Weekly | |
| Add PBR to Watchlist: View: Get Complete PBR Trend Analysis ➞ | |
 | QH Quhuo Limited |
| Sector: Technology | |
| SubSector: Software Application | |
| MarketCap: 37787 Millions | |
| Recent Price: 4.59 Smart Investing & Trading Score : 70 | |
| Day Percent Change: -40.21% Day Change: -0.04 | |
| Week Change: -45.57% Year-to-date Change: -95.8% | |
| QH Links: Profile News Message Board | |
| Charts:- Daily , Weekly | |
| Add QH to Watchlist: View: Get Complete QH Trend Analysis ➞ | |
 | ABEV Ambev S.A. |
| Sector: Consumer Staples | |
| SubSector: Beverages - Brewers | |
| MarketCap: 37753.5 Millions | |
| Recent Price: 2.21 Smart Investing & Trading Score : 60 | |
| Day Percent Change: 0% Day Change: 0 | |
| Week Change: 0.46% Year-to-date Change: 21.9% | |
| ABEV Links: Profile News Message Board | |
| Charts:- Daily , Weekly | |
| Add ABEV to Watchlist: View: Get Complete ABEV Trend Analysis ➞ | |
 | NU Nu Holdings Ltd. |
| Sector: Financials | |
| SubSector: Banks - Diversified | |
| MarketCap: 37240 Millions | |
| Recent Price: 14.64 Smart Investing & Trading Score : 100 | |
| Day Percent Change: 0.37% Day Change: 0.05 | |
| Week Change: 13.82% Year-to-date Change: 32.0% | |
| NU Links: Profile News Message Board | |
| Charts:- Daily , Weekly | |
| Add NU to Watchlist: View: Get Complete NU Trend Analysis ➞ | |
 | HUIZ Huize Holding Limited |
| Sector: Financials | |
| SubSector: Insurance Brokers | |
| MarketCap: 37157 Millions | |
| Recent Price: 2.50 Smart Investing & Trading Score : 80 | |
| Day Percent Change: -5.83% Day Change: -0.14 | |
| Week Change: -12.25% Year-to-date Change: -30.0% | |
| HUIZ Links: Profile News Message Board | |
| Charts:- Daily , Weekly | |
| Add HUIZ to Watchlist: View: Get Complete HUIZ Trend Analysis ➞ | |
 | UCL uCloudlink Group Inc. |
| Sector: Technology | |
| SubSector: Telecom Services | |
| MarketCap: 35837 Millions | |
| Recent Price: 3.44 Smart Investing & Trading Score : 40 | |
| Day Percent Change: -0.93% Day Change: -0.03 | |
| Week Change: -16.41% Year-to-date Change: 52.9% | |
| UCL Links: Profile News Message Board | |
| Charts:- Daily , Weekly | |
| Add UCL to Watchlist: View: Get Complete UCL Trend Analysis ➞ | |
 | INFY Infosys Limited |
| Sector: Technology | |
| SubSector: Information Technology Services | |
| MarketCap: 33819.1 Millions | |
| Recent Price: 16.82 Smart Investing & Trading Score : 30 | |
| Day Percent Change: -1.06% Day Change: -0.18 | |
| Week Change: -3% Year-to-date Change: -22.3% | |
| INFY Links: Profile News Message Board | |
| Charts:- Daily , Weekly | |
| Add INFY to Watchlist: View: Get Complete INFY Trend Analysis ➞ | |
 | EBON Ebang International Holdings Inc. |
| Sector: Technology | |
| SubSector: Computer Hardware | |
| MarketCap: 33787 Millions | |
| Recent Price: 3.93 Smart Investing & Trading Score : 90 | |
| Day Percent Change: 0.77% Day Change: 0.03 | |
| Week Change: -0.26% Year-to-date Change: -32.0% | |
| EBON Links: Profile News Message Board | |
| Charts:- Daily , Weekly | |
| Add EBON to Watchlist: View: Get Complete EBON Trend Analysis ➞ | |
 | BIDU Baidu, Inc. |
| Sector: Technology | |
| SubSector: Internet Information Providers | |
| MarketCap: 33525.9 Millions | |
| Recent Price: 95.3 Smart Investing & Trading Score : 100 | |
| Day Percent Change: 4.76% Day Change: 4.33 | |
| Week Change: 5.88% Year-to-date Change: 5.2% | |
| BIDU Links: Profile News Message Board | |
| Charts:- Daily , Weekly | |
| Add BIDU to Watchlist: View: Get Complete BIDU Trend Analysis ➞ | |
| For tabular summary view of above stock list: Summary View ➞ 0 - 25 , 25 - 50 , 50 - 75 | ||
| Click To Change The Sort Order: By Market Cap or Company Size Performance: Year-to-date, Week and Day | |
| Select Chart Type: | ||
|
Best Stocks Today 12Stocks.com |
© 2025 12Stocks.com Terms & Conditions Privacy Contact Us
All Information Provided Only For Education And Not To Be Used For Investing or Trading. See Terms & Conditions


One More Thing ... Get Best Stocks Delivered Daily!
Never Ever Miss A Move With Our Top Ten Stocks Lists
Find Best Stocks In Any Market - Bull or Bear Market
Take A Peek At Our Top Ten Stocks Lists: Daily, Weekly, Year-to-Date & Top Trends
Find Best Stocks In Any Market - Bull or Bear Market
Take A Peek At Our Top Ten Stocks Lists: Daily, Weekly, Year-to-Date & Top Trends
Emerging Markets Stocks With Best Up Trends [0-bearish to 100-bullish]: Alibaba [100], Kanzhun [100], Baidu [100], Baozun [100], Huazhu [100], iQIYI [100], Sohu.com [100], CEMEX S.A.B.[100], Smart Share[100], Companhia de[100], Sasol [100]
Best Emerging Markets Stocks Year-to-Date:
Regencell Bioscience[9561.54%], I Mab[454.12%], So-Young [384.74%], QuantaSing [269.91%], Xunlei [264.32%], OneConnect Financial[205.35%], Sify [187.76%], Niu [159.78%], Viomi [154.48%], Sibanye Stillwater[148.79%], AngloGold Ashanti[143.42%] Best Emerging Markets Stocks This Week:
Xunlei [43.56%], Burning Rock[41.87%], NIO [24.49%], iQIYI [23.04%], XPeng [17.39%], Smart Share[14.53%], Nu [13.82%], Cheetah Mobile[13.59%], MINISO [13.58%], QuantaSing [13.01%], DRDGOLD [12.42%] Best Emerging Markets Stocks Daily:
X Financial[15.73%], Alibaba [12.9%], XPeng [11.68%], Full Truck[9.81%], Viomi [9.39%], NIO [9.27%], DRDGOLD [8.49%], CNFinance [7.77%], Lixiang Education[7.32%], Kanzhun [6.61%], MINISO [6.38%]