
 Login Sign Up


| |||||
 |  | ||||

| 12Stocks.com Market Intelligence |
Best China Stocks
|
On this page, you will find the most comprehensive analysis of Chinese stocks and ETFs - from latest trends to performances to charts ➞. First, here are the year-to-date (YTD) performances of the most requested China stocks at 12Stocks.com (click stock for review):
| Sohu.com 13% | ||
| New Oriental 9% | ||
| NetEase 1% | ||
| JD.com -1% | ||
| Alibaba -3% | ||
| Vipshop -11% | ||
| Baidu -16% | ||
| JOYY -16% | ||
| Weibo -23% | ||
| In a hurry? China Stocks Lists: Performance Trends Table, Stock Charts
Sort China stocks: Daily, Weekly, Year-to-Date, Market Cap & Trends. Filter China stocks list by sector: Show all, Tech, Finance, Energy, Staples, Retail, Industrial, Materials, Utilities and HealthCare Filter China stocks list by size: All China Large Medium Small and MicroCap |
| April 26, 2024 - 12Stocks.com China Stocks Performances & Trends Daily | |||||||||
|
|  The overall Smart Investing & Trading Score is 100 (0-bearish to 100-bullish) which puts China index in short term bullish trend. The Smart Investing & Trading Score from previous trading session is 74 and an improvement of trend continues.
| ||||||||
| Here are the Smart Investing & Trading Scores of the most requested China stocks at 12Stocks.com (click stock name for detailed review): |


| 12Stocks.com: Top Performing China Index Stocks | ||||||||||||||||||||||||||||||||||||||||||||||||
 The top performing China Index stocks year to date are
Now, more recently, over last week, the top performing China Index stocks on the move are


|
||||||||||||||||||||||||||||||||||||||||||||||||
| 12Stocks.com: Investing in China Index with Stocks | |
|
The following table helps investors and traders sort through current performance and trends (as measured by Smart Investing & Trading Score) of various
stocks in the China Index. Quick View: Move mouse or cursor over stock symbol (ticker) to view short-term technical chart and over stock name to view long term chart. Click on  to add stock symbol to your watchlist and to add stock symbol to your watchlist and  to view watchlist. Click on any ticker or stock name for detailed market intelligence report for that stock. to view watchlist. Click on any ticker or stock name for detailed market intelligence report for that stock. |
12Stocks.com Performance of Stocks in China Index
| Ticker | Stock Name | Watchlist | Category | Recent Price | Smart Investing & Trading Score | Change % | Weekly Change% |
| HOLI | Hollysys Automation |   | Industrials | 24.43 | 18 | -0.37% | -0.49% |
| STG | Sunlands | | Services & Goods | 8.10 | 17 | 0.00% | -0.80% |
| QSG | QuantaSing | | Consumer Staples | 3.30 | 27 | -1.35% | -1.49% |
| WDH | Waterdrop | | Financials | 1.20 | 53 | 0.84% | -1.64% |
| SRL | Scully Royalty | | Financials | 6.40 | 30 | 2.09% | -1.99% |
| FENG | Phoenix New | | Technology | 1.78 | 53 | 1.14% | -2.20% |
| TWN | Taiwan Fund | | Financials | 36.72 | 36 | -1.67% | -2.86% |
| BEDU | Bright Scholar | | Services & Goods | 1.95 | 46 | 2.63% | -2.99% |
| MOGU | MOGU | | Services & Goods | 1.93 | 93 | 8.43% | -3.02% |
| LKCO | Luokung | | Technology | 0.52 | 33 | 0.00% | -3.04% |
| OCFT | OneConnect Financial | | Technology | 1.83 | 10 | 2.18% | -3.23% |
| KRKR | 36Kr | | Technology | 0.35 | 35 | -4.87% | -3.31% |
| SECO | Secoo Holding | | Services & Goods | 0.41 | 40 | 5.19% | -3.34% |
| LXEH | Lixiang Education | | Consumer Staples | 0.40 | 45 | -4.77% | -3.37% |
| RGC | Regencell Bioscience | | Health Care | 5.35 | 24 | 4.90% | -3.60% |
| HOLO | MicroCloud Hologram | | Technology | 2.67 | 43 | 13.86% | -4.30% |
| AGMH | AGM | | Technology | 1.06 | 10 | 0.00% | -4.50% |
| ATIF | ATIF | | Financials | 0.93 | 36 | -1.07% | -5.10% |
| SFWL | Shengfeng Development | | Industrials | 1.54 | 17 | 7.69% | -5.52% |
| QH | Quhuo | | Technology | 0.59 | 35 | -2.90% | -5.75% |
| APM | Aptorum | | Health Care | 5.56 | 53 | 0.00% | -5.76% |
| EM | Smart Share | | Services & Goods | 0.60 | 71 | -4.76% | -6.25% |
| EDU | New Oriental | | Services & Goods | 79.64 | 26 | 3.32% | -6.29% |
| MSC | Studio City | | Services & Goods | 7.00 | 46 | -3.18% | -6.54% |
| EBON | Ebang | | Technology | 7.68 | 10 | -2.66% | -6.80% |
| For chart view version of above stock list: Chart View ➞ 0 - 25 , 25 - 50 , 50 - 75 , 75 - 100 , 100 - 125 , 125 - 150 | ||
 | Click To Change The Sort Order: By Market Cap or Company Size Performance: Year-to-date, Week and Day |  |
|
Get the most comprehensive stock market coverage daily at 12Stocks.com ➞ Best Stocks Today ➞ Best Stocks Weekly ➞ Best Stocks Year-to-Date ➞ Best Stocks Trends ➞  Best Stocks Today 12Stocks.com Best Nasdaq Stocks ➞ Best S&P 500 Stocks ➞ Best Tech Stocks ➞ Best Biotech Stocks ➞ |
| Detailed Overview of China Stocks |
| China Technical Overview, Leaders & Laggards, Top China ETF Funds & Detailed China Stocks List, Charts, Trends & More |
| China: Technical Analysis, Trends & YTD Performance | |
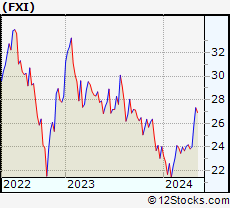
 FXI Weekly Chart |
|
| Long Term Trend: Very Good | |
| Medium Term Trend: Very Good | |
 FXI Daily Chart |
|
| Short Term Trend: Very Good | |
| Overall Trend Score: 100 | |
| YTD Performance: 5.87% | |
| **Trend Scores & Views Are Only For Educational Purposes And Not For Investing | |
| 12Stocks.com: Investing in China Index using Exchange Traded Funds | |
|
The following table shows list of key exchange traded funds (ETF) that
help investors play China stock market. For detailed view, check out our ETF Funds section of our website. Quick View: Move mouse or cursor over ETF symbol (ticker) to view short-term technical chart and over ETF name to view long term chart. Click on ticker or stock name for detailed view. Click on to add stock symbol to your watchlist and to view watchlist. |
12Stocks.com List of ETFs that track China Index
| Ticker | ETF Name | Watchlist | Recent Price | Smart Investing & Trading Score | Change % | Week % | Year-to-date % |
| FXI | China Large-Cap | | 25.44 | 100 | 0.67 | 5.96 | 5.87% |
| EWH | Hong Kong | | 15.71 | 80 | 1.35 | 6.87 | -9.56% |
| YINN | China Bull 3X | | 22.09 | 100 | 2.27 | 17.69 | 5.49% |
| YANG | China Bear 3X | | 9.83 | 0 | -2.09 | -15.77 | -23.2% |
| XPP | China 50 | | 14.45 | 100 | 0.63 | 11.43 | 5.13% |
| MCHI | China | | 41.55 | 100 | 0.51 | 5.43 | 1.99% |
| GXC | China | | 68.20 | 100 | 0.65 | 4.39 | 0.12% |
| CBON | ChinaAMC China Bond | | 21.89 | 48 | 0.37 | -0.16 | -0.95% |
| 12Stocks.com: Charts, Trends, Fundamental Data and Performances of China Stocks | |
|
We now take in-depth look at all China stocks including charts, multi-period performances and overall trends (as measured by Smart Investing & Trading Score). One can sort China stocks (click link to choose) by Daily, Weekly and by Year-to-Date performances. Also, one can sort by size of the company or by market capitalization. |
| Select Your Default Chart Type: | |||||
| |||||
| Click on stock symbol or name for detailed view. Click on to add stock symbol to your watchlist and to view watchlist. Quick View: Move mouse or cursor over "Daily" to quickly view daily technical stock chart and over "Weekly" to view weekly technical stock chart. | |||||

 | HOLI Hollysys Automation Technologies Ltd. |
| Sector: Industrials | |
| SubSector: Industrial Electrical Equipment | |
| MarketCap: 668.379 Millions | |
| Recent Price: 24.43 Smart Investing & Trading Score: 18 | |
| Day Percent Change: -0.37% Day Change: -0.09 | |
| Week Change: -0.49% Year-to-date Change: -7.3% | |
| HOLI Links: Profile News Message Board | |
| Charts:- Daily , Weekly | |
| Add HOLI to Watchlist: View: Get Complete HOLI Trend Analysis ➞ | |
 | STG Sunlands Technology Group |
| Sector: Services & Goods | |
| SubSector: Education & Training Services | |
| MarketCap: 295.706 Millions | |
| Recent Price: 8.10 Smart Investing & Trading Score: 17 | |
| Day Percent Change: 0.00% Day Change: 0.00 | |
| Week Change: -0.8% Year-to-date Change: -20.4% | |
| STG Links: Profile News Message Board | |
| Charts:- Daily , Weekly | |
| Add STG to Watchlist: View: Get Complete STG Trend Analysis ➞ | |
 | QSG QuantaSing Group Limited |
| Sector: Consumer Staples | |
| SubSector: Education & Training Services | |
| MarketCap: 433 Millions | |
| Recent Price: 3.30 Smart Investing & Trading Score: 27 | |
| Day Percent Change: -1.35% Day Change: -0.05 | |
| Week Change: -1.49% Year-to-date Change: 103.7% | |
| QSG Links: Profile News Message Board | |
| Charts:- Daily , Weekly | |
| Add QSG to Watchlist: View: Get Complete QSG Trend Analysis ➞ | |
 | WDH Waterdrop Inc. |
| Sector: Financials | |
| SubSector: Insurance - Diversified | |
| MarketCap: 874 Millions | |
| Recent Price: 1.20 Smart Investing & Trading Score: 53 | |
| Day Percent Change: 0.84% Day Change: 0.01 | |
| Week Change: -1.64% Year-to-date Change: 14.6% | |
| WDH Links: Profile News Message Board | |
| Charts:- Daily , Weekly | |
| Add WDH to Watchlist: View: Get Complete WDH Trend Analysis ➞ | |
 | SRL Scully Royalty Ltd. |
| Sector: Financials | |
| SubSector: Asset Management | |
| MarketCap: 88.3203 Millions | |
| Recent Price: 6.40 Smart Investing & Trading Score: 30 | |
| Day Percent Change: 2.09% Day Change: 0.13 | |
| Week Change: -1.99% Year-to-date Change: 4.9% | |
| SRL Links: Profile News Message Board | |
| Charts:- Daily , Weekly | |
| Add SRL to Watchlist: View: Get Complete SRL Trend Analysis ➞ | |
 | FENG Phoenix New Media Limited |
| Sector: Technology | |
| SubSector: Internet Information Providers | |
| MarketCap: 107.08 Millions | |
| Recent Price: 1.78 Smart Investing & Trading Score: 53 | |
| Day Percent Change: 1.14% Day Change: 0.02 | |
| Week Change: -2.2% Year-to-date Change: 30.9% | |
| FENG Links: Profile News Message Board | |
| Charts:- Daily , Weekly | |
| Add FENG to Watchlist: View: Get Complete FENG Trend Analysis ➞ | |
 | TWN The Taiwan Fund, Inc. |
| Sector: Financials | |
| SubSector: Closed-End Fund - Foreign | |
| MarketCap: 110.547 Millions | |
| Recent Price: 36.72 Smart Investing & Trading Score: 36 | |
| Day Percent Change: -1.67% Day Change: -0.62 | |
| Week Change: -2.86% Year-to-date Change: 6.2% | |
| TWN Links: Profile News Message Board | |
| Charts:- Daily , Weekly | |
| Add TWN to Watchlist: View: Get Complete TWN Trend Analysis ➞ | |
 | BEDU Bright Scholar Education Holdings Limited |
| Sector: Services & Goods | |
| SubSector: Education & Training Services | |
| MarketCap: 792.406 Millions | |
| Recent Price: 1.95 Smart Investing & Trading Score: 46 | |
| Day Percent Change: 2.63% Day Change: 0.05 | |
| Week Change: -2.99% Year-to-date Change: 56.0% | |
| BEDU Links: Profile News Message Board | |
| Charts:- Daily , Weekly | |
| Add BEDU to Watchlist: View: Get Complete BEDU Trend Analysis ➞ | |
 | MOGU MOGU Inc. |
| Sector: Services & Goods | |
| SubSector: Specialty Retail, Other | |
| MarketCap: 168.844 Millions | |
| Recent Price: 1.93 Smart Investing & Trading Score: 93 | |
| Day Percent Change: 8.43% Day Change: 0.15 | |
| Week Change: -3.02% Year-to-date Change: 1.1% | |
| MOGU Links: Profile News Message Board | |
| Charts:- Daily , Weekly | |
| Add MOGU to Watchlist: View: Get Complete MOGU Trend Analysis ➞ | |
 | LKCO Luokung Technology Corp. |
| Sector: Technology | |
| SubSector: Application Software | |
| MarketCap: 84 Millions | |
| Recent Price: 0.52 Smart Investing & Trading Score: 33 | |
| Day Percent Change: 0.00% Day Change: 0.00 | |
| Week Change: -3.04% Year-to-date Change: 5.4% | |
| LKCO Links: Profile News Message Board | |
| Charts:- Daily , Weekly | |
| Add LKCO to Watchlist: View: Get Complete LKCO Trend Analysis ➞ | |
 | OCFT OneConnect Financial Technology Co., Ltd. |
| Sector: Technology | |
| SubSector: Software Application | |
| MarketCap: 80387 Millions | |
| Recent Price: 1.83 Smart Investing & Trading Score: 10 | |
| Day Percent Change: 2.18% Day Change: 0.04 | |
| Week Change: -3.23% Year-to-date Change: -41.9% | |
| OCFT Links: Profile News Message Board | |
| Charts:- Daily , Weekly | |
| Add OCFT to Watchlist: View: Get Complete OCFT Trend Analysis ➞ | |
 | KRKR 36Kr Holdings Inc. |
| Sector: Technology | |
| SubSector: Internet Information Providers | |
| MarketCap: 173.18 Millions | |
| Recent Price: 0.35 Smart Investing & Trading Score: 35 | |
| Day Percent Change: -4.87% Day Change: -0.02 | |
| Week Change: -3.31% Year-to-date Change: -37.5% | |
| KRKR Links: Profile News Message Board | |
| Charts:- Daily , Weekly | |
| Add KRKR to Watchlist: View: Get Complete KRKR Trend Analysis ➞ | |
 | SECO Secoo Holding Limited |
| Sector: Services & Goods | |
| SubSector: Specialty Retail, Other | |
| MarketCap: 209.144 Millions | |
| Recent Price: 0.41 Smart Investing & Trading Score: 40 | |
| Day Percent Change: 5.19% Day Change: 0.02 | |
| Week Change: -3.34% Year-to-date Change: -28.3% | |
| SECO Links: Profile News Message Board | |
| Charts:- Daily , Weekly | |
| Add SECO to Watchlist: View: Get Complete SECO Trend Analysis ➞ | |
 | LXEH Lixiang Education Holding Co., Ltd. |
| Sector: Consumer Staples | |
| SubSector: Education & Training Services | |
| MarketCap: 12347 Millions | |
| Recent Price: 0.40 Smart Investing & Trading Score: 45 | |
| Day Percent Change: -4.77% Day Change: -0.02 | |
| Week Change: -3.37% Year-to-date Change: -63.6% | |
| LXEH Links: Profile News Message Board | |
| Charts:- Daily , Weekly | |
| Add LXEH to Watchlist: View: Get Complete LXEH Trend Analysis ➞ | |
 | RGC Regencell Bioscience Holdings Limited |
| Sector: Health Care | |
| SubSector: Drug Manufacturers - Specialty & Generic | |
| MarketCap: 284 Millions | |
| Recent Price: 5.35 Smart Investing & Trading Score: 24 | |
| Day Percent Change: 4.90% Day Change: 0.25 | |
| Week Change: -3.6% Year-to-date Change: -49.1% | |
| RGC Links: Profile News Message Board | |
| Charts:- Daily , Weekly | |
| Add RGC to Watchlist: View: Get Complete RGC Trend Analysis ➞ | |
 | HOLO MicroCloud Hologram Inc. |
| Sector: Technology | |
| SubSector: Electronic Components | |
| MarketCap: 159 Millions | |
| Recent Price: 2.67 Smart Investing & Trading Score: 43 | |
| Day Percent Change: 13.86% Day Change: 0.32 | |
| Week Change: -4.3% Year-to-date Change: 668.4% | |
| HOLO Links: Profile News Message Board | |
| Charts:- Daily , Weekly | |
| Add HOLO to Watchlist: View: Get Complete HOLO Trend Analysis ➞ | |
 | AGMH AGM Group Holdings Inc. |
| Sector: Technology | |
| SubSector: Application Software | |
| MarketCap: 320.362 Millions | |
| Recent Price: 1.06 Smart Investing & Trading Score: 10 | |
| Day Percent Change: 0.00% Day Change: 0.00 | |
| Week Change: -4.5% Year-to-date Change: -41.4% | |
| AGMH Links: Profile News Message Board | |
| Charts:- Daily , Weekly | |
| Add AGMH to Watchlist: View: Get Complete AGMH Trend Analysis ➞ | |
 | ATIF ATIF Holdings Limited |
| Sector: Financials | |
| SubSector: Asset Management | |
| MarketCap: 68.5203 Millions | |
| Recent Price: 0.93 Smart Investing & Trading Score: 36 | |
| Day Percent Change: -1.07% Day Change: -0.01 | |
| Week Change: -5.1% Year-to-date Change: -4.1% | |
| ATIF Links: Profile News Message Board | |
| Charts:- Daily , Weekly | |
| Add ATIF to Watchlist: View: Get Complete ATIF Trend Analysis ➞ | |
 | SFWL Shengfeng Development Limited |
| Sector: Industrials | |
| SubSector: Integrated Freight & Logistics | |
| MarketCap: 747 Millions | |
| Recent Price: 1.54 Smart Investing & Trading Score: 17 | |
| Day Percent Change: 7.69% Day Change: 0.11 | |
| Week Change: -5.52% Year-to-date Change: -44.0% | |
| SFWL Links: Profile News Message Board | |
| Charts:- Daily , Weekly | |
| Add SFWL to Watchlist: View: Get Complete SFWL Trend Analysis ➞ | |
 | QH Quhuo Limited |
| Sector: Technology | |
| SubSector: Software Application | |
| MarketCap: 37787 Millions | |
| Recent Price: 0.59 Smart Investing & Trading Score: 35 | |
| Day Percent Change: -2.90% Day Change: -0.02 | |
| Week Change: -5.75% Year-to-date Change: -59.6% | |
| QH Links: Profile News Message Board | |
| Charts:- Daily , Weekly | |
| Add QH to Watchlist: View: Get Complete QH Trend Analysis ➞ | |
 | APM Aptorum Group Limited |
| Sector: Health Care | |
| SubSector: Biotechnology | |
| MarketCap: 88.7785 Millions | |
| Recent Price: 5.56 Smart Investing & Trading Score: 53 | |
| Day Percent Change: 0.00% Day Change: 0.00 | |
| Week Change: -5.76% Year-to-date Change: 127.1% | |
| APM Links: Profile News Message Board | |
| Charts:- Daily , Weekly | |
| Add APM to Watchlist: View: Get Complete APM Trend Analysis ➞ | |
 | EM Smart Share Global Limited |
| Sector: Services & Goods | |
| SubSector: Personal Services | |
| MarketCap: 238 Millions | |
| Recent Price: 0.60 Smart Investing & Trading Score: 71 | |
| Day Percent Change: -4.76% Day Change: -0.03 | |
| Week Change: -6.25% Year-to-date Change: 16.5% | |
| EM Links: Profile News Message Board | |
| Charts:- Daily , Weekly | |
| Add EM to Watchlist: View: Get Complete EM Trend Analysis ➞ | |
 | EDU New Oriental Education & Technology Group Inc. |
| Sector: Services & Goods | |
| SubSector: Education & Training Services | |
| MarketCap: 18673.7 Millions | |
| Recent Price: 79.64 Smart Investing & Trading Score: 26 | |
| Day Percent Change: 3.32% Day Change: 2.56 | |
| Week Change: -6.29% Year-to-date Change: 8.7% | |
| EDU Links: Profile News Message Board | |
| Charts:- Daily , Weekly | |
| Add EDU to Watchlist: View: Get Complete EDU Trend Analysis ➞ | |
 | MSC Studio City International Holdings Limited |
| Sector: Services & Goods | |
| SubSector: Resorts & Casinos | |
| MarketCap: 1420.54 Millions | |
| Recent Price: 7.00 Smart Investing & Trading Score: 46 | |
| Day Percent Change: -3.18% Day Change: -0.23 | |
| Week Change: -6.54% Year-to-date Change: 8.0% | |
| MSC Links: Profile News Message Board | |
| Charts:- Daily , Weekly | |
| Add MSC to Watchlist: View: Get Complete MSC Trend Analysis ➞ | |
 | EBON Ebang International Holdings Inc. |
| Sector: Technology | |
| SubSector: Computer Hardware | |
| MarketCap: 33787 Millions | |
| Recent Price: 7.68 Smart Investing & Trading Score: 10 | |
| Day Percent Change: -2.66% Day Change: -0.21 | |
| Week Change: -6.8% Year-to-date Change: -49.7% | |
| EBON Links: Profile News Message Board | |
| Charts:- Daily , Weekly | |
| Add EBON to Watchlist: View: Get Complete EBON Trend Analysis ➞ | |
| For tabular summary view of above stock list: Summary View ➞ 0 - 25 , 25 - 50 , 50 - 75 , 75 - 100 , 100 - 125 , 125 - 150 | ||
| Click To Change The Sort Order: By Market Cap or Company Size Performance: Year-to-date, Week and Day | |
| Select Chart Type: | ||
|
Best Stocks Today 12Stocks.com |
© 2024 12Stocks.com Terms & Conditions Privacy Contact Us
All Information Provided Only For Education And Not To Be Used For Investing or Trading. See Terms & Conditions


One More Thing ... Get Best Stocks Delivered Daily!
Never Ever Miss A Move With Our Top Ten Stocks Lists
Find Best Stocks In Any Market - Bull or Bear Market
Take A Peek At Our Top Ten Stocks Lists: Daily, Weekly, Year-to-Date & Top Trends
Find Best Stocks In Any Market - Bull or Bear Market
Take A Peek At Our Top Ten Stocks Lists: Daily, Weekly, Year-to-Date & Top Trends
China Stocks With Best Up Trends [0-bearish to 100-bullish]: Yatsen Holding[100], Kanzhun [100], JD.com [100], Dada Nexus[100], ZTO Express[100], Alibaba [100], Baozun [95], MOGU [93], Full Truck[93], MINISO [93], U Power[93]
Best China Stocks Year-to-Date:
U Power[2852.01%], DouYu [791.58%], MicroCloud Hologram[668.35%], China Liberal[520.81%], Yatsen Holding[502.79%], Zhongchao [312.22%], Uxin [172.47%], QuantaSing [103.7%], GigaCloud [97.54%], Cheetah Mobile[88.16%], Yiren Digital[61.54%] Best China Stocks This Week:
WiMi Hologram[33.51%], Yatsen Holding[21.99%], Cheetah Mobile[21.19%], iQIYI [17.99%], Aesthetic Medical[17.77%], TAL Education[16.8%], Golden Heaven[15.91%], Hutchison China[15.16%], BeiGene [14.7%], Bilibili [14.67%], TOP Financial[14.04%] Best China Stocks Daily:
Boqii Holding[15.69%], MicroCloud Hologram[13.86%], TAL Education[8.89%], MOGU [8.43%], Cheetah Mobile[8.33%], Shengfeng Development[7.69%], Viomi [7.13%], Fangdd Network[5.41%], Secoo Holding[5.19%], 21Vianet [5.06%], Regencell Bioscience[4.90%]