
 Login Sign Up


| |||||
 |  | ||||

| 12Stocks.com Market Intelligence |
Best Canada Stocks
|
|
| Quick Read: Top Canada Stocks By Performances & Trends: Daily, Weekly, Year-to-Date, Market Cap (Size) & Technical Trends | |||
| Best Canada Views: Quick Browse View, Summary & Slide Show | |||
| 12Stocks.com Canada Stocks Performances & Trends Daily | |||||||||
|
|  The overall market intelligence score is 21 (0-bearish to 100-bullish) which puts Canada index in short term bearish to neutral trend. The market intelligence score from previous trading session is 46 and a deterioration of trend continues.
| ||||||||
Here are the market intelligence trend scores of the most requested Canada stocks at 12Stocks.com (click stock name for detailed review):
| |||||||||||||||||
| Scroll down this page for most comprehensive review of Canada stocks by performance, trends, technical analysis, charts, fund plays & more | |||||||||||||||||


| 12Stocks.com: Top Performing Canada Index Stocks | ||||||||||||||||||||||||||||||||||||||||||||||||
 The top performing Canada Index stocks year to date are
Now, more recently, over last week, the top performing Canada Index stocks on the move are


|
||||||||||||||||||||||||||||||||||||||||||||||||
| 12Stocks.com: Investing in Canada Index with Stocks | |
|
The following table helps investors and traders sort through current performance and trends (as measured by market intelligence score) of various
stocks in the Canada Index. Quick View: Move mouse or cursor over stock symbol (ticker) to view short-term technical chart and over stock name to view long term chart. Click on  to add stock symbol to your watchlist and to add stock symbol to your watchlist and  to view watchlist. Click on any ticker or stock name for detailed market intelligence report for that stock. to view watchlist. Click on any ticker or stock name for detailed market intelligence report for that stock. |
12Stocks.com Performance of Stocks in Canada Index
| Ticker | Stock Name | Watchlist | Category | Recent Price | Market Intelligence Score | Change % | YTD Change% |
| TU | TEL |   | Technology | 16.02 | 57 | -1.26 | -9.92% |
| CSIQ | Canadian Solar | | Technology | 16.14 | 52 | -1.28 | -38.47% |
| FSM | Fortuna Silver | | Materials | 4.63 | 58 | -1.39 | 19.82% |
| PAAS | Pan American | | Materials | 18.30 | 43 | -1.45 | 12.06% |
| SA | Seabridge Gold | | Materials | 14.94 | 43 | -1.45 | 23.17% |
| AGI | Alamos Gold | | Materials | 14.74 | 50 | -1.47 | 9.43% |
| SILV | SilverCrest Metals | | Materials | 8.24 | 63 | -1.49 | 25.88% |
| ABCL | AbCellera Biologics | | Health Care | 3.72 | 15 | -1.59 | -34.16% |
| EQX | Equinox Gold | | Materials | 5.33 | 43 | -1.66 | 9.00% |
| EXK | Endeavour Silver | | Materials | 2.63 | 36 | -1.69 | 33.25% |
| QBTS | D-Wave Quantum | | Technology | 1.39 | 22 | -1.77 | 57.85% |
| BCE | BCE | | Technology | 32.65 | 43 | -1.83 | -17.09% |
| ACB | Aurora Cannabis | | Health Care | 7.22 | 78 | -1.90 | NA |
| NG | NovaGold Resources | | Materials | 2.97 | 65 | -1.98 | -20.59% |
| CIGI | Colliers | | Financials | 102.46 | 10 | -2.12 | -19.02% |
| HBM | Hudbay Minerals | | Materials | 8.13 | 58 | -2.40 | 47.28% |
| IE | Ivanhoe Electric | | Materials | 9.88 | 43 | -2.47 | -2.52% |
| BLCO | Bausch + | | Health Care | 13.54 | 0 | -4.14 | -20.35% |
| STKL | SunOpta | | Consumer Staples | 5.78 | 0 | -4.30 | 5.67% |
| GIL | Gildan Activewear | | Consumer Staples | 33.09 | 0 | -4.34 | 0.09% |
| To view more stocks, click on Next / Previous arrows or select different range: 0 - 25 , 25 - 50 , 50 - 75 , 75 - 100 , 100 - 125 | ||
 | Click To Change The Sort Order: By Market Cap or Company Size Performance: Year-to-date, Week and Day |  |
| Detailed Overview Of Canada Stocks |
| Canada Technical Overview, Leaders & Laggards, Top Canada ETF Funds & Detailed Canada Stocks List, Charts, Trends & More |
| Canada: Technical Analysis, Trends & YTD Performance | |
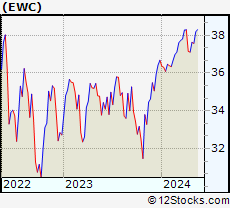
 EWC Weekly Chart |
|
| Long Term Trend: Good | |
| Medium Term Trend: Not Good | |
 EWC Daily Chart |
|
| Short Term Trend: Not Good | |
| Overall Trend Score: 21 | |
| YTD Performance: 0.98% | |
| **Trend Scores & Views Are Only For Educational Purposes And Not For Investing | |
| 12Stocks.com: Investing in Canada Index using Exchange Traded Funds | |
|
The following table shows list of key exchange traded funds (ETF) that
help investors play Canada stock market. For detailed view, check out our ETF Funds section of our website. Quick View: Move mouse or cursor over ETF symbol (ticker) to view short-term technical chart and over ETF name to view long term chart. Click on ticker or stock name for detailed view. Click on to add stock symbol to your watchlist and to view watchlist. |
12Stocks.com List of ETFs that track Canada Index
| Ticker | ETF Name | Watchlist | Recent Price | Market Intelligence Score | Change % | Week % | Year-to-date % |
| EWC | Canada | | 37.04 | 21 | 0.27 | -1.57 | 0.98% |
| 12Stocks.com: Charts, Trends, Fundamental Data and Performances of Canada Stocks | |
|
We now take in-depth look at all Canada stocks including charts, multi-period performances and overall trends (as measured by market intelligence score). One can sort Canada stocks (click link to choose) by Daily, Weekly and by Year-to-Date performances. Also, one can sort by size of the company or by market capitalization. |
| Select Your Default Chart Type: | |||||
| |||||
| Click on stock symbol or name for detailed view. Click on to add stock symbol to your watchlist and to view watchlist. Quick View: Move mouse or cursor over "Daily" to quickly view daily technical stock chart and over "Weekly" to view weekly technical stock chart. | |||||

 | TU TELUS Corporation |
| Sector: Technology | |
| SubSector: Wireless Communications | |
| MarketCap: 10864.7 Millions | |
| Recent Price: 16.02 Market Intelligence Score: 57 | |
| Day Percent Change: -1.26% Day Change: -0.21 | |
| Week Change: -0.28% Year-to-date Change: -9.9% | |
| TU Links: Profile News Message Board | |
| Charts:- Daily , Weekly | |
| Add TU to Watchlist: View: Get Complete TU Trend Analysis ➞ | |
 | CSIQ Canadian Solar Inc. |
| Sector: Technology | |
| SubSector: Semiconductor - Specialized | |
| MarketCap: 957.96 Millions | |
| Recent Price: 16.14 Market Intelligence Score: 52 | |
| Day Percent Change: -1.28% Day Change: -0.21 | |
| Week Change: 6.53% Year-to-date Change: -38.5% | |
| CSIQ Links: Profile News Message Board | |
| Charts:- Daily , Weekly | |
| Add CSIQ to Watchlist: View: Get Complete CSIQ Trend Analysis ➞ | |
 | FSM Fortuna Silver Mines Inc. |
| Sector: Materials | |
| SubSector: Silver | |
| MarketCap: 362.256 Millions | |
| Recent Price: 4.63 Market Intelligence Score: 58 | |
| Day Percent Change: -1.39% Day Change: -0.07 | |
| Week Change: -3.04% Year-to-date Change: 19.8% | |
| FSM Links: Profile News Message Board | |
| Charts:- Daily , Weekly | |
| Add FSM to Watchlist: View: Get Complete FSM Trend Analysis ➞ | |
 | PAAS Pan American Silver Corp. |
| Sector: Materials | |
| SubSector: Silver | |
| MarketCap: 2832.56 Millions | |
| Recent Price: 18.30 Market Intelligence Score: 43 | |
| Day Percent Change: -1.45% Day Change: -0.27 | |
| Week Change: -3.79% Year-to-date Change: 12.1% | |
| PAAS Links: Profile News Message Board | |
| Charts:- Daily , Weekly | |
| Add PAAS to Watchlist: View: Get Complete PAAS Trend Analysis ➞ | |
 | SA Seabridge Gold Inc. |
| Sector: Materials | |
| SubSector: Gold | |
| MarketCap: 565.419 Millions | |
| Recent Price: 14.94 Market Intelligence Score: 43 | |
| Day Percent Change: -1.45% Day Change: -0.22 | |
| Week Change: -5.98% Year-to-date Change: 23.2% | |
| SA Links: Profile News Message Board | |
| Charts:- Daily , Weekly | |
| Add SA to Watchlist: View: Get Complete SA Trend Analysis ➞ | |
 | AGI Alamos Gold Inc. |
| Sector: Materials | |
| SubSector: Gold | |
| MarketCap: 1740.39 Millions | |
| Recent Price: 14.74 Market Intelligence Score: 50 | |
| Day Percent Change: -1.47% Day Change: -0.22 | |
| Week Change: -3.66% Year-to-date Change: 9.4% | |
| AGI Links: Profile News Message Board | |
| Charts:- Daily , Weekly | |
| Add AGI to Watchlist: View: Get Complete AGI Trend Analysis ➞ | |
 | SILV SilverCrest Metals Inc. |
| Sector: Materials | |
| SubSector: Silver | |
| MarketCap: 555.356 Millions | |
| Recent Price: 8.24 Market Intelligence Score: 63 | |
| Day Percent Change: -1.49% Day Change: -0.13 | |
| Week Change: -3.34% Year-to-date Change: 25.9% | |
| SILV Links: Profile News Message Board | |
| Charts:- Daily , Weekly | |
| Add SILV to Watchlist: View: Get Complete SILV Trend Analysis ➞ | |
 | ABCL AbCellera Biologics Inc. |
| Sector: Health Care | |
| SubSector: Biotechnology | |
| MarketCap: 1870 Millions | |
| Recent Price: 3.72 Market Intelligence Score: 15 | |
| Day Percent Change: -1.59% Day Change: -0.06 | |
| Week Change: -1.06% Year-to-date Change: -34.2% | |
| ABCL Links: Profile News Message Board | |
| Charts:- Daily , Weekly | |
| Add ABCL to Watchlist: View: Get Complete ABCL Trend Analysis ➞ | |
 | EQX Equinox Gold Corp. |
| Sector: Materials | |
| SubSector: Gold | |
| MarketCap: 706.119 Millions | |
| Recent Price: 5.33 Market Intelligence Score: 43 | |
| Day Percent Change: -1.66% Day Change: -0.09 | |
| Week Change: -3.62% Year-to-date Change: 9.0% | |
| EQX Links: Profile News Message Board | |
| Charts:- Daily , Weekly | |
| Add EQX to Watchlist: View: Get Complete EQX Trend Analysis ➞ | |
 | EXK Endeavour Silver Corp. |
| Sector: Materials | |
| SubSector: Silver | |
| MarketCap: 204.456 Millions | |
| Recent Price: 2.63 Market Intelligence Score: 36 | |
| Day Percent Change: -1.69% Day Change: -0.04 | |
| Week Change: -5.58% Year-to-date Change: 33.3% | |
| EXK Links: Profile News Message Board | |
| Charts:- Daily , Weekly | |
| Add EXK to Watchlist: View: Get Complete EXK Trend Analysis ➞ | |
 | QBTS D-Wave Quantum Inc. |
| Sector: Technology | |
| SubSector: Computer Hardware | |
| MarketCap: 290 Millions | |
| Recent Price: 1.39 Market Intelligence Score: 22 | |
| Day Percent Change: -1.77% Day Change: -0.02 | |
| Week Change: -3.82% Year-to-date Change: 57.9% | |
| QBTS Links: Profile News Message Board | |
| Charts:- Daily , Weekly | |
| Add QBTS to Watchlist: View: Get Complete QBTS Trend Analysis ➞ | |
 | BCE BCE Inc. |
| Sector: Technology | |
| SubSector: Telecom Services - Domestic | |
| MarketCap: 37288.3 Millions | |
| Recent Price: 32.65 Market Intelligence Score: 43 | |
| Day Percent Change: -1.83% Day Change: -0.61 | |
| Week Change: 0.09% Year-to-date Change: -17.1% | |
| BCE Links: Profile News Message Board | |
| Charts:- Daily , Weekly | |
| Add BCE to Watchlist: View: Get Complete BCE Trend Analysis ➞ | |
 | ACB Aurora Cannabis Inc. |
| Sector: Health Care | |
| SubSector: Drug Manufacturers - Other | |
| MarketCap: 853.333 Millions | |
| Recent Price: 7.22 Market Intelligence Score: 78 | |
| Day Percent Change: -1.90% Day Change: -0.14 | |
| Week Change: 7.76% Year-to-date Change: 1,416.2% | |
| ACB Links: Profile News Message Board | |
| Charts:- Daily , Weekly | |
| Add ACB to Watchlist: View: Get Complete ACB Trend Analysis ➞ | |
 | NG NovaGold Resources Inc. |
| Sector: Materials | |
| SubSector: Gold | |
| MarketCap: 2499.49 Millions | |
| Recent Price: 2.97 Market Intelligence Score: 65 | |
| Day Percent Change: -1.98% Day Change: -0.06 | |
| Week Change: 1.02% Year-to-date Change: -20.6% | |
| NG Links: Profile News Message Board | |
| Charts:- Daily , Weekly | |
| Add NG to Watchlist: View: Get Complete NG Trend Analysis ➞ | |
 | CIGI Colliers International Group Inc. |
| Sector: Financials | |
| SubSector: Property Management | |
| MarketCap: 1928.42 Millions | |
| Recent Price: 102.46 Market Intelligence Score: 10 | |
| Day Percent Change: -2.12% Day Change: -2.22 | |
| Week Change: -5.16% Year-to-date Change: -19.0% | |
| CIGI Links: Profile News Message Board | |
| Charts:- Daily , Weekly | |
| Add CIGI to Watchlist: View: Get Complete CIGI Trend Analysis ➞ | |
 | HBM Hudbay Minerals Inc. |
| Sector: Materials | |
| SubSector: Copper | |
| MarketCap: 363.157 Millions | |
| Recent Price: 8.13 Market Intelligence Score: 58 | |
| Day Percent Change: -2.40% Day Change: -0.20 | |
| Week Change: -5.79% Year-to-date Change: 47.3% | |
| HBM Links: Profile News Message Board | |
| Charts:- Daily , Weekly | |
| Add HBM to Watchlist: View: Get Complete HBM Trend Analysis ➞ | |
 | IE Ivanhoe Electric Inc. |
| Sector: Materials | |
| SubSector: Copper | |
| MarketCap: 1200 Millions | |
| Recent Price: 9.88 Market Intelligence Score: 43 | |
| Day Percent Change: -2.47% Day Change: -0.25 | |
| Week Change: -7.49% Year-to-date Change: -2.5% | |
| IE Links: Profile News Message Board | |
| Charts:- Daily , Weekly | |
| Add IE to Watchlist: View: Get Complete IE Trend Analysis ➞ | |
 | BLCO Bausch + Lomb Corporation |
| Sector: Health Care | |
| SubSector: Medical Instruments & Supplies | |
| MarketCap: 7100 Millions | |
| Recent Price: 13.54 Market Intelligence Score: 0 | |
| Day Percent Change: -4.14% Day Change: -0.59 | |
| Week Change: -8.45% Year-to-date Change: -20.4% | |
| BLCO Links: Profile News Message Board | |
| Charts:- Daily , Weekly | |
| Add BLCO to Watchlist: View: Get Complete BLCO Trend Analysis ➞ | |
 | STKL SunOpta Inc. |
| Sector: Consumer Staples | |
| SubSector: Processed & Packaged Goods | |
| MarketCap: 174.548 Millions | |
| Recent Price: 5.78 Market Intelligence Score: 0 | |
| Day Percent Change: -4.30% Day Change: -0.26 | |
| Week Change: -13.6% Year-to-date Change: 5.7% | |
| STKL Links: Profile News Message Board | |
| Charts:- Daily , Weekly | |
| Add STKL to Watchlist: View: Get Complete STKL Trend Analysis ➞ | |
 | GIL Gildan Activewear Inc. |
| Sector: Consumer Staples | |
| SubSector: Textile - Apparel Clothing | |
| MarketCap: 2411.65 Millions | |
| Recent Price: 33.09 Market Intelligence Score: 0 | |
| Day Percent Change: -4.34% Day Change: -1.50 | |
| Week Change: -6.26% Year-to-date Change: 0.1% | |
| GIL Links: Profile News Message Board | |
| Charts:- Daily , Weekly | |
| Add GIL to Watchlist: View: Get Complete GIL Trend Analysis ➞ | |
| To view more stocks, click on Next / Previous arrows or select different range: 0 - 25 , 25 - 50 , 50 - 75 , 75 - 100 , 100 - 125 | ||
| Click To Change The Sort Order: By Market Cap or Company Size Performance: Year-to-date, Week and Day | |
| Select Chart Type: | ||
 Best Stocks Today 12Stocks.com |
© 2024 12Stocks.com Terms & Conditions Privacy Contact Us
All Information Provided Only For Education And Not To Be Used For Investing or Trading. See Terms & Conditions


One More Thing ... Get Best Stocks Delivered Daily!
Never Ever Miss A Move With Our Top Ten Stocks Lists
Find Best Stocks In Any Market - Bull or Bear Market
Take A Peek At Our Top Ten Stocks Lists: Daily, Weekly, Year-to-Date & Top Trends
Find Best Stocks In Any Market - Bull or Bear Market
Take A Peek At Our Top Ten Stocks Lists: Daily, Weekly, Year-to-Date & Top Trends
Canada Stocks With Best Up Trends [0-bearish to 100-bullish]: Brookfield Renewable[100], CAE [100], Algonquin Power[100], Algonquin Power[95], Fortis [95], Descartes Systems[95], New Gold[95], City Office[93], Mercer [88], Tilray [85], Enbridge [83]
Best Canada Stocks Year-to-Date:
Aurora Cannabis[1416.17%], Fusion [124.06%], McEwen Mining[59.5%], D-Wave Quantum[57.85%], OrganiGram [51.91%], Hudbay Minerals[47.28%], IAMGOLD [42.29%], Gold Royalty[39.79%], Endeavour Silver[33.25%], Cronos [28.71%], New Gold[28.42%] Best Canada Stocks This Week:
Tilray [16.85%], Brookfield Renewable[11.86%], Aurinia [10.18%], Vision Marine[8.51%], Aurora Cannabis[7.76%], OrganiGram [6.99%], Canadian Solar[6.53%], Zymeworks [5.69%], CAE [4.52%], Milestone [3.9%], Cronos [3.86%] Best Canada Stocks Daily:
Vermilion Energy[6.93%], Aurinia [4.04%], OrganiGram [3.92%], Vision Marine[3.31%], Tilray [2.97%], CGI [2.49%], Brookfield Renewable[2.45%], Cameco [1.89%], TFI [1.72%], Pembina Pipeline[1.66%], Crescent Point[1.53%]