
 Login Sign Up


| |||||
 |  | ||||

| 12Stocks.com Market Intelligence |
Best Canada Stocks
|
|
| Quick Read: Top Canada Stocks By Performances & Trends: Daily, Weekly, Year-to-Date, Market Cap (Size) & Technical Trends | |||
| Best Canada Views: Quick Browse View, Summary & Slide Show | |||
| 12Stocks.com Canada Stocks Performances & Trends Daily | |||||||||
|
|  The overall market intelligence score is 21 (0-bearish to 100-bullish) which puts Canada index in short term bearish to neutral trend. The market intelligence score from previous trading session is 46 and a deterioration of trend continues.
| ||||||||
Here are the market intelligence trend scores of the most requested Canada stocks at 12Stocks.com (click stock name for detailed review):
| |||||||||||||||||
| Scroll down this page for most comprehensive review of Canada stocks by performance, trends, technical analysis, charts, fund plays & more | |||||||||||||||||


| 12Stocks.com: Top Performing Canada Index Stocks | ||||||||||||||||||||||||||||||||||||||||||||||||
 The top performing Canada Index stocks year to date are
Now, more recently, over last week, the top performing Canada Index stocks on the move are


|
||||||||||||||||||||||||||||||||||||||||||||||||
| 12Stocks.com: Investing in Canada Index with Stocks | |
|
The following table helps investors and traders sort through current performance and trends (as measured by market intelligence score) of various
stocks in the Canada Index. Quick View: Move mouse or cursor over stock symbol (ticker) to view short-term technical chart and over stock name to view long term chart. Click on  to add stock symbol to your watchlist and to add stock symbol to your watchlist and  to view watchlist. Click on any ticker or stock name for detailed market intelligence report for that stock. to view watchlist. Click on any ticker or stock name for detailed market intelligence report for that stock. |
12Stocks.com Performance of Stocks in Canada Index
| Ticker | Stock Name | Watchlist | Category | Recent Price | Market Intelligence Score | Change % | YTD Change% |
| MGA | Magna |   | Services & Goods | 48.06 | 17 | 0.88 | -18.65% |
| CAE | CAE | | Industrials | 19.90 | 100 | 0.86 | -7.83% |
| CVE | Cenovus Energy | | Energy | 20.52 | 36 | 0.86 | 23.21% |
| IMO | Imperial Oil | | Energy | 67.95 | 26 | 0.83 | 18.81% |
| SU | Suncor Energy | | Energy | 37.95 | 44 | 0.80 | 18.45% |
| ENB | Enbridge | | Energy | 35.85 | 83 | 0.74 | -0.46% |
| FTS | Fortis | | Utilities | 39.81 | 95 | 0.73 | -3.21% |
| LICY | Li-Cycle | | Industrials | 0.67 | 53 | 0.69 | 7.70% |
| DOOO | BRP | | Consumer Staples | 67.68 | 36 | 0.64 | -5.59% |
| AEM | Agnico Eagle | | Materials | 64.63 | 65 | 0.61 | 17.83% |
| RY | Royal Bank | | Financials | 97.95 | 54 | 0.59 | -3.14% |
| ERF | Enerplus | | Energy | 19.44 | 43 | 0.57 | 26.73% |
| BB | BlackBerry | | Technology | 2.86 | 63 | 0.53 | -19.35% |
| MERC | Mercer | | Consumer Staples | 10.29 | 88 | 0.49 | 8.54% |
| CNQ | Canadian Natural | | Energy | 75.32 | 41 | 0.49 | 14.96% |
| CNI | Canadian National | | Transports | 121.59 | 17 | 0.48 | -3.22% |
| SLF | Sun Life | | Financials | 51.71 | 47 | 0.43 | -0.29% |
| QSR | Restaurant Brands | | Services & Goods | 73.53 | 32 | 0.42 | -5.89% |
| NVEI | Nuvei | | Technology | 32.28 | 68 | 0.42 | 22.90% |
| FUSN | Fusion | | Health Care | 21.51 | 63 | 0.42 | 124.06% |
| CM | Canadian Imperial | | Financials | 47.07 | 36 | 0.41 | -2.22% |
| OTEX | Open Text | | Technology | 35.47 | 35 | 0.34 | -15.59% |
| SHOP | Shopify | | Technology | 70.60 | 25 | 0.28 | -9.37% |
| AQN | Algonquin Power | | Utilities | 6.26 | 100 | 0.24 | -0.87% |
| TAC | TransAlta | | Utilities | 6.71 | 69 | 0.22 | -19.31% |
| To view more stocks, click on Next / Previous arrows or select different range: 0 - 25 , 25 - 50 , 50 - 75 , 75 - 100 , 100 - 125 | ||
 | Click To Change The Sort Order: By Market Cap or Company Size Performance: Year-to-date, Week and Day |  |
| Detailed Overview Of Canada Stocks |
| Canada Technical Overview, Leaders & Laggards, Top Canada ETF Funds & Detailed Canada Stocks List, Charts, Trends & More |
| Canada: Technical Analysis, Trends & YTD Performance | |
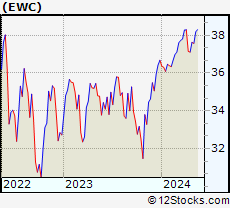
 EWC Weekly Chart |
|
| Long Term Trend: Good | |
| Medium Term Trend: Not Good | |
 EWC Daily Chart |
|
| Short Term Trend: Not Good | |
| Overall Trend Score: 21 | |
| YTD Performance: 0.98% | |
| **Trend Scores & Views Are Only For Educational Purposes And Not For Investing | |
| 12Stocks.com: Investing in Canada Index using Exchange Traded Funds | |
|
The following table shows list of key exchange traded funds (ETF) that
help investors play Canada stock market. For detailed view, check out our ETF Funds section of our website. Quick View: Move mouse or cursor over ETF symbol (ticker) to view short-term technical chart and over ETF name to view long term chart. Click on ticker or stock name for detailed view. Click on to add stock symbol to your watchlist and to view watchlist. |
12Stocks.com List of ETFs that track Canada Index
| Ticker | ETF Name | Watchlist | Recent Price | Market Intelligence Score | Change % | Week % | Year-to-date % |
| EWC | Canada | | 37.04 | 21 | 0.27 | -1.57 | 0.98% |
| 12Stocks.com: Charts, Trends, Fundamental Data and Performances of Canada Stocks | |
|
We now take in-depth look at all Canada stocks including charts, multi-period performances and overall trends (as measured by market intelligence score). One can sort Canada stocks (click link to choose) by Daily, Weekly and by Year-to-Date performances. Also, one can sort by size of the company or by market capitalization. |
| Select Your Default Chart Type: | |||||
| |||||
| Click on stock symbol or name for detailed view. Click on to add stock symbol to your watchlist and to view watchlist. Quick View: Move mouse or cursor over "Daily" to quickly view daily technical stock chart and over "Weekly" to view weekly technical stock chart. | |||||

 | MGA Magna International Inc. |
| Sector: Services & Goods | |
| SubSector: Auto Parts Wholesale | |
| MarketCap: 8967.3 Millions | |
| Recent Price: 48.06 Market Intelligence Score: 17 | |
| Day Percent Change: 0.88% Day Change: 0.42 | |
| Week Change: -2.16% Year-to-date Change: -18.7% | |
| MGA Links: Profile News Message Board | |
| Charts:- Daily , Weekly | |
| Add MGA to Watchlist: View: Get Complete MGA Trend Analysis ➞ | |
 | CAE CAE Inc. |
| Sector: Industrials | |
| SubSector: Aerospace/Defense Products & Services | |
| MarketCap: 3739.61 Millions | |
| Recent Price: 19.90 Market Intelligence Score: 100 | |
| Day Percent Change: 0.86% Day Change: 0.17 | |
| Week Change: 4.52% Year-to-date Change: -7.8% | |
| CAE Links: Profile News Message Board | |
| Charts:- Daily , Weekly | |
| Add CAE to Watchlist: View: Get Complete CAE Trend Analysis ➞ | |
 | CVE Cenovus Energy Inc. |
| Sector: Energy | |
| SubSector: Oil & Gas Drilling & Exploration | |
| MarketCap: 2369.29 Millions | |
| Recent Price: 20.52 Market Intelligence Score: 36 | |
| Day Percent Change: 0.86% Day Change: 0.18 | |
| Week Change: -4.4% Year-to-date Change: 23.2% | |
| CVE Links: Profile News Message Board | |
| Charts:- Daily , Weekly | |
| Add CVE to Watchlist: View: Get Complete CVE Trend Analysis ➞ | |
 | IMO Imperial Oil Limited |
| Sector: Energy | |
| SubSector: Major Integrated Oil & Gas | |
| MarketCap: 8171.25 Millions | |
| Recent Price: 67.95 Market Intelligence Score: 26 | |
| Day Percent Change: 0.83% Day Change: 0.56 | |
| Week Change: -3.89% Year-to-date Change: 18.8% | |
| IMO Links: Profile News Message Board | |
| Charts:- Daily , Weekly | |
| Add IMO to Watchlist: View: Get Complete IMO Trend Analysis ➞ | |
 | SU Suncor Energy Inc. |
| Sector: Energy | |
| SubSector: Independent Oil & Gas | |
| MarketCap: 21550.6 Millions | |
| Recent Price: 37.95 Market Intelligence Score: 44 | |
| Day Percent Change: 0.80% Day Change: 0.30 | |
| Week Change: -3.7% Year-to-date Change: 18.5% | |
| SU Links: Profile News Message Board | |
| Charts:- Daily , Weekly | |
| Add SU to Watchlist: View: Get Complete SU Trend Analysis ➞ | |
 | ENB Enbridge Inc. |
| Sector: Energy | |
| SubSector: Oil & Gas Pipelines | |
| MarketCap: 62578.4 Millions | |
| Recent Price: 35.85 Market Intelligence Score: 83 | |
| Day Percent Change: 0.74% Day Change: 0.26 | |
| Week Change: 0.1% Year-to-date Change: -0.5% | |
| ENB Links: Profile News Message Board | |
| Charts:- Daily , Weekly | |
| Add ENB to Watchlist: View: Get Complete ENB Trend Analysis ➞ | |
 | FTS Fortis Inc. |
| Sector: Utilities | |
| SubSector: Electric Utilities | |
| MarketCap: 14741.8 Millions | |
| Recent Price: 39.81 Market Intelligence Score: 95 | |
| Day Percent Change: 0.73% Day Change: 0.29 | |
| Week Change: 1.92% Year-to-date Change: -3.2% | |
| FTS Links: Profile News Message Board | |
| Charts:- Daily , Weekly | |
| Add FTS to Watchlist: View: Get Complete FTS Trend Analysis ➞ | |
 | LICY Li-Cycle Holdings Corp. |
| Sector: Industrials | |
| SubSector: Waste Management | |
| MarketCap: 959 Millions | |
| Recent Price: 0.67 Market Intelligence Score: 53 | |
| Day Percent Change: 0.69% Day Change: 0.00 | |
| Week Change: -0.84% Year-to-date Change: 7.7% | |
| LICY Links: Profile News Message Board | |
| Charts:- Daily , Weekly | |
| Add LICY to Watchlist: View: Get Complete LICY Trend Analysis ➞ | |
 | DOOO BRP Inc. |
| Sector: Consumer Staples | |
| SubSector: Recreational Vehicles | |
| MarketCap: 638.559 Millions | |
| Recent Price: 67.68 Market Intelligence Score: 36 | |
| Day Percent Change: 0.64% Day Change: 0.43 | |
| Week Change: -1.54% Year-to-date Change: -5.6% | |
| DOOO Links: Profile News Message Board | |
| Charts:- Daily , Weekly | |
| Add DOOO to Watchlist: View: Get Complete DOOO Trend Analysis ➞ | |
 | AEM Agnico Eagle Mines Limited |
| Sector: Materials | |
| SubSector: Gold | |
| MarketCap: 9491.49 Millions | |
| Recent Price: 64.63 Market Intelligence Score: 65 | |
| Day Percent Change: 0.61% Day Change: 0.39 | |
| Week Change: -1.36% Year-to-date Change: 17.8% | |
| AEM Links: Profile News Message Board | |
| Charts:- Daily , Weekly | |
| Add AEM to Watchlist: View: Get Complete AEM Trend Analysis ➞ | |
 | RY Royal Bank of Canada |
| Sector: Financials | |
| SubSector: Money Center Banks | |
| MarketCap: 87565.4 Millions | |
| Recent Price: 97.95 Market Intelligence Score: 54 | |
| Day Percent Change: 0.59% Day Change: 0.57 | |
| Week Change: -0.21% Year-to-date Change: -3.1% | |
| RY Links: Profile News Message Board | |
| Charts:- Daily , Weekly | |
| Add RY to Watchlist: View: Get Complete RY Trend Analysis ➞ | |
 | ERF Enerplus Corporation |
| Sector: Energy | |
| SubSector: Oil & Gas Drilling & Exploration | |
| MarketCap: 372.639 Millions | |
| Recent Price: 19.44 Market Intelligence Score: 43 | |
| Day Percent Change: 0.57% Day Change: 0.11 | |
| Week Change: -5.22% Year-to-date Change: 26.7% | |
| ERF Links: Profile News Message Board | |
| Charts:- Daily , Weekly | |
| Add ERF to Watchlist: View: Get Complete ERF Trend Analysis ➞ | |
 | BB BlackBerry Limited |
| Sector: Technology | |
| SubSector: Communication Equipment | |
| MarketCap: 2100.39 Millions | |
| Recent Price: 2.86 Market Intelligence Score: 63 | |
| Day Percent Change: 0.53% Day Change: 0.02 | |
| Week Change: 0.88% Year-to-date Change: -19.4% | |
| BB Links: Profile News Message Board | |
| Charts:- Daily , Weekly | |
| Add BB to Watchlist: View: Get Complete BB Trend Analysis ➞ | |
 | MERC Mercer International Inc. |
| Sector: Consumer Staples | |
| SubSector: Paper & Paper Products | |
| MarketCap: 509.003 Millions | |
| Recent Price: 10.29 Market Intelligence Score: 88 | |
| Day Percent Change: 0.49% Day Change: 0.05 | |
| Week Change: 2.39% Year-to-date Change: 8.5% | |
| MERC Links: Profile News Message Board | |
| Charts:- Daily , Weekly | |
| Add MERC to Watchlist: View: Get Complete MERC Trend Analysis ➞ | |
 | CNQ Canadian Natural Resources Limited |
| Sector: Energy | |
| SubSector: Independent Oil & Gas | |
| MarketCap: 11925.2 Millions | |
| Recent Price: 75.32 Market Intelligence Score: 41 | |
| Day Percent Change: 0.49% Day Change: 0.37 | |
| Week Change: -3.4% Year-to-date Change: 15.0% | |
| CNQ Links: Profile News Message Board | |
| Charts:- Daily , Weekly | |
| Add CNQ to Watchlist: View: Get Complete CNQ Trend Analysis ➞ | |
 | CNI Canadian National Railway Company |
| Sector: Transports | |
| SubSector: Railroads | |
| MarketCap: 54114.1 Millions | |
| Recent Price: 121.59 Market Intelligence Score: 17 | |
| Day Percent Change: 0.48% Day Change: 0.58 | |
| Week Change: -2.91% Year-to-date Change: -3.2% | |
| CNI Links: Profile News Message Board | |
| Charts:- Daily , Weekly | |
| Add CNI to Watchlist: View: Get Complete CNI Trend Analysis ➞ | |
 | SLF Sun Life Financial Inc. |
| Sector: Financials | |
| SubSector: Property & Casualty Insurance | |
| MarketCap: 17722 Millions | |
| Recent Price: 51.71 Market Intelligence Score: 47 | |
| Day Percent Change: 0.43% Day Change: 0.22 | |
| Week Change: 0.08% Year-to-date Change: -0.3% | |
| SLF Links: Profile News Message Board | |
| Charts:- Daily , Weekly | |
| Add SLF to Watchlist: View: Get Complete SLF Trend Analysis ➞ | |
 | QSR Restaurant Brands International Inc. |
| Sector: Services & Goods | |
| SubSector: Restaurants | |
| MarketCap: 9551 Millions | |
| Recent Price: 73.53 Market Intelligence Score: 32 | |
| Day Percent Change: 0.42% Day Change: 0.31 | |
| Week Change: -0.4% Year-to-date Change: -5.9% | |
| QSR Links: Profile News Message Board | |
| Charts:- Daily , Weekly | |
| Add QSR to Watchlist: View: Get Complete QSR Trend Analysis ➞ | |
 | NVEI Nuvei Corporation |
| Sector: Technology | |
| SubSector: Software - Infrastructure | |
| MarketCap: 5490 Millions | |
| Recent Price: 32.28 Market Intelligence Score: 68 | |
| Day Percent Change: 0.42% Day Change: 0.13 | |
| Week Change: -0.03% Year-to-date Change: 22.9% | |
| NVEI Links: Profile News Message Board | |
| Charts:- Daily , Weekly | |
| Add NVEI to Watchlist: View: Get Complete NVEI Trend Analysis ➞ | |
 | FUSN Fusion Pharmaceuticals Inc. |
| Sector: Health Care | |
| SubSector: Biotechnology | |
| MarketCap: 52487 Millions | |
| Recent Price: 21.51 Market Intelligence Score: 63 | |
| Day Percent Change: 0.42% Day Change: 0.09 | |
| Week Change: 0.42% Year-to-date Change: 124.1% | |
| FUSN Links: Profile News Message Board | |
| Charts:- Daily , Weekly | |
| Add FUSN to Watchlist: View: Get Complete FUSN Trend Analysis ➞ | |
 | CM Canadian Imperial Bank of Commerce |
| Sector: Financials | |
| SubSector: Money Center Banks | |
| MarketCap: 27150.5 Millions | |
| Recent Price: 47.07 Market Intelligence Score: 36 | |
| Day Percent Change: 0.41% Day Change: 0.19 | |
| Week Change: -1.57% Year-to-date Change: -2.2% | |
| CM Links: Profile News Message Board | |
| Charts:- Daily , Weekly | |
| Add CM to Watchlist: View: Get Complete CM Trend Analysis ➞ | |
 | OTEX Open Text Corporation |
| Sector: Technology | |
| SubSector: Application Software | |
| MarketCap: 9291.92 Millions | |
| Recent Price: 35.47 Market Intelligence Score: 35 | |
| Day Percent Change: 0.34% Day Change: 0.12 | |
| Week Change: -0.59% Year-to-date Change: -15.6% | |
| OTEX Links: Profile News Message Board | |
| Charts:- Daily , Weekly | |
| Add OTEX to Watchlist: View: Get Complete OTEX Trend Analysis ➞ | |
 | SHOP Shopify Inc. |
| Sector: Technology | |
| SubSector: Application Software | |
| MarketCap: 45164.2 Millions | |
| Recent Price: 70.60 Market Intelligence Score: 25 | |
| Day Percent Change: 0.28% Day Change: 0.20 | |
| Week Change: -1.02% Year-to-date Change: -9.4% | |
| SHOP Links: Profile News Message Board | |
| Charts:- Daily , Weekly | |
| Add SHOP to Watchlist: View: Get Complete SHOP Trend Analysis ➞ | |
 | AQN Algonquin Power & Utilities Corp. |
| Sector: Utilities | |
| SubSector: Diversified Utilities | |
| MarketCap: 5916.4 Millions | |
| Recent Price: 6.26 Market Intelligence Score: 100 | |
| Day Percent Change: 0.24% Day Change: 0.01 | |
| Week Change: 2.37% Year-to-date Change: -0.9% | |
| AQN Links: Profile News Message Board | |
| Charts:- Daily , Weekly | |
| Add AQN to Watchlist: View: Get Complete AQN Trend Analysis ➞ | |
 | TAC TransAlta Corporation |
| Sector: Utilities | |
| SubSector: Diversified Utilities | |
| MarketCap: 1487.8 Millions | |
| Recent Price: 6.71 Market Intelligence Score: 69 | |
| Day Percent Change: 0.22% Day Change: 0.01 | |
| Week Change: 1.13% Year-to-date Change: -19.3% | |
| TAC Links: Profile News Message Board | |
| Charts:- Daily , Weekly | |
| Add TAC to Watchlist: View: Get Complete TAC Trend Analysis ➞ | |
| To view more stocks, click on Next / Previous arrows or select different range: 0 - 25 , 25 - 50 , 50 - 75 , 75 - 100 , 100 - 125 | ||
| Click To Change The Sort Order: By Market Cap or Company Size Performance: Year-to-date, Week and Day | |
| Select Chart Type: | ||
 Best Stocks Today 12Stocks.com |
© 2024 12Stocks.com Terms & Conditions Privacy Contact Us
All Information Provided Only For Education And Not To Be Used For Investing or Trading. See Terms & Conditions


One More Thing ... Get Best Stocks Delivered Daily!
Never Ever Miss A Move With Our Top Ten Stocks Lists
Find Best Stocks In Any Market - Bull or Bear Market
Take A Peek At Our Top Ten Stocks Lists: Daily, Weekly, Year-to-Date & Top Trends
Find Best Stocks In Any Market - Bull or Bear Market
Take A Peek At Our Top Ten Stocks Lists: Daily, Weekly, Year-to-Date & Top Trends
Canada Stocks With Best Up Trends [0-bearish to 100-bullish]: Brookfield Renewable[100], CAE [100], Algonquin Power[100], Algonquin Power[95], Fortis [95], Descartes Systems[95], New Gold[95], City Office[93], Mercer [88], Tilray [85], Enbridge [83]
Best Canada Stocks Year-to-Date:
Aurora Cannabis[1416.17%], Fusion [124.06%], McEwen Mining[59.5%], D-Wave Quantum[57.85%], OrganiGram [51.91%], Hudbay Minerals[47.28%], IAMGOLD [42.29%], Gold Royalty[39.79%], Endeavour Silver[33.25%], Cronos [28.71%], New Gold[28.42%] Best Canada Stocks This Week:
Tilray [16.85%], Brookfield Renewable[11.86%], Aurinia [10.18%], Vision Marine[8.51%], Aurora Cannabis[7.76%], OrganiGram [6.99%], Canadian Solar[6.53%], Zymeworks [5.69%], CAE [4.52%], Milestone [3.9%], Cronos [3.86%] Best Canada Stocks Daily:
Vermilion Energy[6.93%], Aurinia [4.04%], OrganiGram [3.92%], Vision Marine[3.31%], Tilray [2.97%], CGI [2.49%], Brookfield Renewable[2.45%], Cameco [1.89%], TFI [1.72%], Pembina Pipeline[1.66%], Crescent Point[1.53%]