
 Login Sign Up


| |||||
 |  | ||||

| 12Stocks.com Market Intelligence |
Best Canada Stocks
|
|
| Quick Read: Top Canada Stocks By Performances & Trends: Daily, Weekly, Year-to-Date, Market Cap (Size) & Technical Trends | |||
| Best Canada Views: Quick Browse View, Summary & Slide Show | |||
| 12Stocks.com Canada Stocks Performances & Trends Daily | |||||||||
|
|  The overall market intelligence score is 21 (0-bearish to 100-bullish) which puts Canada index in short term bearish to neutral trend. The market intelligence score from previous trading session is 46 and a deterioration of trend continues.
| ||||||||
Here are the market intelligence trend scores of the most requested Canada stocks at 12Stocks.com (click stock name for detailed review):
| |||||||||||||||||
| Scroll down this page for most comprehensive review of Canada stocks by performance, trends, technical analysis, charts, fund plays & more | |||||||||||||||||


| 12Stocks.com: Top Performing Canada Index Stocks | ||||||||||||||||||||||||||||||||||||||||||||||||
 The top performing Canada Index stocks year to date are
Now, more recently, over last week, the top performing Canada Index stocks on the move are


|
||||||||||||||||||||||||||||||||||||||||||||||||
| 12Stocks.com: Investing in Canada Index with Stocks | |
|
The following table helps investors and traders sort through current performance and trends (as measured by market intelligence score) of various
stocks in the Canada Index. Quick View: Move mouse or cursor over stock symbol (ticker) to view short-term technical chart and over stock name to view long term chart. Click on  to add stock symbol to your watchlist and to add stock symbol to your watchlist and  to view watchlist. Click on any ticker or stock name for detailed market intelligence report for that stock. to view watchlist. Click on any ticker or stock name for detailed market intelligence report for that stock. |
12Stocks.com Performance of Stocks in Canada Index
| Ticker | Stock Name | Watchlist | Category | Recent Price | Market Intelligence Score | Change % | YTD Change% |
| PSLV | Sprott Physical |   | Financials | 9.01 | 36 | 0.45 | 11.51% |
| TRX | Tanzanian Gold | | Materials | 0.45 | 61 | 0.41 | 17.31% |
| CNQ | Canadian Natural | | Energy | 75.25 | 41 | 0.40 | 14.85% |
| MFC | Manulife Financial | | Financials | 23.66 | 32 | 0.40 | 7.08% |
| OTEX | Open Text | | Technology | 35.47 | 35 | 0.34 | -15.59% |
| NG | NovaGold Resources | | Materials | 3.04 | 65 | 0.33 | -18.72% |
| TD | Toronto-Dominion Bank | | Financials | 58.87 | 42 | 0.31 | -8.90% |
| NFGC | New Found | | Materials | 3.57 | 36 | 0.28 | 1.42% |
| XENE | Xenon | | Health Care | 42.60 | 57 | 0.27 | -7.50% |
| DSGX | Descartes Systems | | Technology | 95.10 | 95 | 0.26 | 13.13% |
| BMO | Bank of Montreal | | Financials | 89.86 | 31 | 0.23 | -9.18% |
| CEF | Sprott Physical | | Financials | 21.29 | 36 | 0.16 | 11.15% |
| FUSN | Fusion | | Health Care | 21.45 | 63 | 0.16 | 123.49% |
| KFS | Kingsway Financial | | Financials | 8.93 | 66 | 0.11 | 6.31% |
| RCI | | Technology | 37.47 | 10 | 0.08 | -19.95% | |
| PAAS | Pan American | | Materials | 18.57 | 43 | 0.03 | 13.75% |
| NAK | Northern Dynasty | | Materials | 0.30 | 51 | 0.00 | -7.83% |
| BLDP | Ballard Power | | Industrials | 2.66 | 44 | 0.00 | -28.11% |
| NGD | New Gold | | Materials | 1.89 | 95 | 0.00 | 29.45% |
| EDSA | Edesa Biotech | | Health Care | 4.45 | 35 | 0.00 | -4.04% |
| MOGO | Mogo | | Financials | 1.84 | 17 | 0.00 | -0.54% |
| ONCY | Oncolytics Biotech | | Health Care | 1.12 | 49 | 0.00 | -17.04% |
| VERO | Venus Concept | | Health Care | 0.67 | 35 | 0.00 | -43.50% |
| PROF | Profound Medical | | Materials | 7.45 | 0 | 0.00 | -12.25% |
| THTX | Thera | | Health Care | 1.30 | 17 | 0.00 | -19.75% |
| To view more stocks, click on Next / Previous arrows or select different range: 0 - 25 , 25 - 50 , 50 - 75 , 75 - 100 , 100 - 125 , 125 - 150 | ||
 | Click To Change The Sort Order: By Market Cap or Company Size Performance: Year-to-date, Week and Day |  |
| Detailed Overview Of Canada Stocks |
| Canada Technical Overview, Leaders & Laggards, Top Canada ETF Funds & Detailed Canada Stocks List, Charts, Trends & More |
| Canada: Technical Analysis, Trends & YTD Performance | |
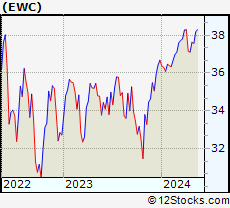
 EWC Weekly Chart |
|
| Long Term Trend: Good | |
| Medium Term Trend: Not Good | |
 EWC Daily Chart |
|
| Short Term Trend: Not Good | |
| Overall Trend Score: 21 | |
| YTD Performance: 1.54% | |
| **Trend Scores & Views Are Only For Educational Purposes And Not For Investing | |
| 12Stocks.com: Investing in Canada Index using Exchange Traded Funds | |
|
The following table shows list of key exchange traded funds (ETF) that
help investors play Canada stock market. For detailed view, check out our ETF Funds section of our website. Quick View: Move mouse or cursor over ETF symbol (ticker) to view short-term technical chart and over ETF name to view long term chart. Click on ticker or stock name for detailed view. Click on to add stock symbol to your watchlist and to view watchlist. |
12Stocks.com List of ETFs that track Canada Index
| Ticker | ETF Name | Watchlist | Recent Price | Market Intelligence Score | Change % | Week % | Year-to-date % |
| EWC | Canada | | 37.24 | 21 | 0.83 | -1.02 | 1.54% |
| 12Stocks.com: Charts, Trends, Fundamental Data and Performances of Canada Stocks | |
|
We now take in-depth look at all Canada stocks including charts, multi-period performances and overall trends (as measured by market intelligence score). One can sort Canada stocks (click link to choose) by Daily, Weekly and by Year-to-Date performances. Also, one can sort by size of the company or by market capitalization. |
| Select Your Default Chart Type: | |||||
| |||||
| Click on stock symbol or name for detailed view. Click on to add stock symbol to your watchlist and to view watchlist. Quick View: Move mouse or cursor over "Daily" to quickly view daily technical stock chart and over "Weekly" to view weekly technical stock chart. | |||||

 | PSLV Sprott Physical Silver Trust |
| Sector: Financials | |
| SubSector: Exchange Traded Fund | |
| MarketCap: 765.851 Millions | |
| Recent Price: 9.01 Market Intelligence Score: 36 | |
| Day Percent Change: 0.45% Day Change: 0.04 | |
| Week Change: -2.49% Year-to-date Change: 11.5% | |
| PSLV Links: Profile News Message Board | |
| Charts:- Daily , Weekly | |
| Add PSLV to Watchlist: View: Get Complete PSLV Trend Analysis ➞ | |
 | TRX Tanzanian Gold Corporation |
| Sector: Materials | |
| SubSector: Gold | |
| MarketCap: 95.9619 Millions | |
| Recent Price: 0.45 Market Intelligence Score: 61 | |
| Day Percent Change: 0.41% Day Change: 0.00 | |
| Week Change: -3.04% Year-to-date Change: 17.3% | |
| TRX Links: Profile News Message Board | |
| Charts:- Daily , Weekly | |
| Add TRX to Watchlist: View: Get Complete TRX Trend Analysis ➞ | |
 | CNQ Canadian Natural Resources Limited |
| Sector: Energy | |
| SubSector: Independent Oil & Gas | |
| MarketCap: 11925.2 Millions | |
| Recent Price: 75.25 Market Intelligence Score: 41 | |
| Day Percent Change: 0.40% Day Change: 0.30 | |
| Week Change: -3.49% Year-to-date Change: 14.9% | |
| CNQ Links: Profile News Message Board | |
| Charts:- Daily , Weekly | |
| Add CNQ to Watchlist: View: Get Complete CNQ Trend Analysis ➞ | |
 | MFC Manulife Financial Corporation |
| Sector: Financials | |
| SubSector: Life Insurance | |
| MarketCap: 22188.7 Millions | |
| Recent Price: 23.66 Market Intelligence Score: 32 | |
| Day Percent Change: 0.40% Day Change: 0.09 | |
| Week Change: 0.83% Year-to-date Change: 7.1% | |
| MFC Links: Profile News Message Board | |
| Charts:- Daily , Weekly | |
| Add MFC to Watchlist: View: Get Complete MFC Trend Analysis ➞ | |
 | OTEX Open Text Corporation |
| Sector: Technology | |
| SubSector: Application Software | |
| MarketCap: 9291.92 Millions | |
| Recent Price: 35.47 Market Intelligence Score: 35 | |
| Day Percent Change: 0.34% Day Change: 0.12 | |
| Week Change: -0.59% Year-to-date Change: -15.6% | |
| OTEX Links: Profile News Message Board | |
| Charts:- Daily , Weekly | |
| Add OTEX to Watchlist: View: Get Complete OTEX Trend Analysis ➞ | |
 | NG NovaGold Resources Inc. |
| Sector: Materials | |
| SubSector: Gold | |
| MarketCap: 2499.49 Millions | |
| Recent Price: 3.04 Market Intelligence Score: 65 | |
| Day Percent Change: 0.33% Day Change: 0.01 | |
| Week Change: 3.4% Year-to-date Change: -18.7% | |
| NG Links: Profile News Message Board | |
| Charts:- Daily , Weekly | |
| Add NG to Watchlist: View: Get Complete NG Trend Analysis ➞ | |
 | TD The Toronto-Dominion Bank |
| Sector: Financials | |
| SubSector: Money Center Banks | |
| MarketCap: 75152.4 Millions | |
| Recent Price: 58.87 Market Intelligence Score: 42 | |
| Day Percent Change: 0.31% Day Change: 0.18 | |
| Week Change: -0.86% Year-to-date Change: -8.9% | |
| TD Links: Profile News Message Board | |
| Charts:- Daily , Weekly | |
| Add TD to Watchlist: View: Get Complete TD Trend Analysis ➞ | |
 | NFGC New Found Gold Corp. |
| Sector: Materials | |
| SubSector: Gold | |
| MarketCap: 868 Millions | |
| Recent Price: 3.57 Market Intelligence Score: 36 | |
| Day Percent Change: 0.28% Day Change: 0.01 | |
| Week Change: -4.8% Year-to-date Change: 1.4% | |
| NFGC Links: Profile News Message Board | |
| Charts:- Daily , Weekly | |
| Add NFGC to Watchlist: View: Get Complete NFGC Trend Analysis ➞ | |
 | XENE Xenon Pharmaceuticals Inc. |
| Sector: Health Care | |
| SubSector: Biotechnology | |
| MarketCap: 388.585 Millions | |
| Recent Price: 42.60 Market Intelligence Score: 57 | |
| Day Percent Change: 0.27% Day Change: 0.11 | |
| Week Change: 5.2% Year-to-date Change: -7.5% | |
| XENE Links: Profile News Message Board | |
| Charts:- Daily , Weekly | |
| Add XENE to Watchlist: View: Get Complete XENE Trend Analysis ➞ | |
 | DSGX The Descartes Systems Group Inc |
| Sector: Technology | |
| SubSector: Business Software & Services | |
| MarketCap: 2830.58 Millions | |
| Recent Price: 95.10 Market Intelligence Score: 95 | |
| Day Percent Change: 0.26% Day Change: 0.25 | |
| Week Change: 0.91% Year-to-date Change: 13.1% | |
| DSGX Links: Profile News Message Board | |
| Charts:- Daily , Weekly | |
| Add DSGX to Watchlist: View: Get Complete DSGX Trend Analysis ➞ | |
 | BMO Bank of Montreal |
| Sector: Financials | |
| SubSector: Money Center Banks | |
| MarketCap: 32830.2 Millions | |
| Recent Price: 89.86 Market Intelligence Score: 31 | |
| Day Percent Change: 0.23% Day Change: 0.21 | |
| Week Change: -1.15% Year-to-date Change: -9.2% | |
| BMO Links: Profile News Message Board | |
| Charts:- Daily , Weekly | |
| Add BMO to Watchlist: View: Get Complete BMO Trend Analysis ➞ | |
 | CEF Sprott Physical Gold and Silver Trust |
| Sector: Financials | |
| SubSector: Asset Management | |
| MarketCap: 2485.33 Millions | |
| Recent Price: 21.29 Market Intelligence Score: 36 | |
| Day Percent Change: 0.16% Day Change: 0.04 | |
| Week Change: -1.64% Year-to-date Change: 11.2% | |
| CEF Links: Profile News Message Board | |
| Charts:- Daily , Weekly | |
| Add CEF to Watchlist: View: Get Complete CEF Trend Analysis ➞ | |
 | FUSN Fusion Pharmaceuticals Inc. |
| Sector: Health Care | |
| SubSector: Biotechnology | |
| MarketCap: 52487 Millions | |
| Recent Price: 21.45 Market Intelligence Score: 63 | |
| Day Percent Change: 0.16% Day Change: 0.03 | |
| Week Change: 0.16% Year-to-date Change: 123.5% | |
| FUSN Links: Profile News Message Board | |
| Charts:- Daily , Weekly | |
| Add FUSN to Watchlist: View: Get Complete FUSN Trend Analysis ➞ | |
 | KFS Kingsway Financial Services Inc. |
| Sector: Financials | |
| SubSector: Property & Casualty Insurance | |
| MarketCap: 47.5812 Millions | |
| Recent Price: 8.93 Market Intelligence Score: 66 | |
| Day Percent Change: 0.11% Day Change: 0.01 | |
| Week Change: 4.08% Year-to-date Change: 6.3% | |
| KFS Links: Profile News Message Board | |
| Charts:- Daily , Weekly | |
| Add KFS to Watchlist: View: Get Complete KFS Trend Analysis ➞ | |
 | RCI Rogers Communications Inc. |
| Sector: Technology | |
| SubSector: Wireless Communications | |
| MarketCap: 22111.6 Millions | |
| Recent Price: 37.47 Market Intelligence Score: 10 | |
| Day Percent Change: 0.08% Day Change: 0.03 | |
| Week Change: -1.29% Year-to-date Change: -20.0% | |
| RCI Links: Profile News Message Board | |
| Charts:- Daily , Weekly | |
| Add RCI to Watchlist: View: Get Complete RCI Trend Analysis ➞ | |
 | PAAS Pan American Silver Corp. |
| Sector: Materials | |
| SubSector: Silver | |
| MarketCap: 2832.56 Millions | |
| Recent Price: 18.57 Market Intelligence Score: 43 | |
| Day Percent Change: 0.03% Day Change: 0.00 | |
| Week Change: -2.34% Year-to-date Change: 13.8% | |
| PAAS Links: Profile News Message Board | |
| Charts:- Daily , Weekly | |
| Add PAAS to Watchlist: View: Get Complete PAAS Trend Analysis ➞ | |
 | NAK Northern Dynasty Minerals Ltd. |
| Sector: Materials | |
| SubSector: Industrial Metals & Minerals | |
| MarketCap: 167.01 Millions | |
| Recent Price: 0.30 Market Intelligence Score: 51 | |
| Day Percent Change: 0.00% Day Change: 0.00 | |
| Week Change: 1.02% Year-to-date Change: -7.8% | |
| NAK Links: Profile News Message Board | |
| Charts:- Daily , Weekly | |
| Add NAK to Watchlist: View: Get Complete NAK Trend Analysis ➞ | |
 | BLDP Ballard Power Systems Inc. |
| Sector: Industrials | |
| SubSector: Industrial Electrical Equipment | |
| MarketCap: 2124.79 Millions | |
| Recent Price: 2.66 Market Intelligence Score: 44 | |
| Day Percent Change: 0.00% Day Change: 0.00 | |
| Week Change: 2.31% Year-to-date Change: -28.1% | |
| BLDP Links: Profile News Message Board | |
| Charts:- Daily , Weekly | |
| Add BLDP to Watchlist: View: Get Complete BLDP Trend Analysis ➞ | |
 | NGD New Gold Inc. |
| Sector: Materials | |
| SubSector: Gold | |
| MarketCap: 398.119 Millions | |
| Recent Price: 1.89 Market Intelligence Score: 95 | |
| Day Percent Change: 0.00% Day Change: 0.00 | |
| Week Change: 4.42% Year-to-date Change: 29.5% | |
| NGD Links: Profile News Message Board | |
| Charts:- Daily , Weekly | |
| Add NGD to Watchlist: View: Get Complete NGD Trend Analysis ➞ | |
 | EDSA Edesa Biotech, Inc. |
| Sector: Health Care | |
| SubSector: Biotechnology | |
| MarketCap: 19.6785 Millions | |
| Recent Price: 4.45 Market Intelligence Score: 35 | |
| Day Percent Change: 0.00% Day Change: 0.00 | |
| Week Change: 0.73% Year-to-date Change: -4.0% | |
| EDSA Links: Profile News Message Board | |
| Charts:- Daily , Weekly | |
| Add EDSA to Watchlist: View: Get Complete EDSA Trend Analysis ➞ | |
 | MOGO Mogo Inc. |
| Sector: Financials | |
| SubSector: Credit Services | |
| MarketCap: 21.9208 Millions | |
| Recent Price: 1.84 Market Intelligence Score: 17 | |
| Day Percent Change: 0.00% Day Change: 0.00 | |
| Week Change: -1.6% Year-to-date Change: -0.5% | |
| MOGO Links: Profile News Message Board | |
| Charts:- Daily , Weekly | |
| Add MOGO to Watchlist: View: Get Complete MOGO Trend Analysis ➞ | |
 | ONCY Oncolytics Biotech Inc. |
| Sector: Health Care | |
| SubSector: Biotechnology | |
| MarketCap: 57.3785 Millions | |
| Recent Price: 1.12 Market Intelligence Score: 49 | |
| Day Percent Change: 0.00% Day Change: 0.00 | |
| Week Change: 2.75% Year-to-date Change: -17.0% | |
| ONCY Links: Profile News Message Board | |
| Charts:- Daily , Weekly | |
| Add ONCY to Watchlist: View: Get Complete ONCY Trend Analysis ➞ | |
 | VERO Venus Concept Inc. |
| Sector: Health Care | |
| SubSector: Medical Appliances & Equipment | |
| MarketCap: 101.08 Millions | |
| Recent Price: 0.67 Market Intelligence Score: 35 | |
| Day Percent Change: 0.00% Day Change: 0.00 | |
| Week Change: -2.57% Year-to-date Change: -43.5% | |
| VERO Links: Profile News Message Board | |
| Charts:- Daily , Weekly | |
| Add VERO to Watchlist: View: Get Complete VERO Trend Analysis ➞ | |
 | PROF Profound Medical Corp. |
| Sector: Materials | |
| SubSector: Industrial Metals & Minerals | |
| MarketCap: 121.41 Millions | |
| Recent Price: 7.45 Market Intelligence Score: 0 | |
| Day Percent Change: 0.00% Day Change: 0.00 | |
| Week Change: -7.22% Year-to-date Change: -12.3% | |
| PROF Links: Profile News Message Board | |
| Charts:- Daily , Weekly | |
| Add PROF to Watchlist: View: Get Complete PROF Trend Analysis ➞ | |
 | THTX Theratechnologies Inc. |
| Sector: Health Care | |
| SubSector: Drugs - Generic | |
| MarketCap: 123.185 Millions | |
| Recent Price: 1.30 Market Intelligence Score: 17 | |
| Day Percent Change: 0.00% Day Change: 0.00 | |
| Week Change: 0% Year-to-date Change: -19.8% | |
| THTX Links: Profile News Message Board | |
| Charts:- Daily , Weekly | |
| Add THTX to Watchlist: View: Get Complete THTX Trend Analysis ➞ | |
| To view more stocks, click on Next / Previous arrows or select different range: 0 - 25 , 25 - 50 , 50 - 75 , 75 - 100 , 100 - 125 , 125 - 150 | ||
| Click To Change The Sort Order: By Market Cap or Company Size Performance: Year-to-date, Week and Day | |
| Select Chart Type: | ||
 Best Stocks Today 12Stocks.com |
© 2024 12Stocks.com Terms & Conditions Privacy Contact Us
All Information Provided Only For Education And Not To Be Used For Investing or Trading. See Terms & Conditions


One More Thing ... Get Best Stocks Delivered Daily!
Never Ever Miss A Move With Our Top Ten Stocks Lists
Find Best Stocks In Any Market - Bull or Bear Market
Take A Peek At Our Top Ten Stocks Lists: Daily, Weekly, Year-to-Date & Top Trends
Find Best Stocks In Any Market - Bull or Bear Market
Take A Peek At Our Top Ten Stocks Lists: Daily, Weekly, Year-to-Date & Top Trends
Canada Stocks With Best Up Trends [0-bearish to 100-bullish]: Brookfield Renewable[100], CAE [100], Algonquin Power[100], Algonquin Power[95], Fortis [95], Descartes Systems[95], New Gold[95], City Office[93], Mercer [88], Tilray [85], Enbridge [83]
Best Canada Stocks Year-to-Date:
Aurora Cannabis[1416.17%], Fusion [123.49%], McEwen Mining[63.66%], D-Wave Quantum[57.28%], OrganiGram [51.91%], Hudbay Minerals[49.82%], IAMGOLD [45.06%], Gold Royalty[40.83%], Endeavour Silver[37.06%], New Gold[29.45%], Cronos [28.71%] Best Canada Stocks This Week:
Tilray [16.85%], Brookfield Renewable[12.42%], Repare [9.53%], Vision Marine[8.51%], Aurora Cannabis[7.76%], Aurinia [7.03%], OrganiGram [6.99%], Canadian Solar[6.2%], Zymeworks [5.69%], Xenon [5.2%], Denison Mines[4.93%] Best Canada Stocks Daily:
Vermilion Energy[6.26%], Repare [6.21%], Denison Mines[4.41%], Cameco [4.05%], OrganiGram [3.92%], Trilogy Metals[3.39%], Vision Marine[3.31%], CGI [3.25%], Tilray [2.97%], Brookfield Renewable[2.96%], Stantec [2.62%]